

📈📉 Fantom and Render Long Setups!

Overview
Chart #1 - Fantom (FTMUSDT) Daily Chart
Chart #2 - Bitcoin (BTCUSD) Weekly Chart
Chart #3 - Dogecoin (DOGEUSDT) Daily Chart
Chart #4 - Render (RNDRUSDT) Daily Chart
Chart #5 - Fear and Greed Index

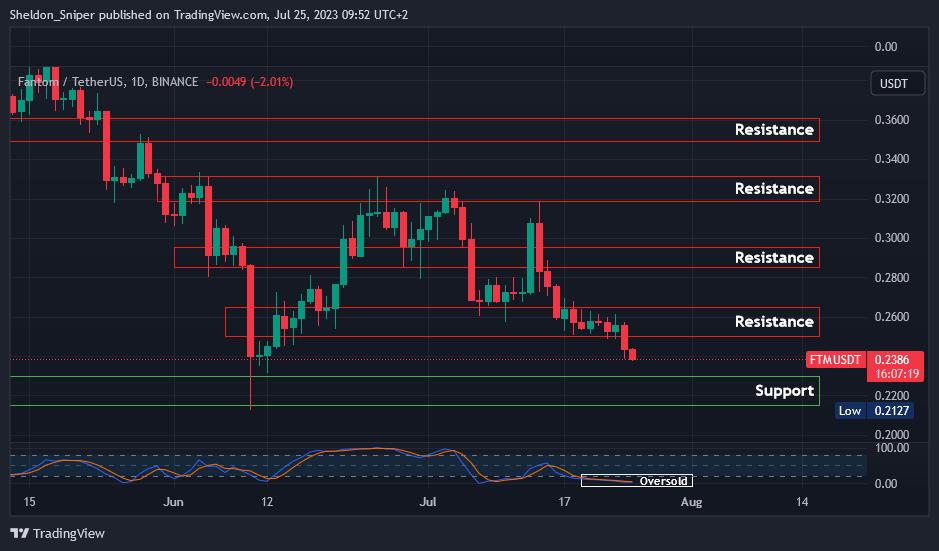
Chart #1 - Fantom (FTMUSDT) Daily Chart
Chartist: Sheldon
(For the chart screenshot, click here.)
FTM has been hit hard over the last two weeks and is getting close to the next major area of support at $21.50 - $23.00.
If the outcome of today’s and tomorrow's FOMC meeting is favorable to the market, there might be an opportunity to take a long from here up to $24.50 - $26.50, or even the area of resistance after that at $28.50 - $29.50, with a stop loss at just below $21.00.
It is always best to enter any trade after the outcome of the meeting, rather than try to pre-determine how the market is going to react to the outcome of the decision.
Sign-up and trade on Bybit today.
Exclusive $30,000 deposit rewards and bonuses up for grabs!
Chart #2 - Bitcoin (BTCUSD) Weekly Chart
Chartist: Kyle

(For the chart screenshot, click here.)
Bitcoin continues to consolidate sideways and slightly down. Major support can be found between $27,000 and $27,800, which is the 21 EMA (yellow) and 200 MA (orange).
If the price consolidates for the same amount of time as the prior consolidation, then the consolidation could continue into the end of August.
The price, however, has hit the 50% level of the prior expansive candle (marked out by the green horizontal line), which was an area of interest.
𝗣𝗿𝗶𝗺𝗲 𝗫𝗕𝗧
Sign up for a new Trading Account on Prime XBT!
Receive a deposit bonus of up to $7,000 with promo code: KyleDoops

Sign up for a new Trading Account on Prime XBT!
Receive a deposit bonus of up to $7,000 with promo code: SheldonSniper
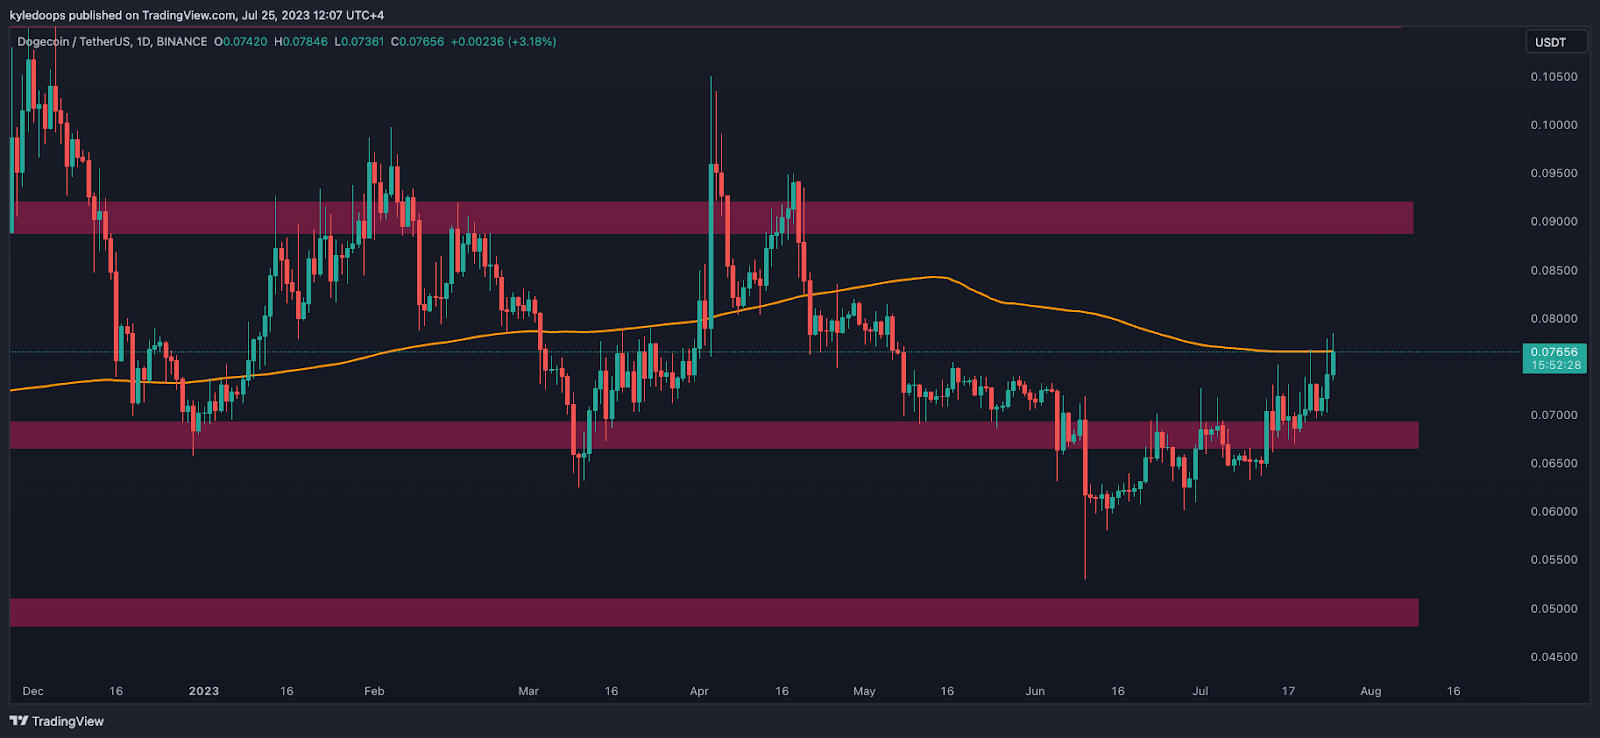
Chart #3 - Dogecoin (DOGEUSDT) Daily Chart
Chartist: Kyle
(For the chart screenshot, click here.)
DOGE is pressing into the 200-day moving average, which is acting as resistance.
If it reclaims and closes a daily candle above this level, then expect expansion.
This is especially noteworthy after Elon has rebranded Twitter as Twitter X and stated he has plans to convert it into the “everything app”. Speculators believe DOGE will play a massive role in this, as that is Elon's coin of choice.
Claim your Bitget sign-up bonuses here (details below).
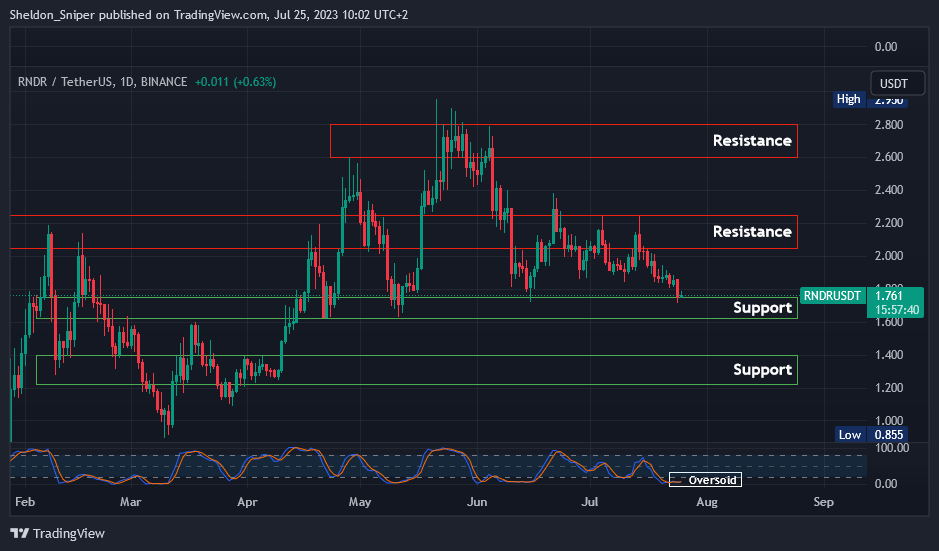
Chart #4 - Render (RNDRUSDT) Daily Chart
Chartist: Sheldon
(For the chart screenshot, click here.)
RNDR is also a coin that could be a potential trade for after the FOMC meeting, especially if the outcome of the decision is favorable to the market.
The Stoch RSI is currently oversold on the daily chart, and the price is now at the $1.60 - $1.75 area of support. This could provide an entry if it holds and if the market is satisfied with the FOMC’s outcome.
The next area of resistance and take profit area would be at $2.05 - $2.25, with a stop loss just below $1.60. If the current area of support does not hold, then the next area of support below is at $1.20 - $1.40.
Claim your Bitget sign-up bonuses here (details below).
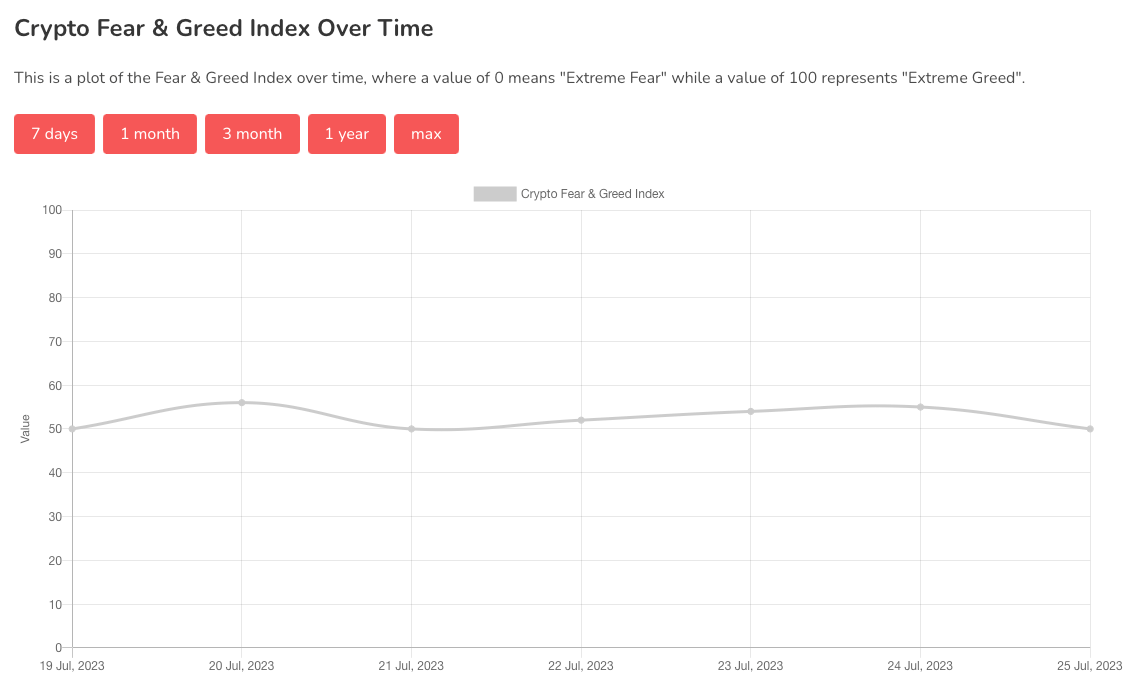
Chart #5 - Fear and Greed Index
The Bitcoin Fear and Greed Index is sitting at 50 today, Neutral.
The highest the index has been over the past seven days is 56, and the lowest is 50.
Banter’s Take
The market may be pulling back ahead of the FOMC and CPI print so as to de-risk. Once we get the results tomorrow, we will know what to expect as the next main play.
Stay safe my friends!
Go to our Crypto Banter Discord here where Sheldon and Kyle give updates on the charts and trades from The Daily Candle newsletter!