

📈📉 Final Line of Support for the TOTAL2 as DXY Nears Resistance! Sell-Off Incoming?
📈📉 Final Line of Support for the TOTAL2 as DXY Nears Resistance! Sell-Off Incoming?

Chart #1 - Litecoin (LTCUSDT) 1-Day Chart
Chartist: Sheldon

(For the chart screenshot, click here.)
The price of LTC is holding up impressively despite the current volatile crypto market.
With the Litecoin halving event set for early August, I believe that LTC could still potentially see some upside in the coming month.
It is currently trading and consolidating within the $90 - $93 resistance area. If the $93 level can be breached, the price should easily push to the next resistance level of $100 - $102.
𝗣𝗿𝗶𝗺𝗲 𝗫𝗕𝗧
Sign up for a new Trading Account on Prime XBT!
Receive a deposit bonus of up to $7,000 with promo code: SheldonSniper
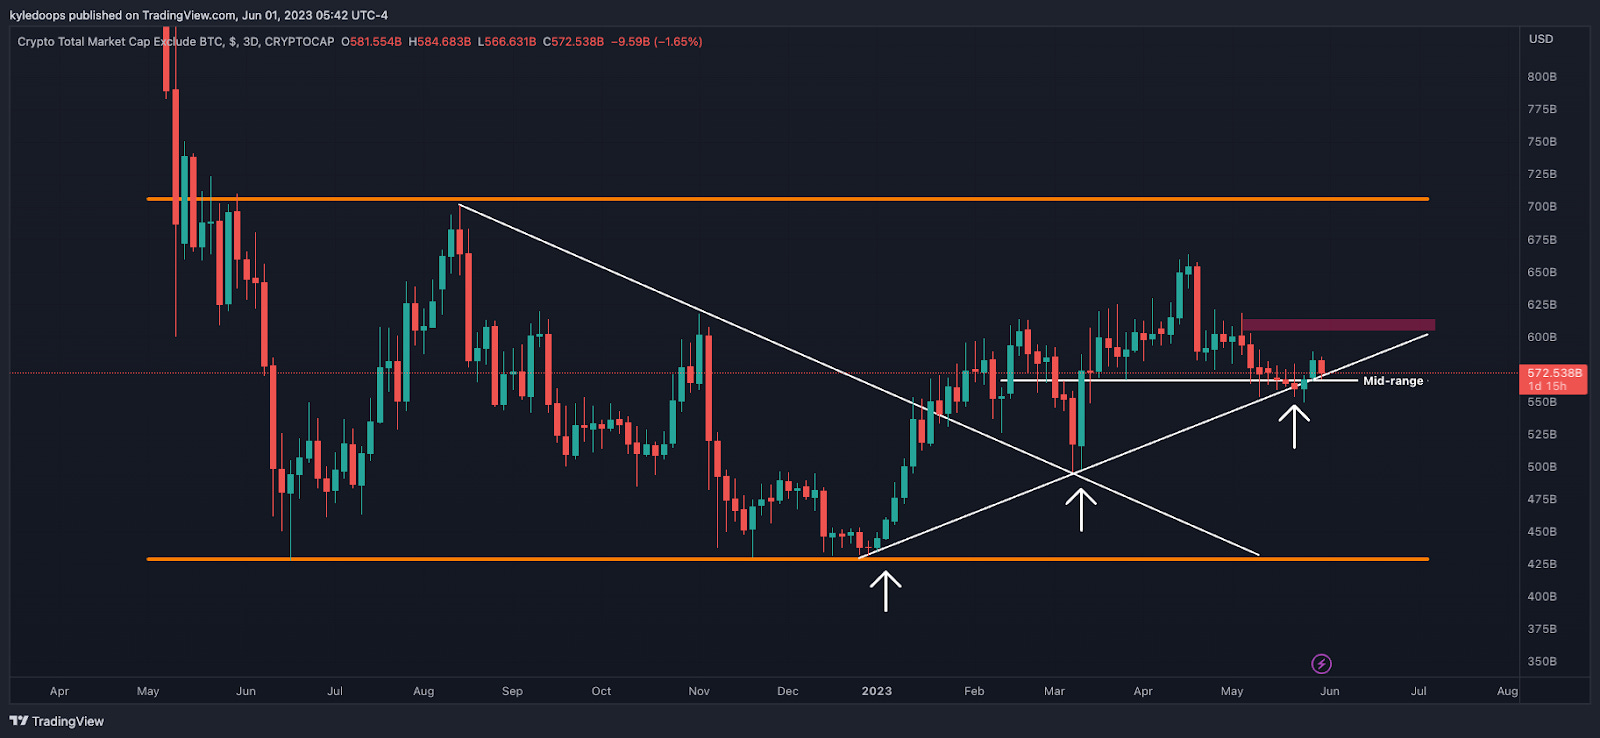
Chart #2 - TOTAL2 3-Day Chart
Chartist: Kyle
(For the chart screenshot, click here.)
This is truly the final line of support for the TOTAL2, and bulls need to act quickly if they want to keep the hope alive.
There's a potential third higher low forming, with a confluence of mid-range holding. If this level is lost, it could trigger significant panic and cause prices to plummet back to the range low.
𝗣𝗿𝗶𝗺𝗲 𝗫𝗕𝗧
Sign up for a new Trading Account on Prime XBT!
Receive a deposit bonus of up to $7,000 with promo code: KyleDoops
Chart #3 - Ethereum (ETHUSD) 1-Day Chart
Chartist: Kyle

(For the chart screenshot, click here.)
ETH is holding onto the pivot level of $1,860; above this is favorable, while below is not.
At the current price, it's above that level. It's also maintaining the 12 & 24 EMAs, which have crossed into a bullish pattern.
If these levels are lost, the next support will be in the middle of the downward sloping parallel channel, which also happens to coincide with the 200 EMA.
Claim your Bitget sign-up bonuses here (details below).
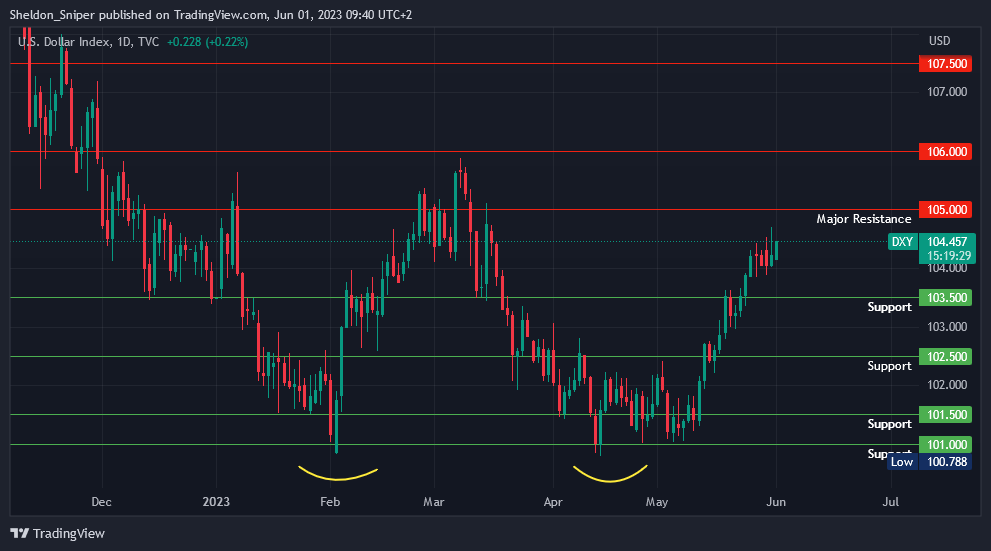
Chart #4 - U.S. Dollar (DXY) 1-Day Chart
Chartist: Sheldon
(For the chart screenshot, click here.)
The DXY has surged over the past three weeks, moving from 101.00 to the current 104.50.
It is rapidly approaching the 105 - 106 resistance area, a zone that has acted as resistance for the previous seven months. A rejection there will be good for the risk-on asset market. The next support to be hit would be 103.50, followed by 102.50.
But if the DXY breaks through the 105 - 106 area, the next resistance is at 107.50.
Claim your Bitget sign-up bonuses here (details below).
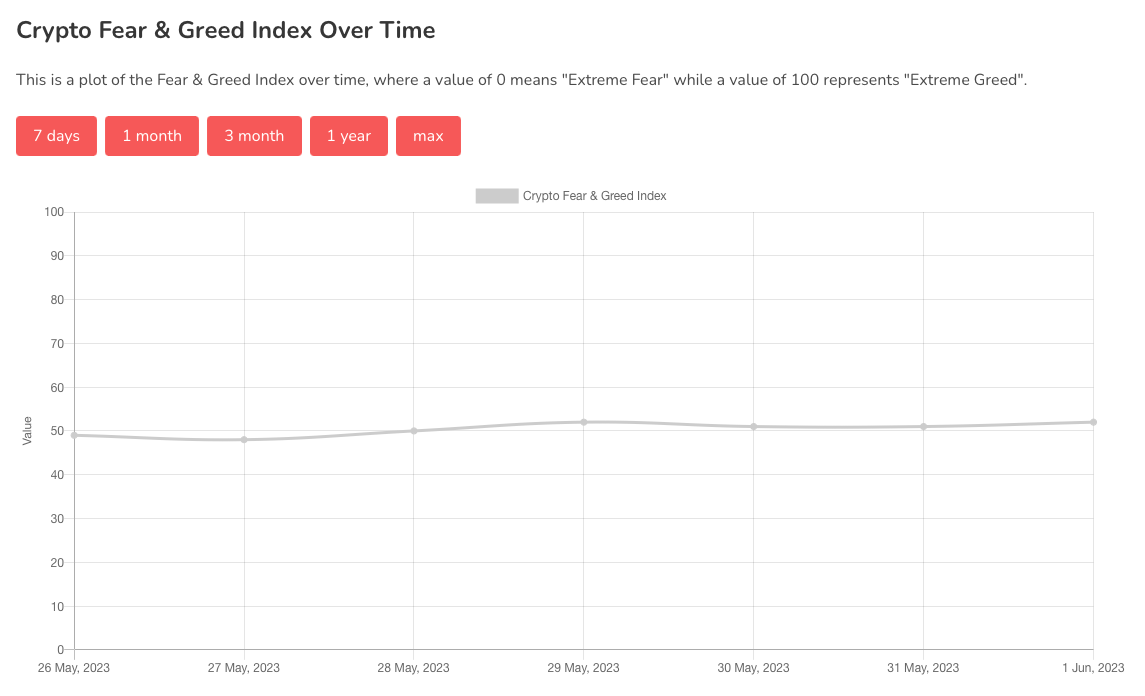
Chart #5 - Bitcoin Fear and Greed Index
The Bitcoin Fear and Greed Index is sitting at 52 today, Neutral.
The highest the index has been over the past seven days is 52, and the lowest is 48.
Banter’s Take
Bulls and bears are both fighting fiercely for the current territory, and time is of the essence.
On the high timeframe, bulls continue to hold the edge, based on the trend. However, on the lower timeframe, bears maintain control.
Stay safe my friends!
Go to our Crypto Banter Discord here where Sheldon and Kyle give updates on the charts and trades from The Daily Candle newsletter!