

📈📉 FTM and AVAX Trade Setups!
📈📉 FTM and AVAX Trade Setups!
PLUS: BTC is Printing Lower-Highs and Lower-Lows!
Overview
Chart #1 - Fantom (FTMUSDT) 8-Hour
Chart #2 - Solana (SOLUSD) Daily
Chart #3 - Manta Network (MANTAUSDT) 2-Hour
Chart #4 - Avalanche (AVAXUSDT) 8-Hour
Chart #5 - Fear and Greed Index
Chart #1 - Fantom (FTMUSDT) 8-Hour
Chartist: Sheldon
(For the chart screenshot, click here.)
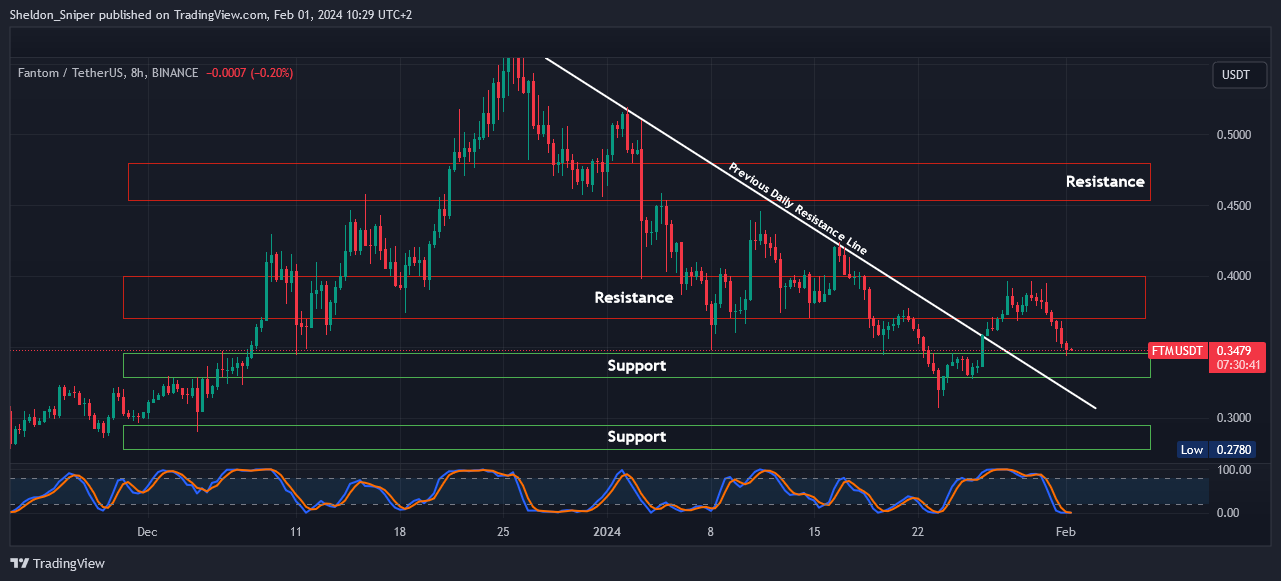
I am waiting for the price of FTM to come down to the next area of support at $0.33 - $0.3450, where I might consider a long trade, provided that price holds that support and the price of BTC stabilizes.
The target take-profit areas are at the next area of resistance at $0.38 - $0.40, and then at $0.45 - $0.4750.
If the price continues lower and breaks through the current support, the next area of support is around $0.28 - $0.30, where the previous daily descending resistance line can be found, and it may act as additional support in that area, offering another possible level for a long trade.
Sign-up and trade on Bybit today.
Exclusive $30,000 deposit rewards and bonuses up for grabs!
Chart #2 - Solana (SOLUSD) Daily
Chartist: Kyle
(For the chart screenshot, click here.)
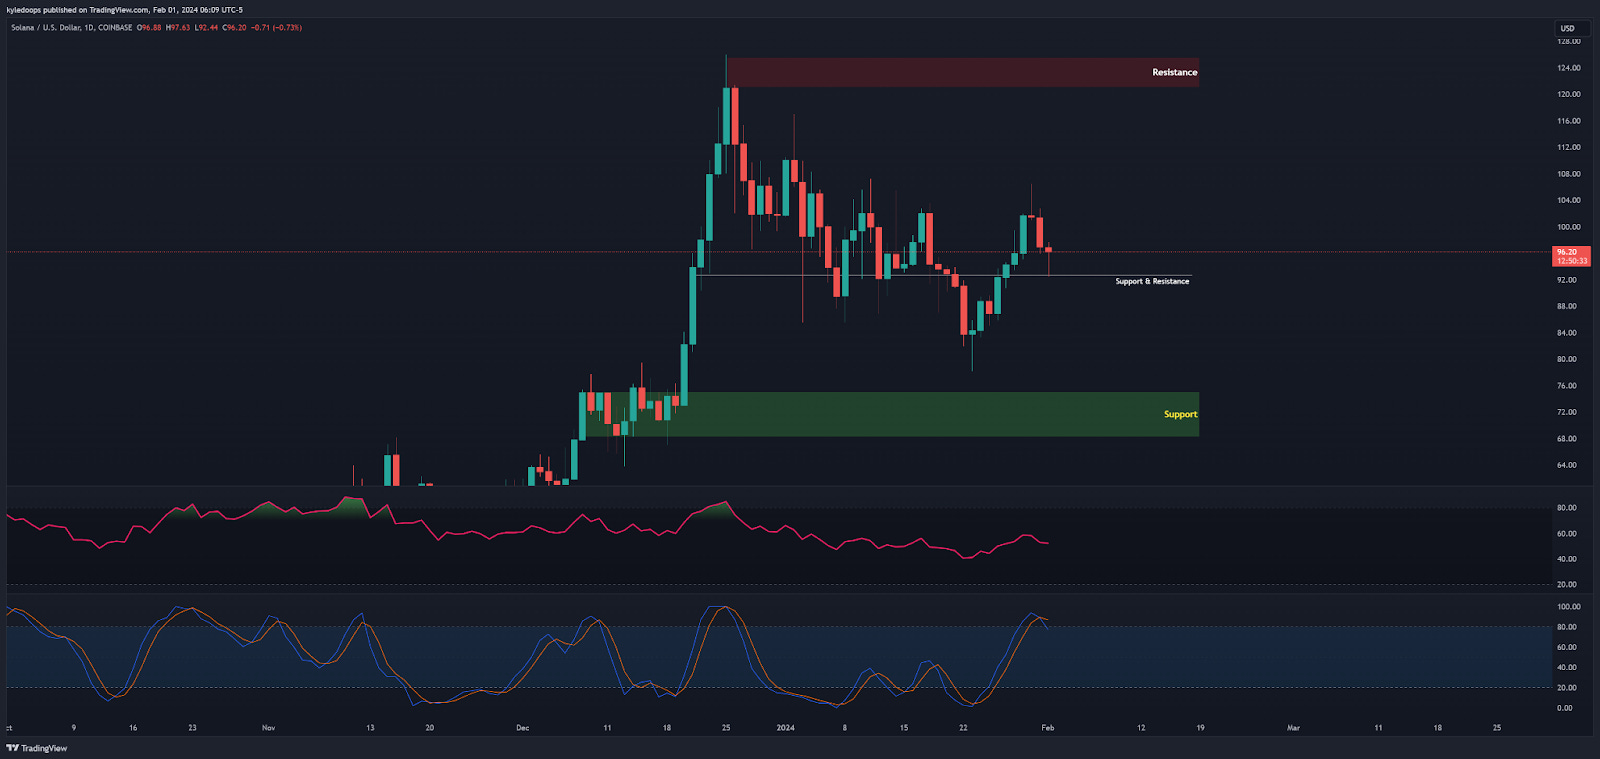
After yesterday's FOMC press conference, SOL found support at $90-$93.
It is not clear yet whether this will be the point it will turn round, so the next support could still be in play.
That is further down at $78-$80.
Claim your Bitget sign-up bonuses here (details below).

Outsmart 99% Of The Market!
Get full access into our Discord And Telegram group, where you'll find all of our premium content!
👉 Trade Signals!
👉 Trade Set-Ups!
👉 Trading Challenges!
👉 Education!
👉 SO MUCH MORE!
Chart #3 - Manta Network (MANTAUSDT) 2-Hour
Chartist: Kyle

(For the chart screenshot, click here.)
MANTA has reached a key support resistance level at $2.88 and is likely to consolidate in this region before its next move.
The next support area is found at $2.30, and the next resistance is at $3.75.
Claim your Bitget sign-up bonuses here (details below).
Chart #4 - Avalanche (AVAXUSDT) 8-Hour
Chartist: Sheldon
(For the chart screenshot, click here.)
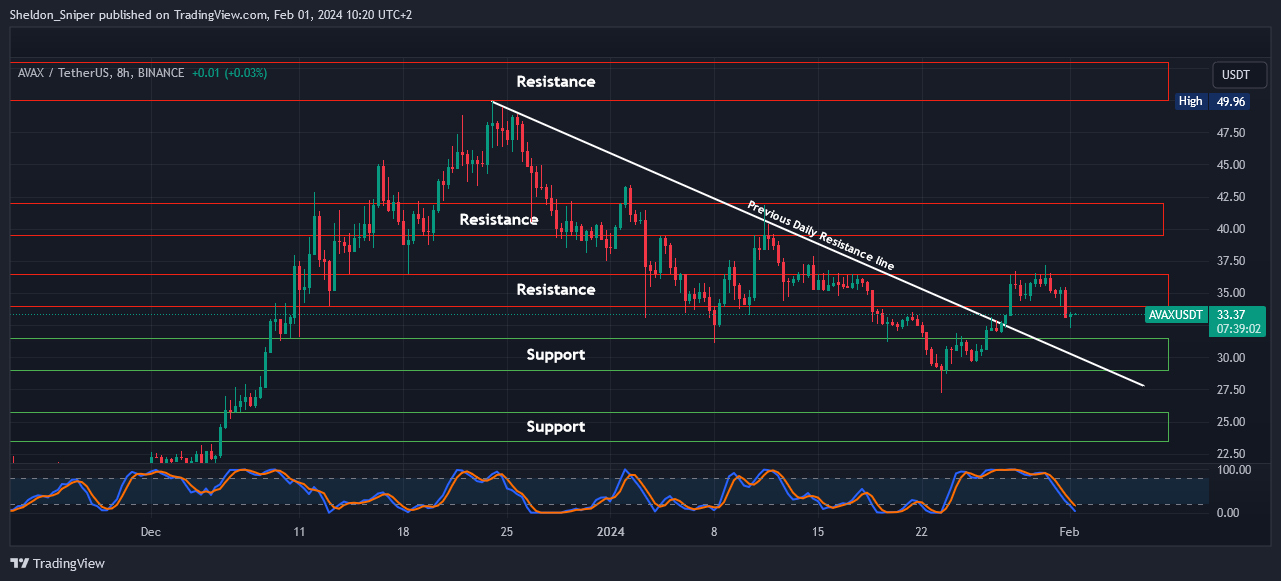
The market reacted negatively to yesterday’s FOMC!
Immediately after the meeting, most crypto started to retrace. I don't believe the correction is over yet, but it's important to identify support areas where buyers could re-enter the market.
On that note, AVAX is again going to test the $28.00 - $31.00 support area. If it stabilizes in this support area, I would consider taking a long position, with the target being the next areas of resistance at $34.00 - $36.50, followed by $39.50 - $42.25.
These trades are all dependent on BTC's performance, and if the market continues to move lower, I will look at the next support area at $23.00 - $26.00 for a potential long trade.
Claim your Bitget sign-up bonuses here (details below).
Chart #5 - Fear and Greed Index
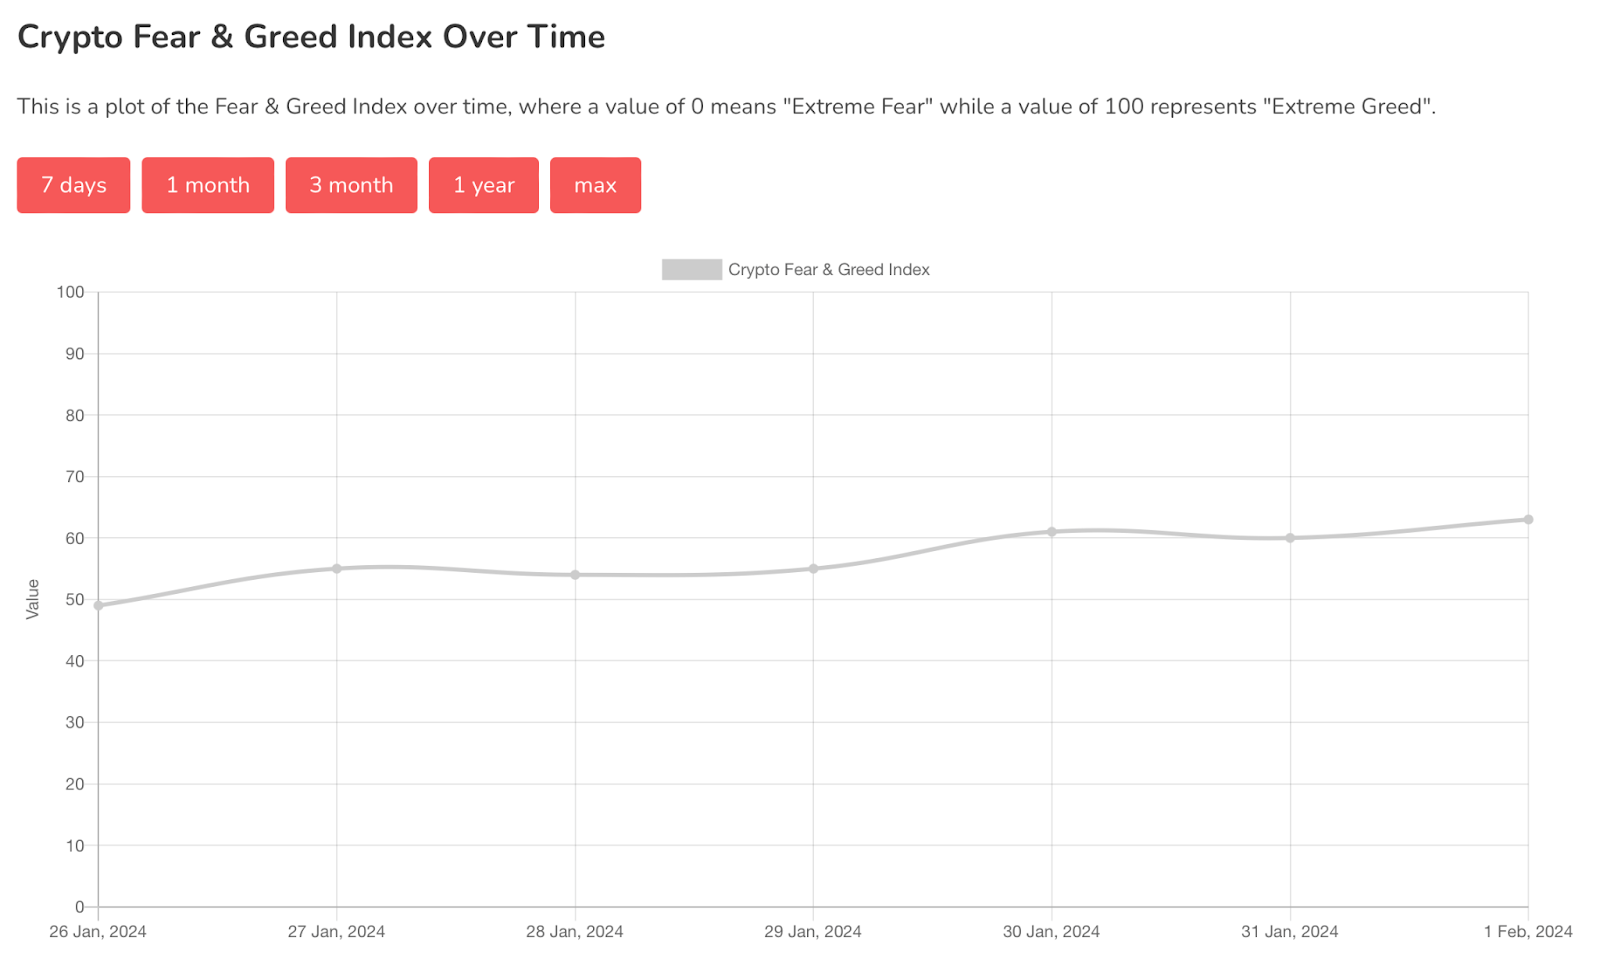
The Fear and Greed Index is sitting at 63 today, indicating Greed.
The highest the index has been over the past seven days is 63, and the lowest is 49.
Banter’s Take
Bitcoin has found local support at $41,900 and may form a range up to $42,400. Technically, Bitcoin is printing lower highs and lower lows, indicating a downtrend. To reverse the trend, it needs to break above $42,700 and stay above it to create new highs.
Stay safe my friends!
Go to our Crypto Banter Discord here where Sheldon and Kyle give updates on the charts and trades from The Daily Candle newsletter!