

📈📉 FTM Swing Low Setup + APT Crucial Levels!
📈📉 FTM Swing Low Setup + APT Crucial Levels!

Overview
Chart #1 - Cardano (ADAUSDT) Daily Chart
Chart #2 - Fantom (FTMUSDT) Daily Chart
Chart #3 - Aptos (APTUSDT) Daily Chart
Chart #4 - Chainlink (LINKUSDT) Daily Chart
Chart #5 - Fear and Greed Index

Chart #1 - Cardano (ADAUSDT) Daily Chart
Chartist: Sheldon
(For the chart screenshot, click here.)
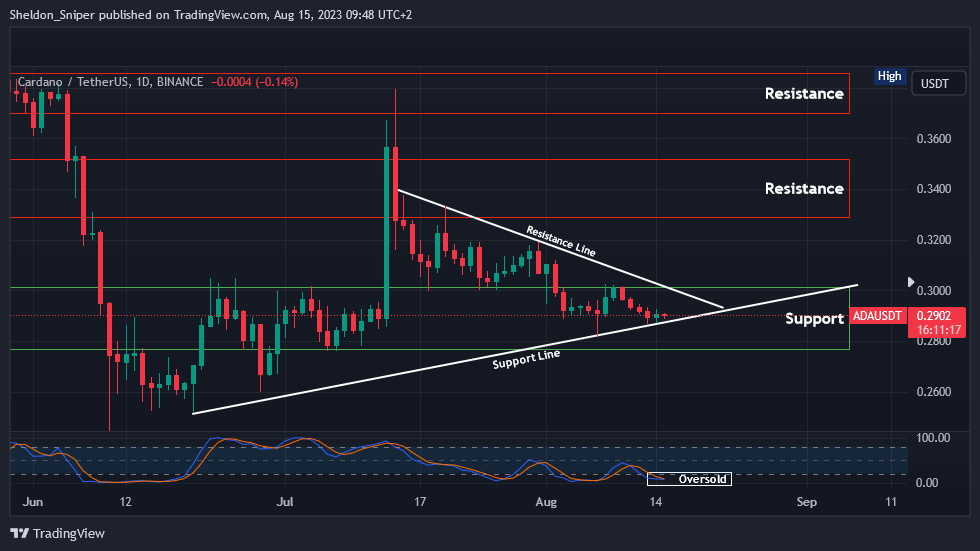
ADA is consolidating within the $0.28 - $0.30 support area, near the daily ascending support line from mid-June.
The price is at $0.29. Should it move higher, it will test $0.30, where the descending resistance line from mid-July is also situated. A breakthrough $0.30 could propel the price to the next major resistance area of $0.33 - $0.35.
Sign-up and trade on Bybit today.
Exclusive $30,000 deposit rewards and bonuses up for grabs!
Chart #2 - Fantom (FTMUSDT) Daily Chart
Chartist: Kyle

(For the chart screenshot, click here.)
FTM has lately been one of the poorest performing L1s based on fundamental metrics.
In terms of price, it has also struggled to gain any traction and continues to consolidate near its range lows. A dip into the 15-cent region would offer an excellent chance for a swing long, as the price is likely to hold at that range low before rebounding.
Over time, one can anticipate a reversion to the mean, at which point the price will approach the 200-day moving average.
𝗣𝗿𝗶𝗺𝗲 𝗫𝗕𝗧
Sign up for a new Trading Account on Prime XBT!
Receive a deposit bonus of up to $7,000 with promo code: KyleDoops

Sign up for a new Trading Account on Prime XBT!
Receive a deposit bonus of up to $7,000 with promo code: SheldonSniper
Chart #3 - Aptos (APTUSDT) Daily Chart
Chartist: Kyle
(For the chart screenshot, click here.)
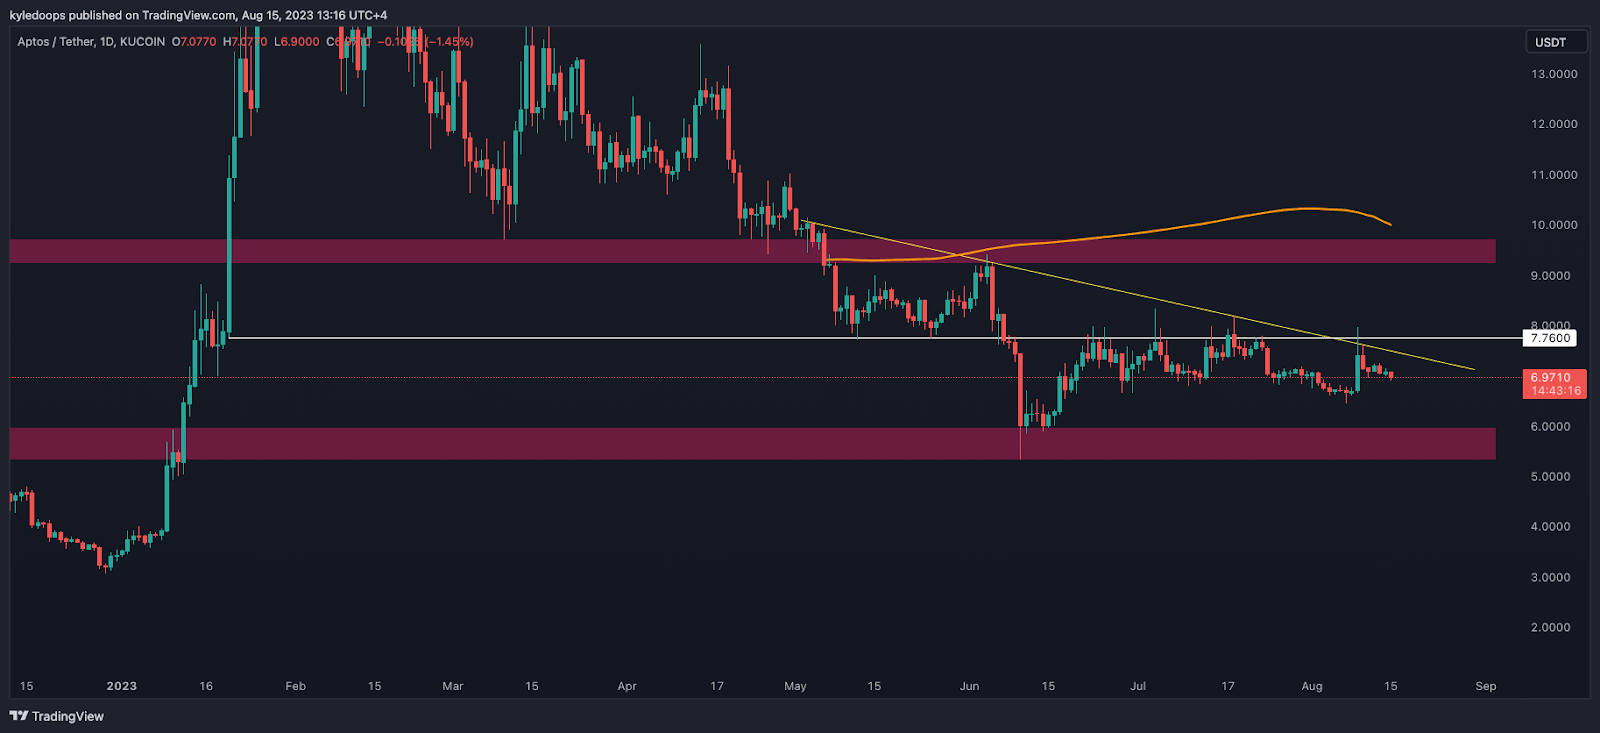
APT has seen a significant increase in TVL, daily active users, and daily transactions. It has been the most notable performer among L1s over the past few weeks.
However, its price remains trapped below the crucial $7.76 mark. Should the price retreat to the range lows at $6, it might offer a chance for a bounce.
There's no trade opportunity until the price either reaches $6 or surpasses $7.76.
Claim your Bitget sign-up bonuses here (details below).
Chart #4 - Chainlink (LINKUSDT) Daily Chart
Chartist: Sheldon
(For the chart screenshot, click here.)
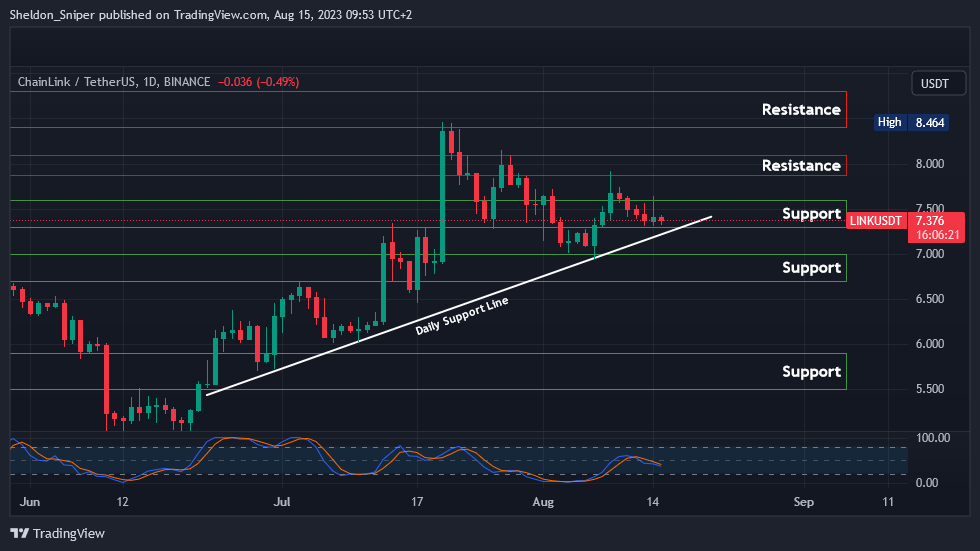
Over the past three days, LINK has been consolidating within the $7.30 - $7.60 support area. If this support holds, I anticipate another upward move, with the price aiming to test the next resistance zone at $7.90 - $8.10.
If the market retraces from its current position and breaches both the $7.30 support level and the daily ascending support line from mid-June, the next significant support area is between $6.70 - $7.00.
LINK's price has shown bullish signs in recent weeks. If BTC continues its upward trend and tests higher levels, LINK should follow.
Claim your Bitget sign-up bonuses here (details below).
Chart #5 - Fear and Greed Index
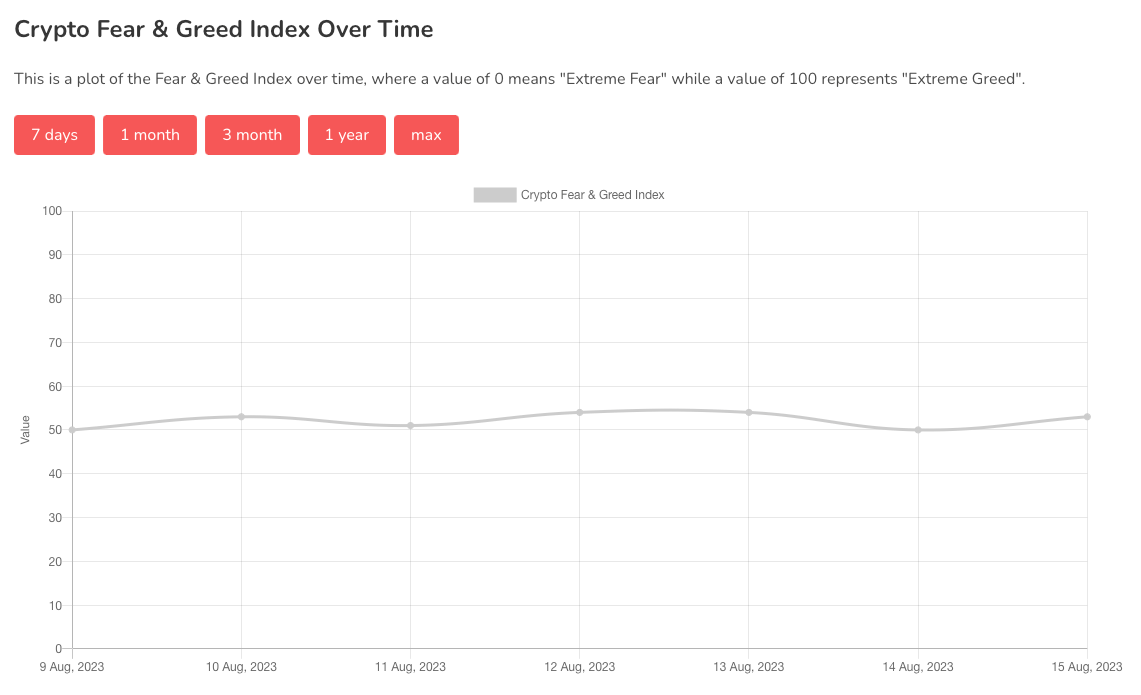
The Fear and Greed Index is sitting at 53 today, Neutral.
The highest the index has been over the past seven days is 54, and the lowest is 50.
Banter’s Take
The market remains flat, lacking a bid. It's challenging to forecast how long this trend might persist before a significant shift occurs. The best estimate is that within the next week, we should see some sort of directional decision.
Stay safe my friends!
Go to our Crypto Banter Discord here where Sheldon and Kyle give updates on the charts and trades from The Daily Candle newsletter!