

📈📉 Further downside? The crucial level Bitcoin must hold!
📈📉 Further downside? The crucial level Bitcoin must hold!

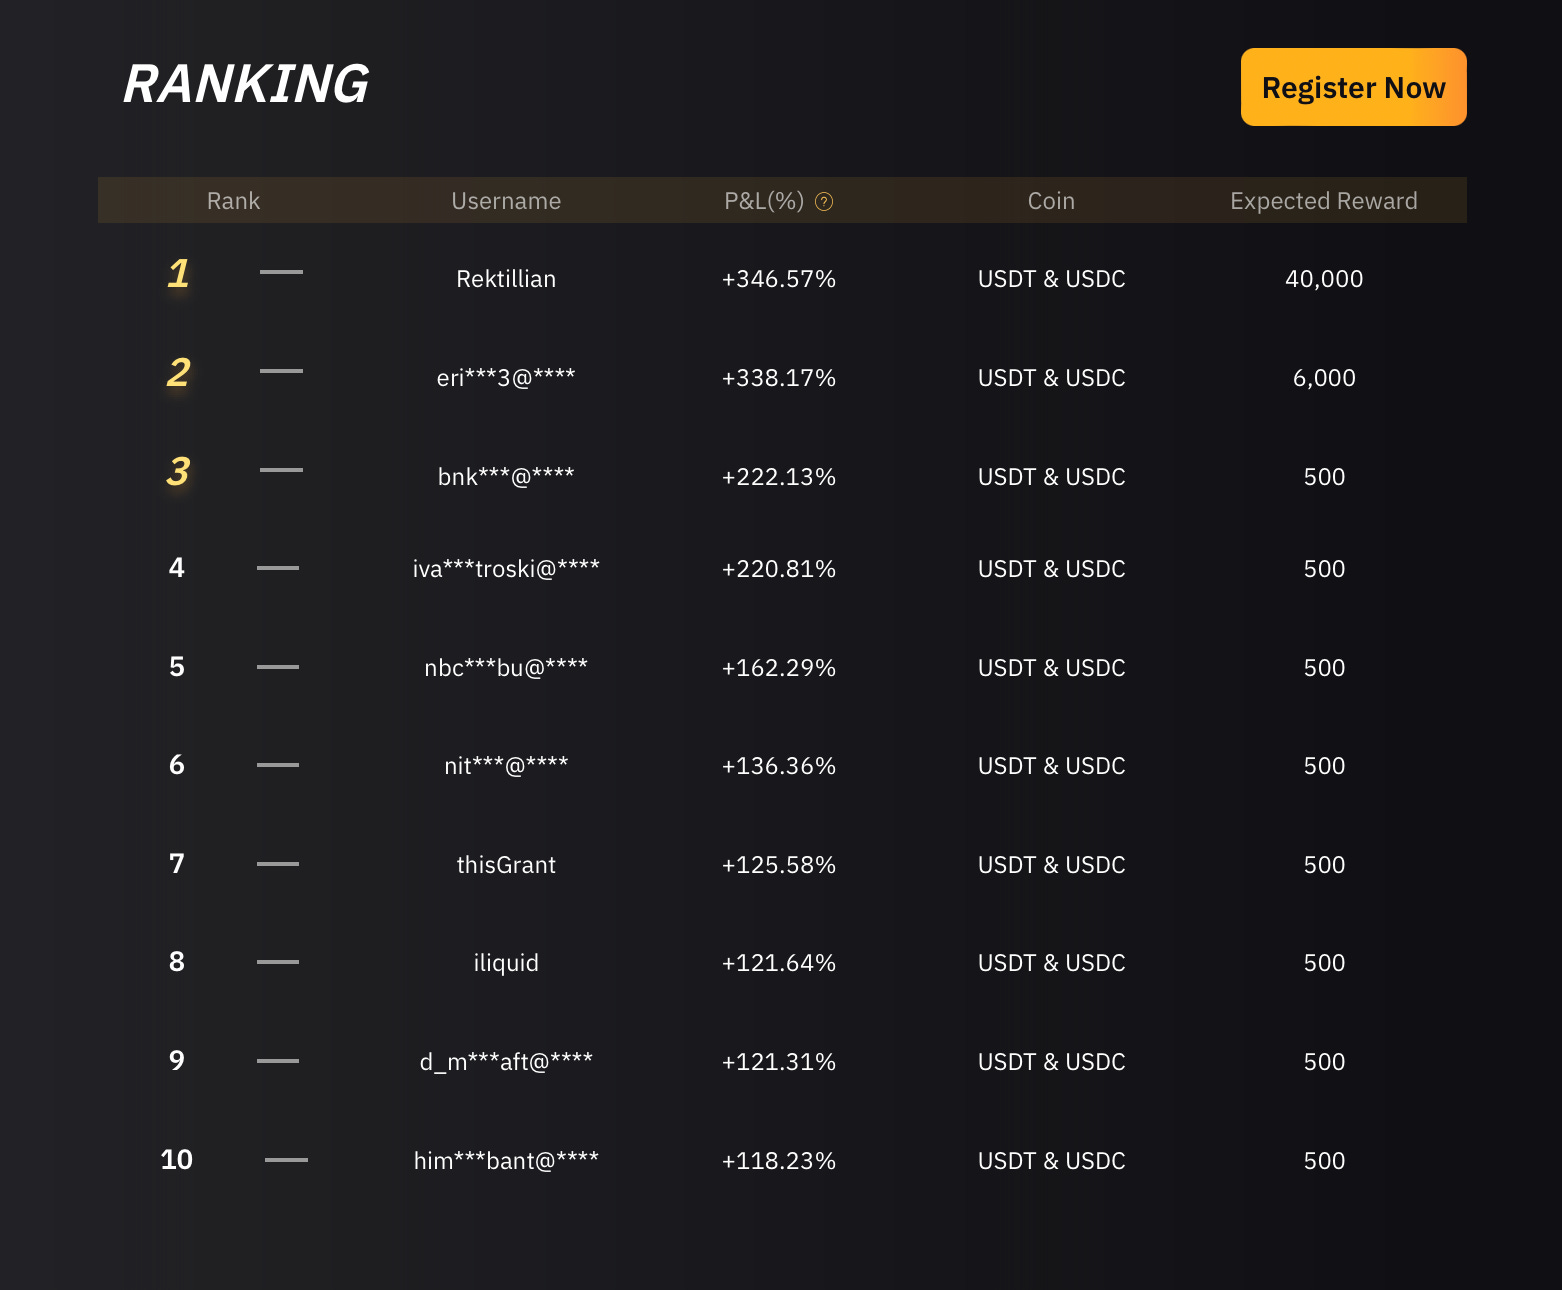
🔥 Trade to Triumph 🔥
Win a Tesla, Rolex & $10,000 Cash!
Don't miss this extraordinary ByBit trading competition by Crypto Banter & Gareth Soloway which begins today! Unleash your trading skills for a chance to win a Tesla, Rolex, and $10,000 cash prizes. Secure your spot in this unrivaled contest now and elevate your crypto trading journey.
Register here to join the elite trader's league!
Competition Leaderboard
Bitget winner - 2530514807
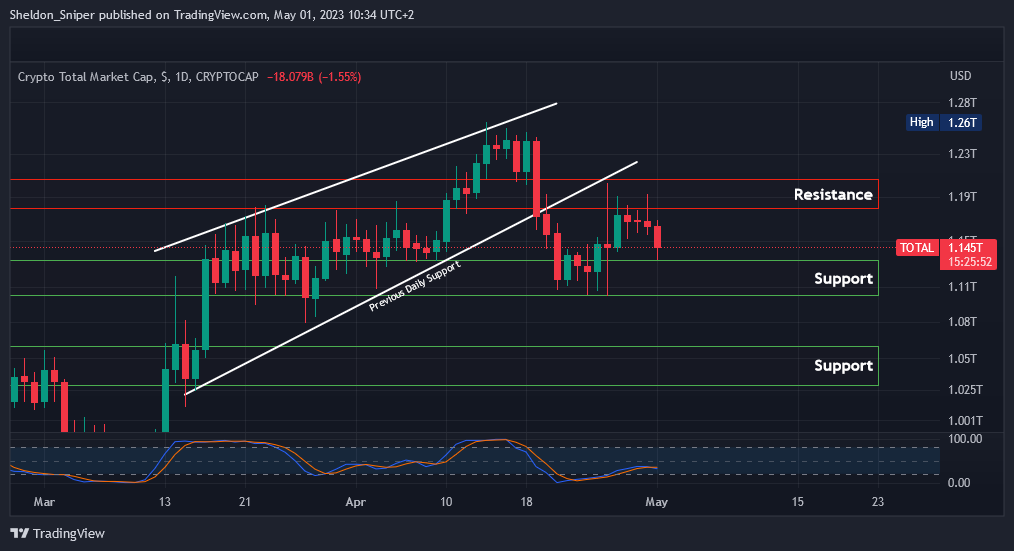
Chart #1 - TOTAL 1-Day Chart
Chartist: Sheldon
(For the chart screenshot, click here.)
This morning the TOTAL has come down to test support at around $1.10T- $1.14T, and with the important US FOMC meeting taking place this Wednesday, I feel that the Market might go sideways over the next two days.
If the TOTAL moves up from here, the next resistance is at $1.18T - $1.20T, whereas a break of the current $1.10T - $1.14T area of support, could take it down to the next support at around $1.03T - $1.06T.
𝗣𝗿𝗶𝗺𝗲 𝗫𝗕𝗧
Sign up for a new Trading Account on Prime XBT!
Receive a deposit bonus of up to $7,000 with promo code: SheldonSniper
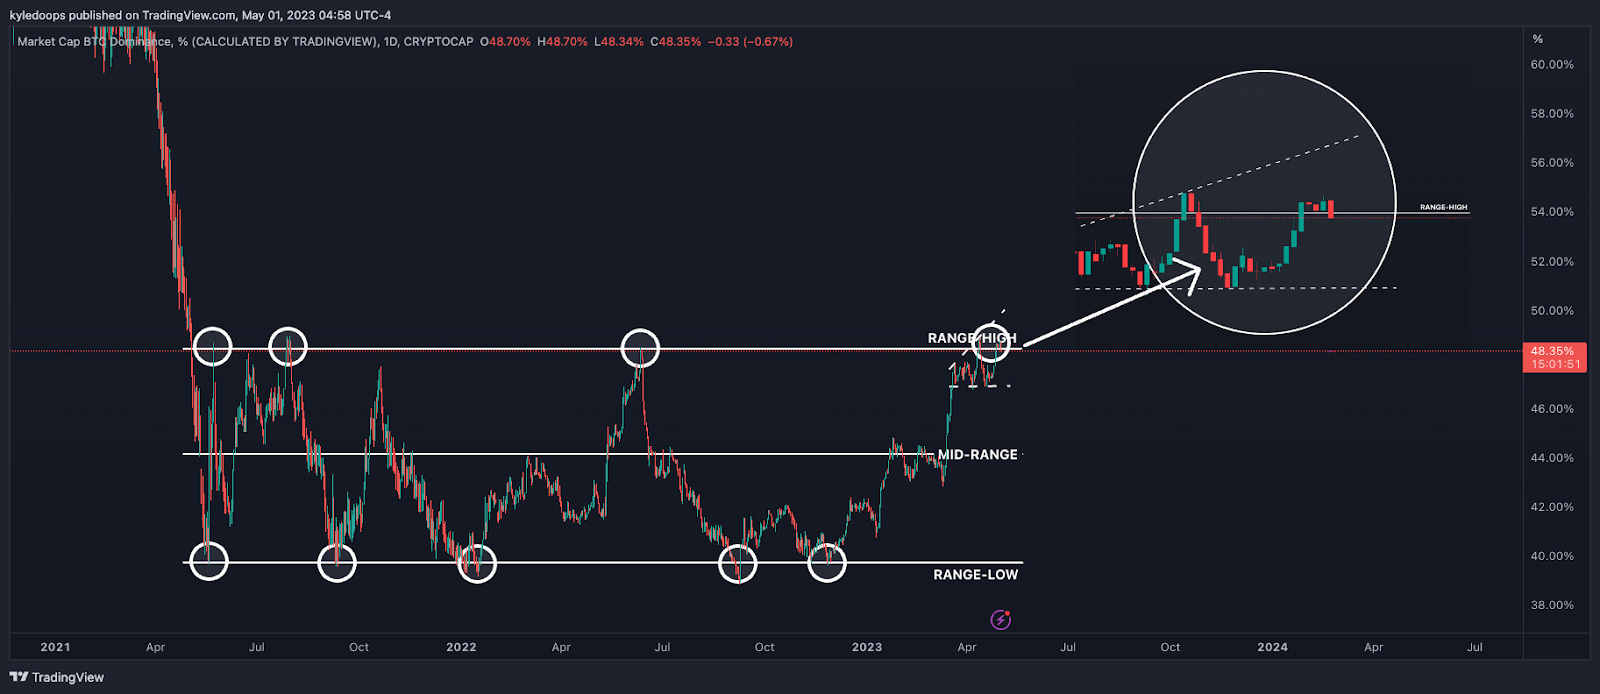
Chart #2 - Bitcoin Dominance (BTC.D) 1-Day Chart
Chartist: Kyle
(For the chart screenshot, click here.)
Bitcoin dominance is pressing the range highs!
This is a strong area of resistance and consequently, both bulls and bears are fighting to win this territory. It will likely take more time to play out but keep an eye on this level since it will determine whether we should be playing altcoins or just sticking with Bitcoin.
I expect the next couple of days to either lead to a convincing break out of this range or break back into the range.
𝗣𝗿𝗶𝗺𝗲 𝗫𝗕𝗧
Sign up for a new Trading Account on Prime XBT!
Receive a deposit bonus of up to $7,000 with promo code: KyleDoops

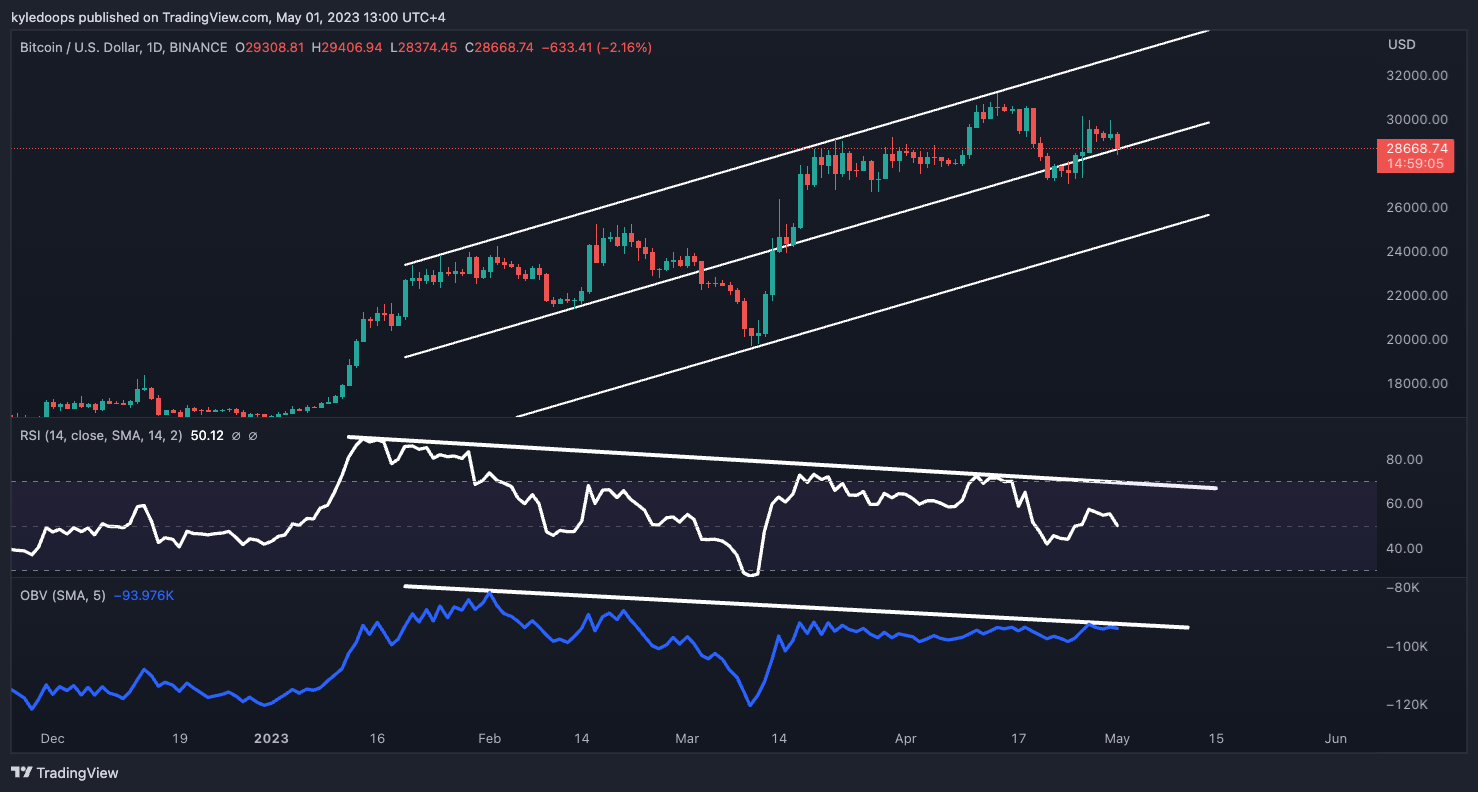
Chart #3 - Bitcoin (BTCUSD) 1-Day Chart
Chartist: Kyle
(For the chart screenshot, click here.)
Bitcoin is still caught within a rising parallel channel.
The recent sell-off has led price into the mid-range of this channel. If a daily candle closes below the mid-level, that being $28,652, where the price is right now, then expect some more downside. The RSI and OBV are still trending down, which is indicative of a bearish divergence since the price has trended up over that same timeframe.
The support areas of interest, if the price sells off, are firstly at $27,000, and if that level is lost, $25,500 is the next major target.
Claim your Bitget sign-up bonuses here (details below).
Chart #4 - DXY 1-Day Chart
Chartist: Sheldon
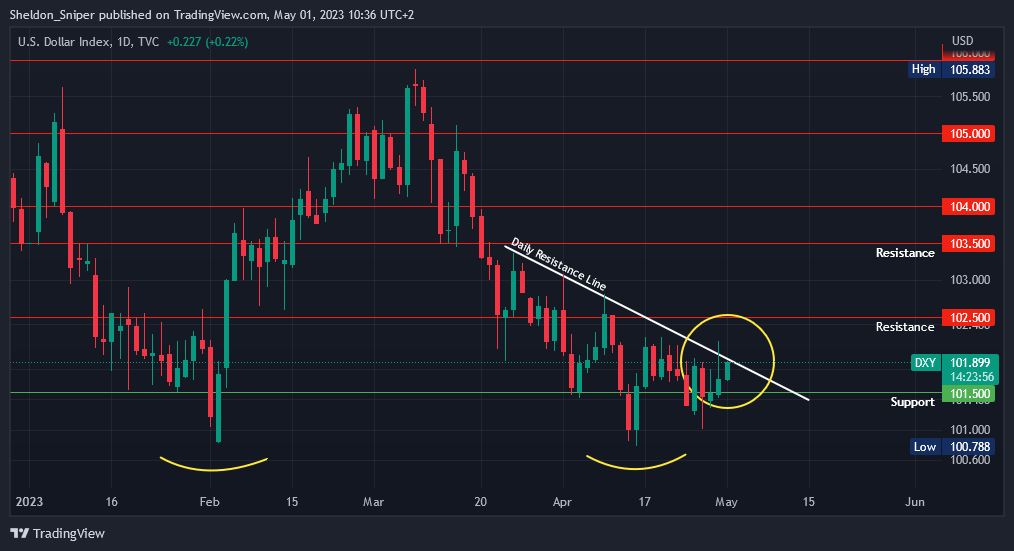
(For the chart screenshot, click here.)
Over the last three days, the DXY has moved up from around 101.40 to 101.90.
The strength of the DXY over the last three days has not affected the Stock and Crypto markets too much, but it has now reached its important ascending daily resistance line.
A break higher could take the DXY to the next major resistance at 102.50, whereas a rejection in this area could take the DXY down to the next support at around 101.50.
The FOMC meeting takes place this Wednesday, and I suspect its outcome will have a big influence on the DXY.
Claim your Bitget sign-up bonuses here (details below).
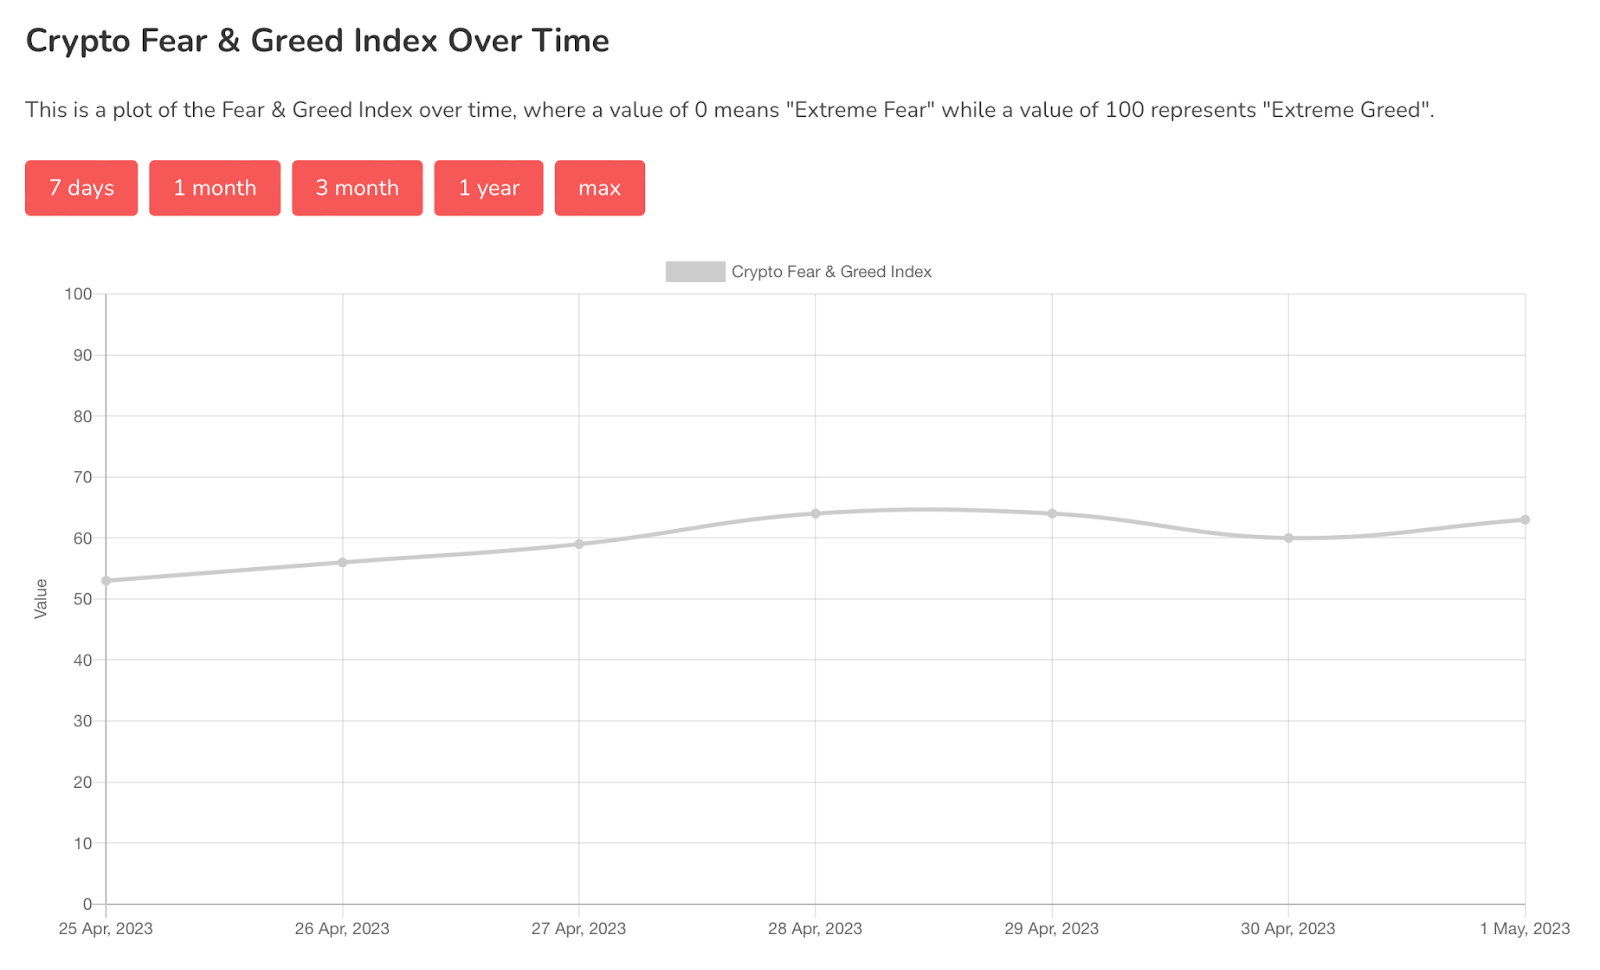
Chart #5 - Bitcoin Fear and Greed Index
The Bitcoin Fear and Greed Index is sitting at 63 today, indicating Greed.
The highest the index has been over the past seven days is 64, and the lowest is 53.
Overall Market Sentiment (Banter’s Take)
The crypto market is somewhat illiquid at the moment which means that volume is low. Low volume matched with price at recent highs with declining RSI and OBV would be indicative of a weak market. But that might just mean that the price needs to cool off for a bit and consolidate lower and find new demand.
Stay safe my friends!
Go to our Crypto Banter Discord here where Sheldon and Kyle give updates on the charts and trades from The Daily Candle newsletter!
Bybit winner - 14006201