

📈📉 GALA Trade Setup!
📈📉 GALA Trade Setup!
CAUTION! High Volatility Imminent!
Overview
Chart #1 - Gala (GALAUSDT) Daily
Chart #2 - Bittensor (TAOUSDT) Daily
Chart #3 - Bitcoin (BTCUSD) 2-Day
Chart #4 - Bitcoin Dominance (BTC.D) Daily
Chart #5 - Fear and Greed Index
Chart #1 - Gala (GALAUSDT) Daily
Chartist: Sheldon

(For the chart screenshot, click here.)
Yesterday, we saw the price of Gala reverse off the $0.02 - $0.022 area of support, where the 0.618 Fibonacci level between the low in October last year and the high at the end of last month can also be found.
This area should hold as a strong area of support, and even though the price has reached the next level of resistance at $0.026, I do expect the price to possibly come down again to test the $0.02 - $0.022 area of support, providing an entry level for a trade.
This expectation hinges on the ETF news being favorable to the market and the price of BTC holding support. A potential area to take profit (TP) would be around the $0.035 - $0.038 area of resistance. Depending on the market, if the price reaches that target, Gala could continue to run to the next area of resistance around $0.042 - $0.045.
A stop loss would be set just below the support of $0.02.
Sign-up and trade on Bybit today.
Exclusive $30,000 deposit rewards and bonuses up for grabs!
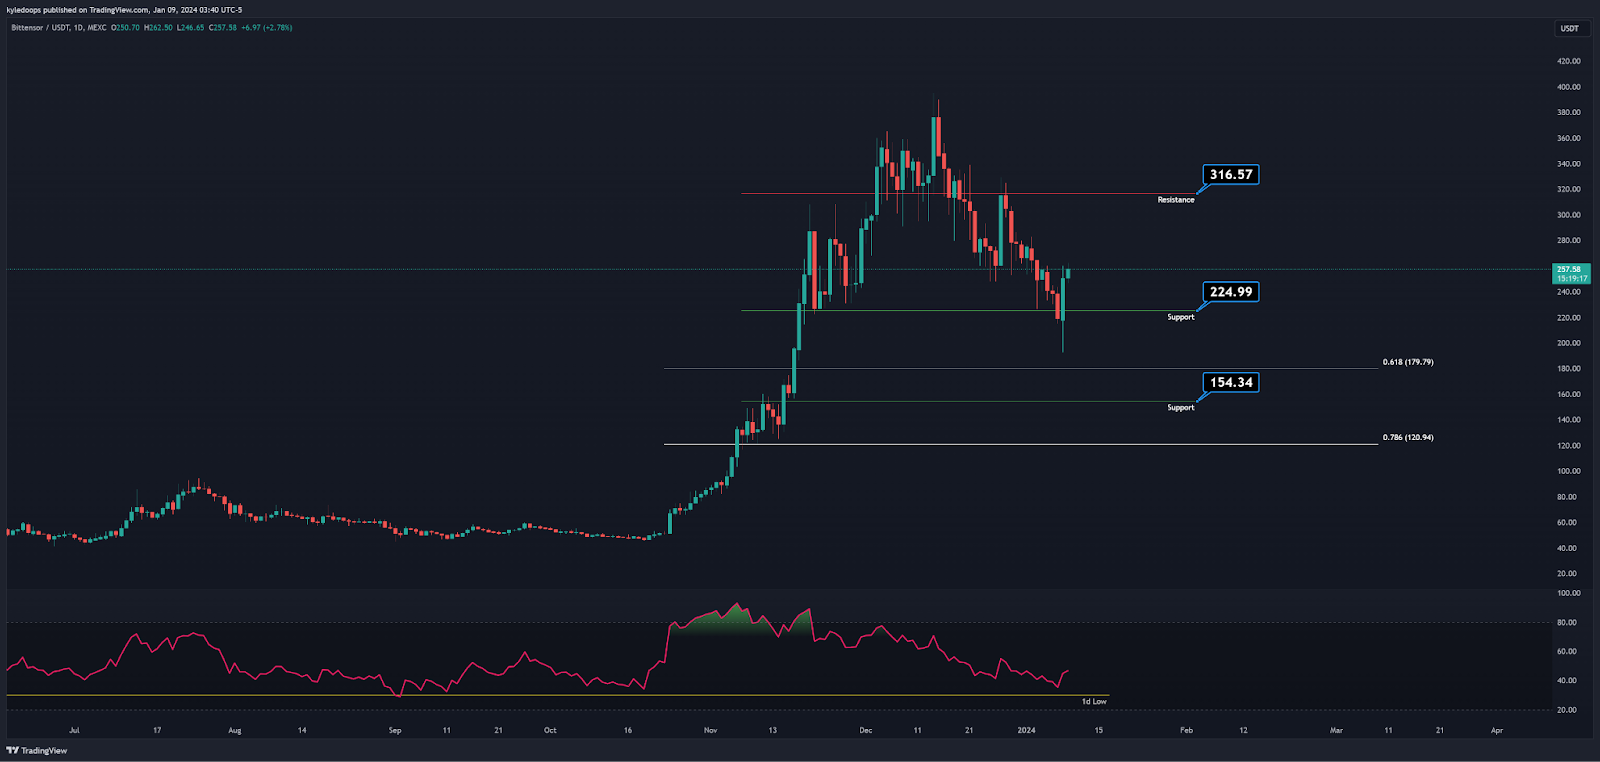
Chart #2 - Bittensor (TAOUSDT) Daily
Chartist: Kyle
(For the chart screenshot, click here.)
TAO is at $1.5B, and it's positioned in the top tier of AI-related assets.
With yesterday's Bitcoin movement, we see TAO bouncing from the support level of $225, with the next resistance identified at $316.57.
The bulls have already pushed TAO up by 20%, and the RSI has shown a reversal. The next level of support is situated at the $154 area, which falls within the middle of the golden zone.
Claim your Bitget sign-up bonuses here (details below).

Outsmart 99% Of The Market!
Get full access into our Discord And Telegram group, where you'll find all of our premium content!
👉 Trade Signals!
👉 Trade Set-Ups!
👉 Trading Challenges!
👉 Education!
👉 SO MUCH MORE!
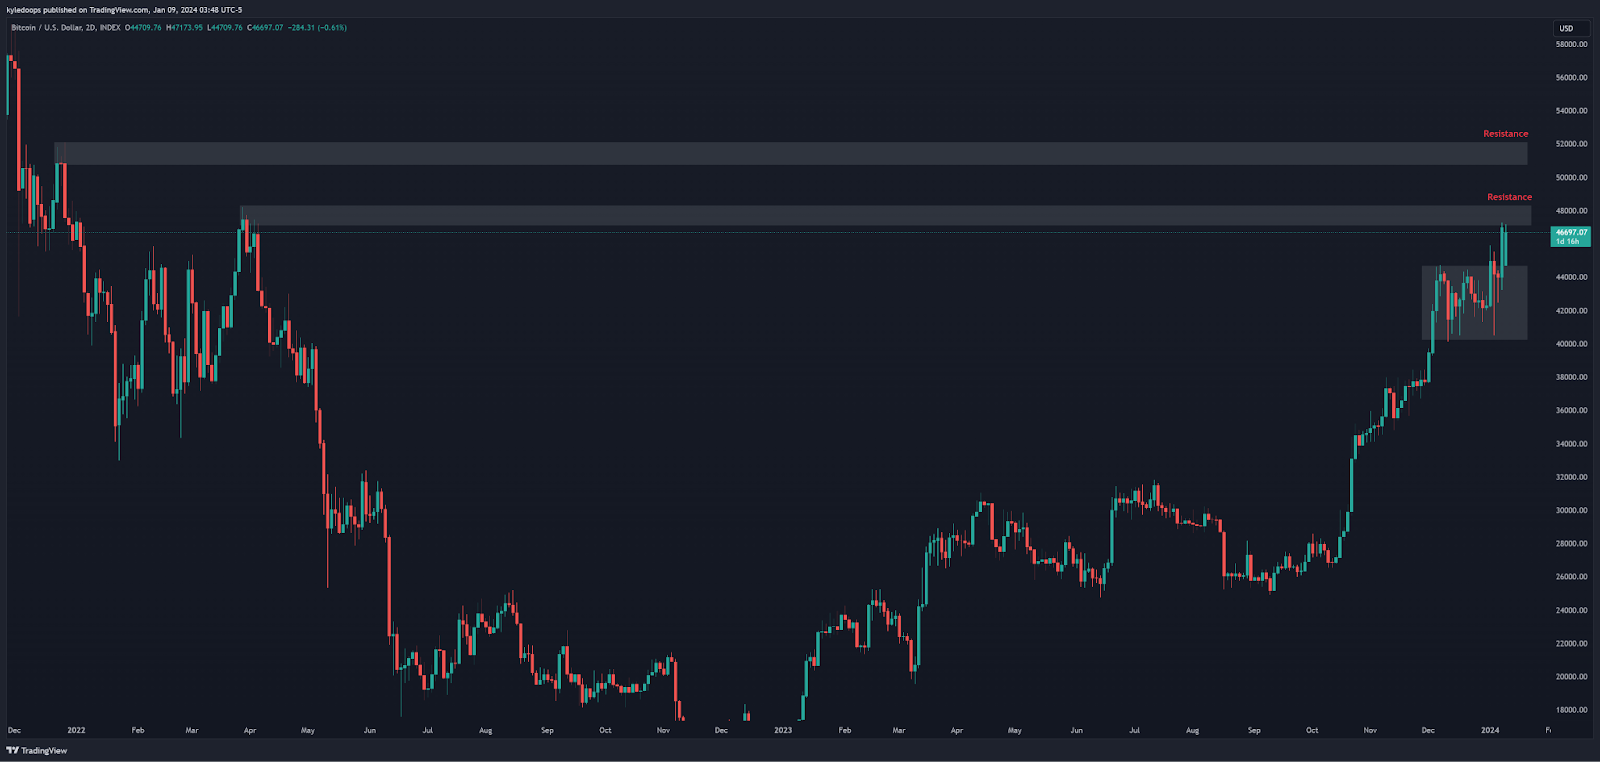
Chart #3 - Bitcoin (BTCUSD) 2-Day
Chartist: Kyle
(For the chart screenshot, click here.)
Bitcoin has finally broken through the $44,700 region, a level it has been struggling with since December 5th, and is now approaching the next resistance level of $48,000.
If the bulls continue to push the price upward, the next resistance to watch is in the $50,000 - $52,000 range.
Caution is particularly advised this week as we expect high volatility in the market due to the anticipated news regarding the Bitcoin spot ETF. This news could significantly influence market movements.
Claim your Bitget sign-up bonuses here (details below).
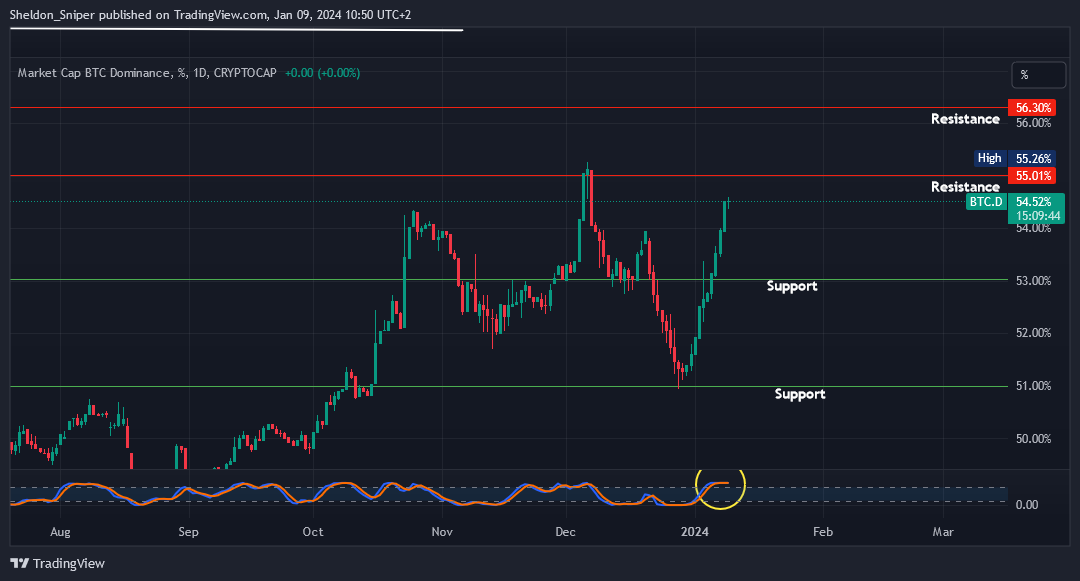
Chart #4 - Bitcoin Dominance (BTC.D) Daily
Chartist: Sheldon
(For the chart screenshot, click here.)
Bitcoin Dominance has moved considerably higher over the last two weeks, rising from support at around 51% at the end of December to its current level of 54.5%.
This has led to alts “bleeding”.
Although BTC.D is now overbought, it could still rise higher to the next resistance levels at 55% or even 56.3%. I anticipate a shift where cash will leave BTC at some stage and flow into the altcoin market. So, I will be keeping a close eye on these levels of resistance for any signs of rejection.
Claim your Bitget sign-up bonuses here (details below).
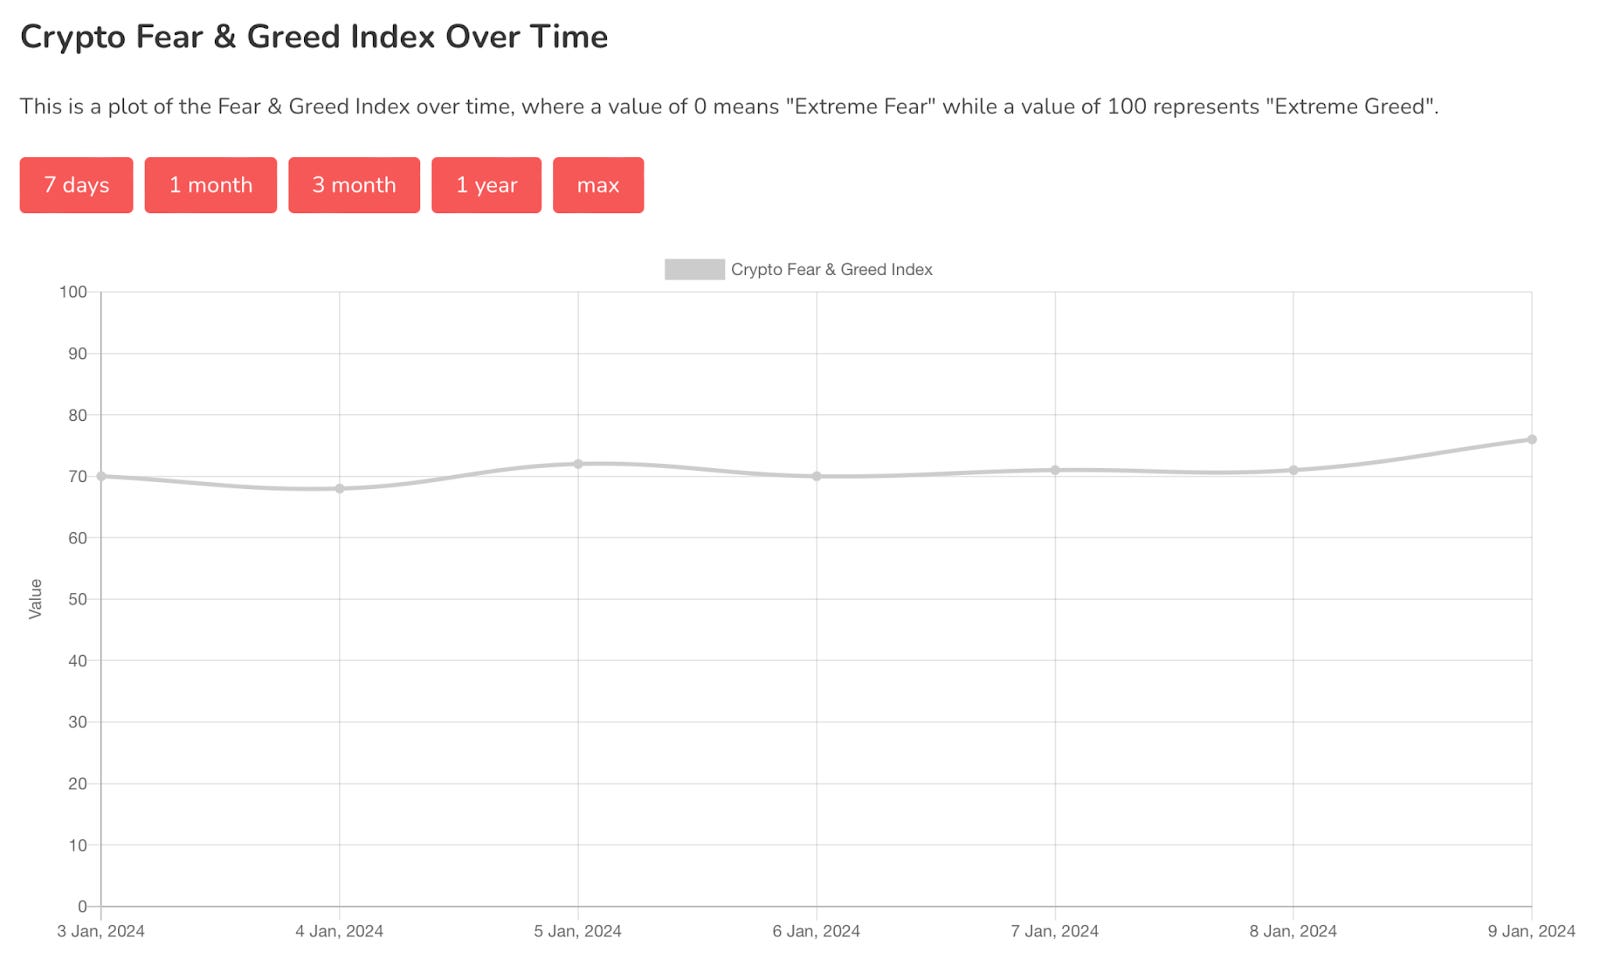
Chart #5 - Fear and Greed Index
The Fear and Greed Index is sitting at 76 today, indicating Extreme Greed.
The highest the index has been over the past seven days is 76, and the lowest is 68.
Banter’s Take
Today, there has been a very positive reaction from all the altcoins following the corrections that occurred over the past few weeks.
Remember, altcoins tend to move while Bitcoin consolidates or is in a price discovery area. Caution is advised, as high volatility is expected in the market this week.
Stay safe my friends!
Go to our Crypto Banter Discord here where Sheldon and Kyle give updates on the charts and trades from The Daily Candle newsletter!