

📈📉 Game Over for Bulls? This Shows Bears are Taking Back Full Control!
📈📉 Game Over for Bulls? This Shows Bears are Taking Back Full Control!

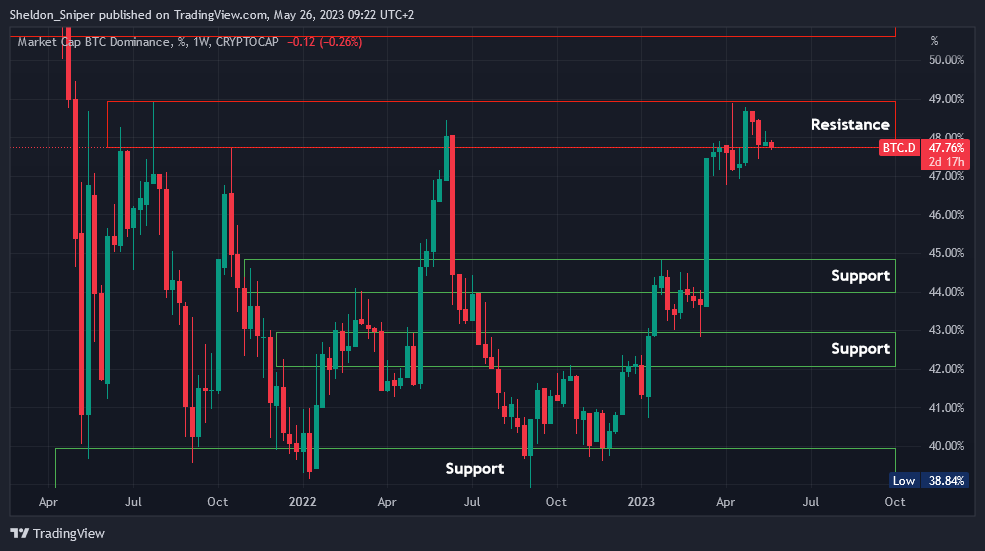
Chart #1 - Bitcoin Dominance (BTC.D) 1-Week Chart
Chartist: Sheldon
(For the chart screenshot, click here.)
In the past two years, Bitcoin Dominance (BTC.D) has fluctuated between 39% and 49%. Over the last six months, BTC.D climbed from the low end of this range (39%) to the high end (49%), outpacing the general altcoin market. Despite two recent attempts to surpass 49%, BTC.D has failed and now sits at 47.75%.
If BTC.D continues its downward trend, it may approach a major support area of 44% - 45%. This would be positive for the general alt market, indicating a potential shift of investments from Bitcoin to altcoins.
However, if BTC.D breaks through the major resistance level of 49%, it will face the next resistance beginning at 51%.
𝗣𝗿𝗶𝗺𝗲 𝗫𝗕𝗧
Sign up for a new Trading Account on Prime XBT!
Receive a deposit bonus of up to $7,000 with promo code: SheldonSniper
Chart #2 - Bitcoin (BTCUSD) 4-Hour Chart
Chartist: Kyle

(For the chart screenshot, click here.)
Bitcoin appears to be resisting the previously established range low, which is now acting as underside resistance.
The 50-day (red) and 200-day (blue) exponential moving averages (EMAs) are currently crossed in a bearish formation, indicating potential continued downward momentum. Moreover, the widening gap between those EMAs suggests that bears are taking back full control!
Also, the stochastic RSI is nearing its peak and could soon roll over, so any price bounce at the moment may merely be a short squeeze, but those shorts will just reload from higher up.
𝗣𝗿𝗶𝗺𝗲 𝗫𝗕𝗧
Sign up for a new Trading Account on Prime XBT!
Receive a deposit bonus of up to $7,000 with promo code: KyleDoops

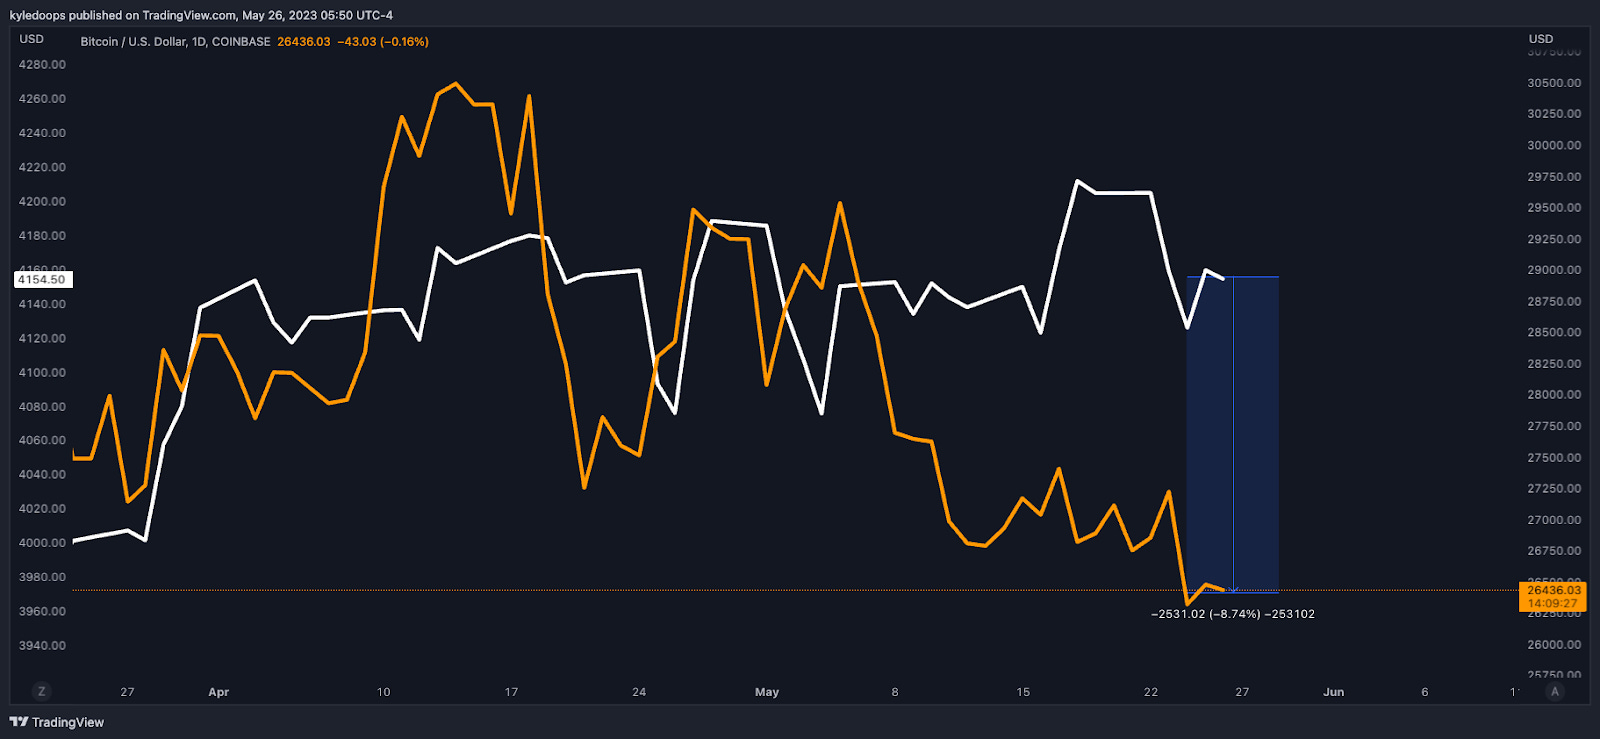
Chart #3 - Bitcoin vs ES1! (Correlation) 1-Day Chart
Chartist: Kyle
(For the chart screenshot, click here.)
The chart depicts Bitcoin (in orange) and the stock market (in white). Generally, these markets tend to move in tandem, but recently, a significant decoupling has occurred, currently reflected in an almost 9% spread.
This divergence suggests an impending convergence back to the mean or a re-correlation. There are several possibilities for how this could transpire:
Bitcoin might surge to catch up with the stock market.
The stock market could undergo a correction and decrease, reaching bitcoin.
Or, a middle ground could be reached where the stock market experiences a minor pullback while bitcoin sees a slight upward push.
It's certainly worth keeping an eye on.
Claim your Bitget sign-up bonuses here (details below).
Chart #4 - TOTAL2 1-Day Chart
Chartist: Sheldon

(For the chart screenshot, click here.)
The TOTAL2 reached a peak of $663B last month.
Since then, it has been on a downward trajectory, retracing all the way to its current level of $560B, where it now sits at a major support area. The $530B - $560B range has provided substantial support throughout most of this year. So now, with the STOCH RSI indicating the TOTAL2 is oversold on higher time frames, I'm anticipating a potential reversal of the downward trend within the next week or two.
The initial goal would be to breach the daily descending resistance line, followed by a test of the next significant resistance area situated between $600B - $625B.
Claim your Bitget sign-up bonuses here (details below).
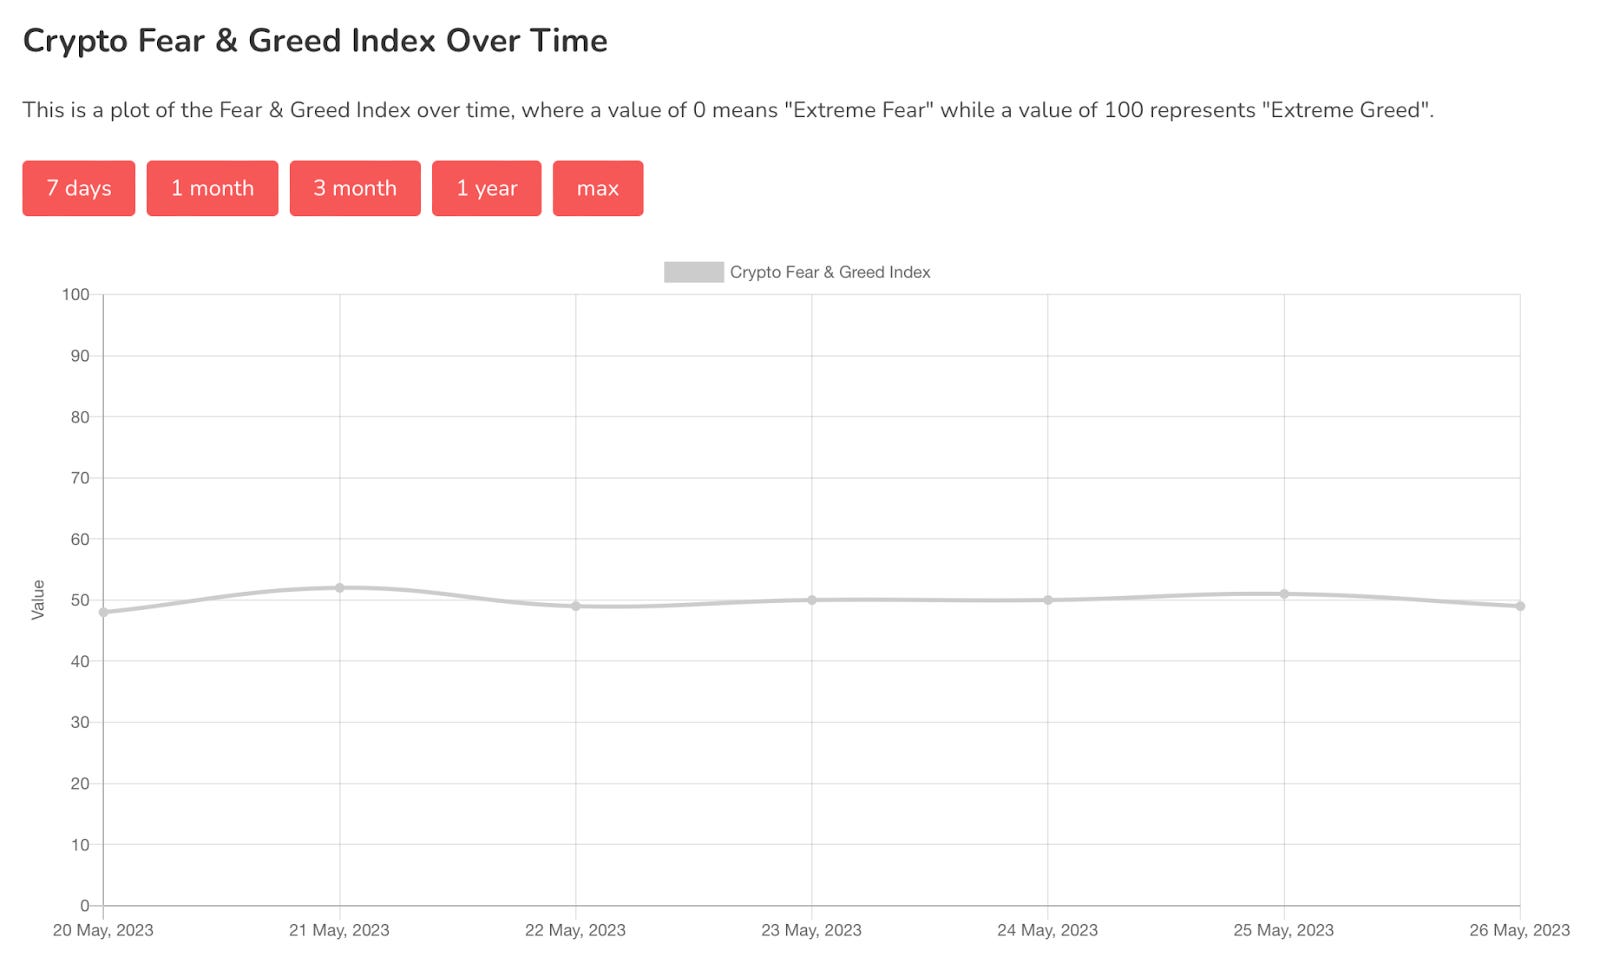
Chart #5 - Bitcoin Fear and Greed Index
The Bitcoin Fear and Greed Index is sitting at 49 today, Neutral.
The highest the index has been over the past seven days is 52, and the lowest is 48.
Banter’s Take
Risk continues to remain to the downside for the majority of cryptos, but we are getting increasingly closer to a short squeeze or mean reversion bounce.
Once a bounce occurs, we’ll watch out for shorts re-loading to send it back down.
Stay safe my friends!
Go to our Crypto Banter Discord here where Sheldon and Kyle give updates on the charts and trades from The Daily Candle newsletter!