

Here's Our LDO/USDT Setup!! + S&P500 Update
Here's Our LDO/USDT Setup!! + S&P500 Update

Overview
Chart #1 - Ethereum (ETH/USDT) Daily Chart
Chart #2 - Lido (LDO/USDT) Hourly Chart
Chart #3 - Bitcoin (BTC/USD) Hourly Chart
Chart #4 - S&P500 (SPX) Daily Chart
Chart #5 - Fear and Greed Index

Chart #1 - Ethereum (ETH/USDT) Daily Chart
Chartist: Sheldon
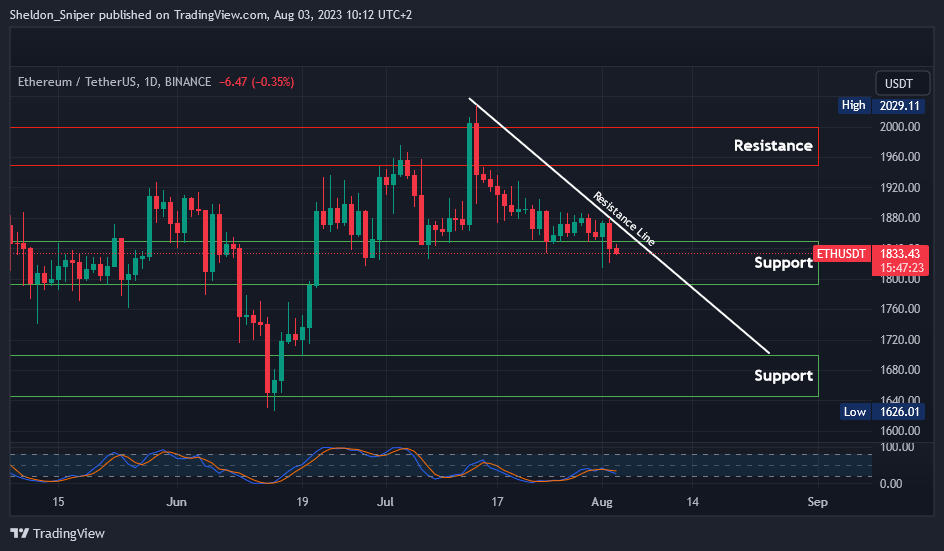
Yesterday, Ethereum lost the important $1850 level of support, and after retesting the level earlier today, price has now resumed its trend to the downside.
Price is currently trading at $1830, and the next important level of support is at $1800, and if that is lost, the next major area of support is at $1650 - $1700.
Traders need to be careful of entering trades too early. Once price has reached areas of support, price could easily break through, resuming its trend to the next support.
A suggestion would be to enter once price has broken and positively retested the 8HR Descending resistance line, which should now act as support. We also need to keep a close eye on the US Stock Markets, continual weakness could also be negative for the overall Crypto Market.
Sign-up and trade on Bybit today.
Exclusive $30,000 deposit rewards and bonuses up for grabs!
Chart #2 - Lido (LDO/USDT) Hourly Chart
Chartist: Kyle
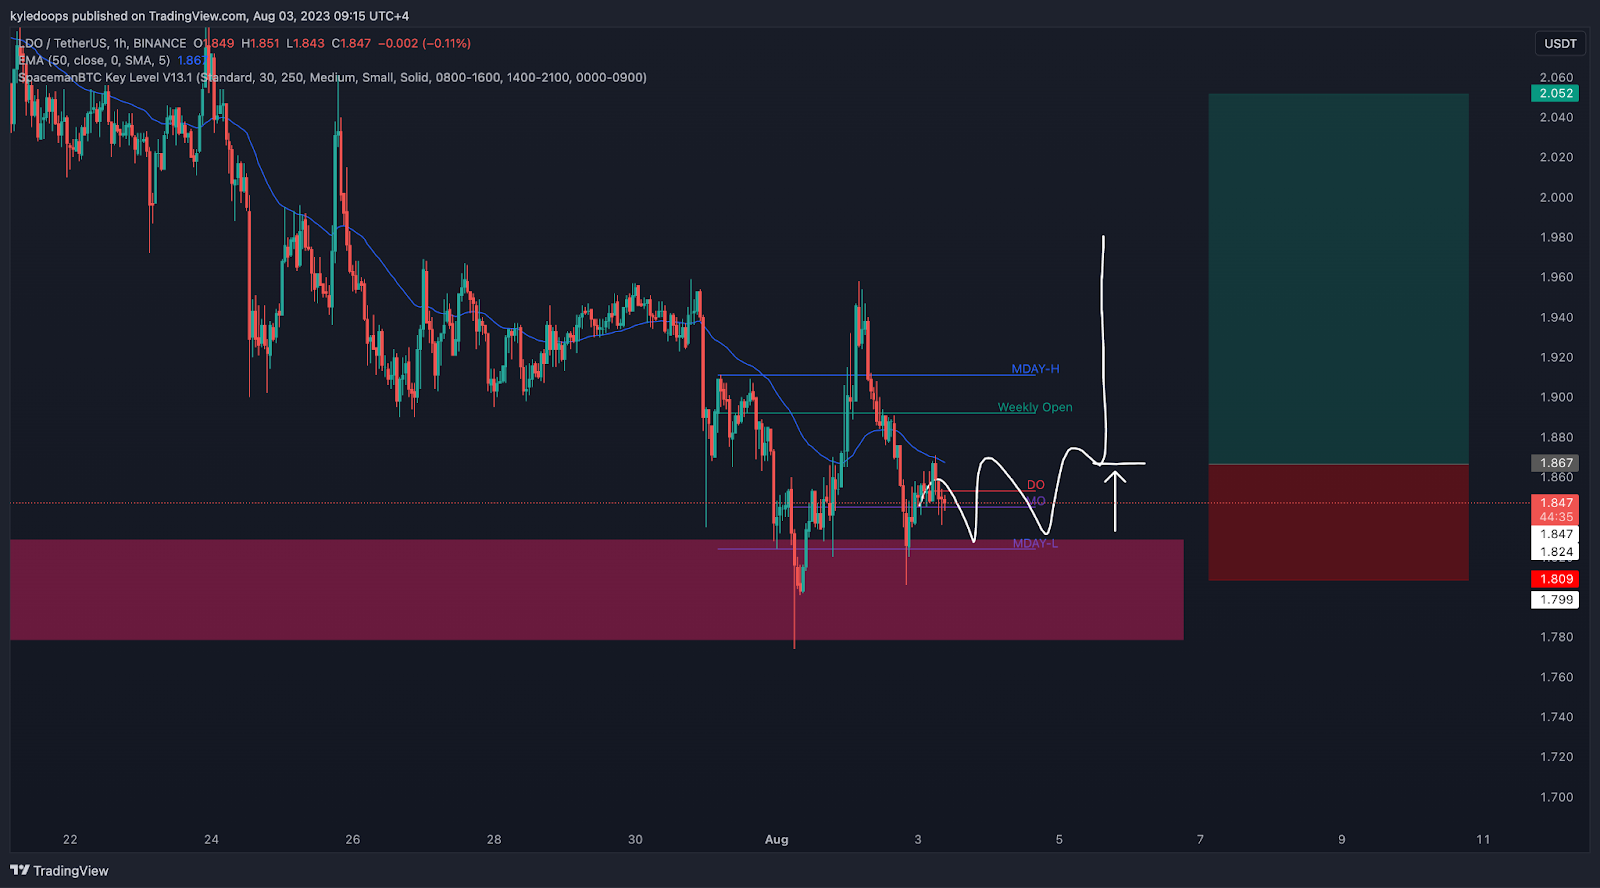
If Bitcoin reclaims $29,300 then LDO will likely get a decent sized move.
Wait for the long trigger.
The long trigger would be if you saw price continue to consolidate, reclaim the 50 ema on the 1-hour timeframe and hold that level.
That would open up the long with Stoploss at $1.809, and Take Profit at $2.052
𝗣𝗿𝗶𝗺𝗲 𝗫𝗕𝗧
Sign up for a new Trading Account on Prime XBT!
Receive a deposit bonus of up to $7,000 with promo code: KyleDoops

Sign up for a new Trading Account on Prime XBT!
Receive a deposit bonus of up to $7,000 with promo code: SheldonSniper
Chart #3 - Bitcoin (BTC/USD) Hourly Chart
Chartist: Kyle
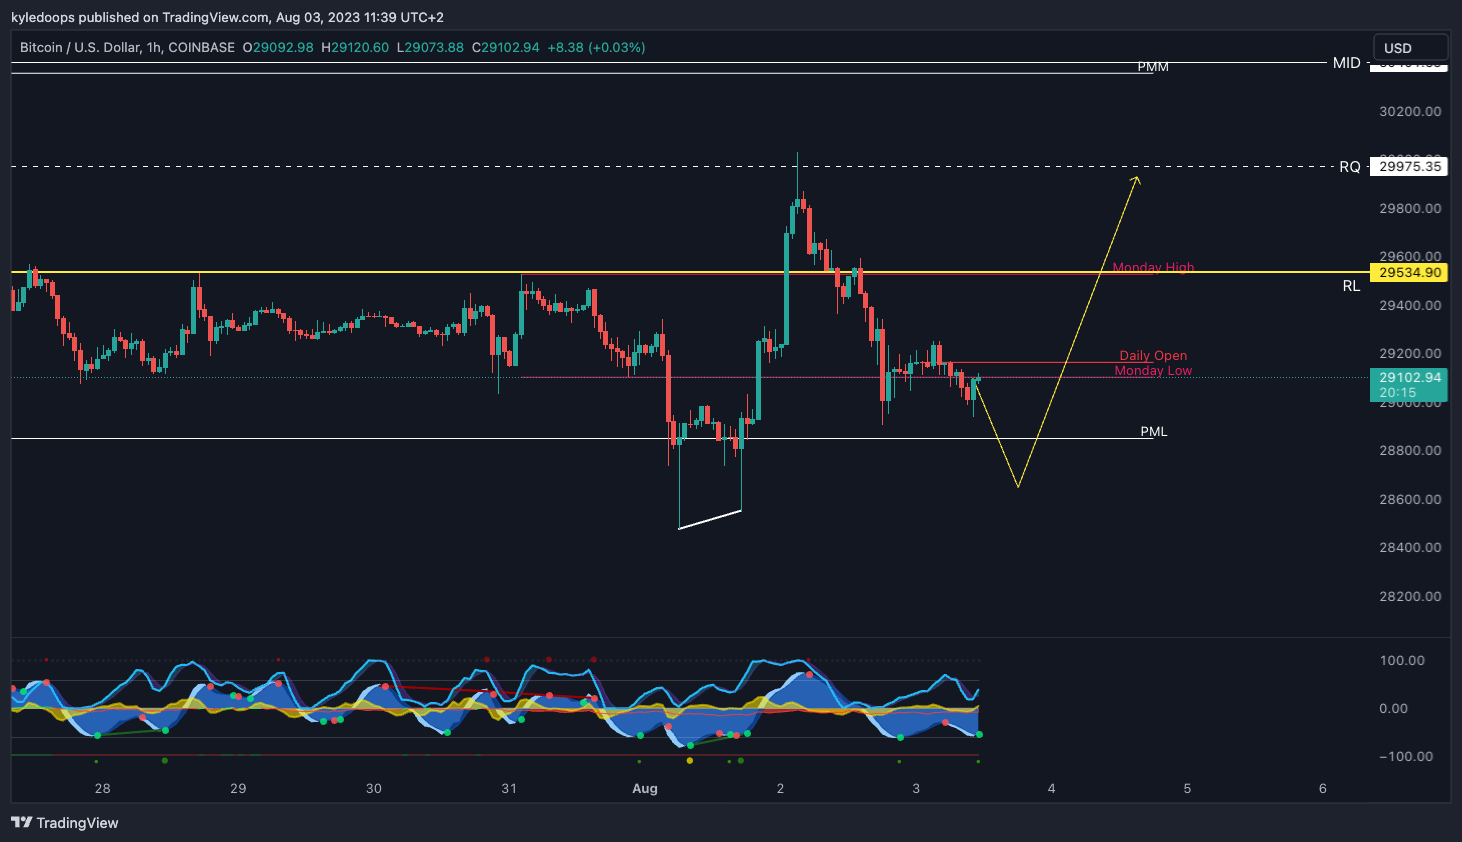
Bitcoin retraced the entirety of the prior long trade we gave, but full profits were taken.
There is a possibility that price sweeps the previous month's low one more time, targeting the equal lows at $28,400. If this happens, it could open up the opportunity for a long trade back up to just below $30,000 level.
Trading it liquidity to liquidity.
Claim your Bitget sign-up bonuses here (details below).
Chart #4 - S&P500 (SPX) Daily Chart
Chartist: Sheldon
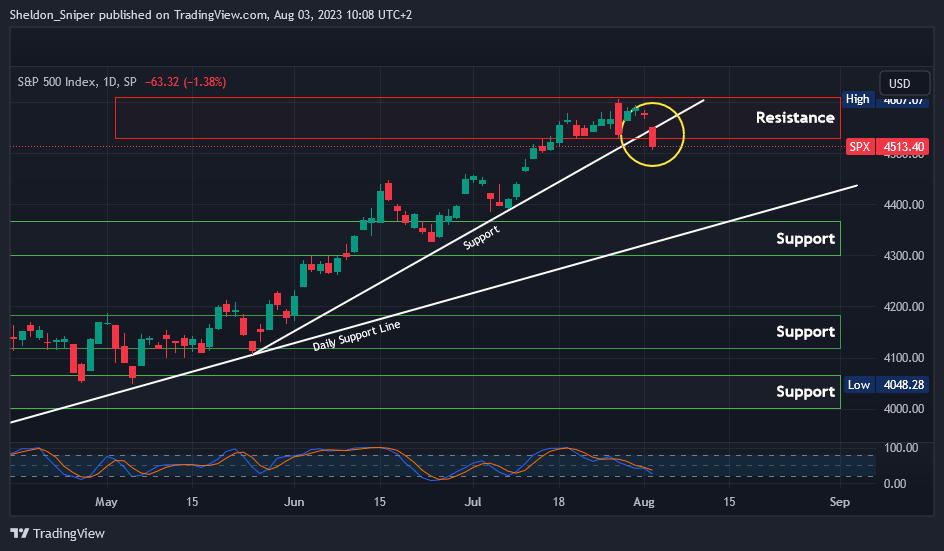
Over the past week, the SPX has been trading in the 4550 – 4600 area of resistance, and after Fitch downgraded the US debt earlier in the week, we are now starting to see some weakness in the US Stock Markets.
Yesterday the SPX dropped by 1.40%, where it looks like there is now a possibility of a rejection at the current area of resistance, and with the SPX currently at 4513, it has now broken both the support trend line coming from the end of May, and the important 4550 level.
Today’s futures are also down, and if there is further downside in the US Stock Market, it could possibly drop to the next major area of support (around 4300 – 4380), where the Daily Ascending Support line coming from March is also present.
That’s a 3% drop from where the SPX is currently at. Traders need to keep an eye on the US Stock Markets, as further downside could possibly bring the Crypto Market down with it.
Claim your Bitget sign-up bonuses here (details below).
Chart #5 - Fear and Greed Index
The Fear and Greed Index is sitting at 52 today, Neutral.
The highest the index has been over the past seven days is 53, and the lowest is 50.

Banter’s Take
The market is still consolidating within a corrective move. Buy levels which participants have marked out are $28,200, down to $27,300.
Stay safe and see you all tomorrow.