

📈📉 How to Trade SOL Like its $80 ETH!
📈📉 How to Trade SOL Like its $80 ETH!

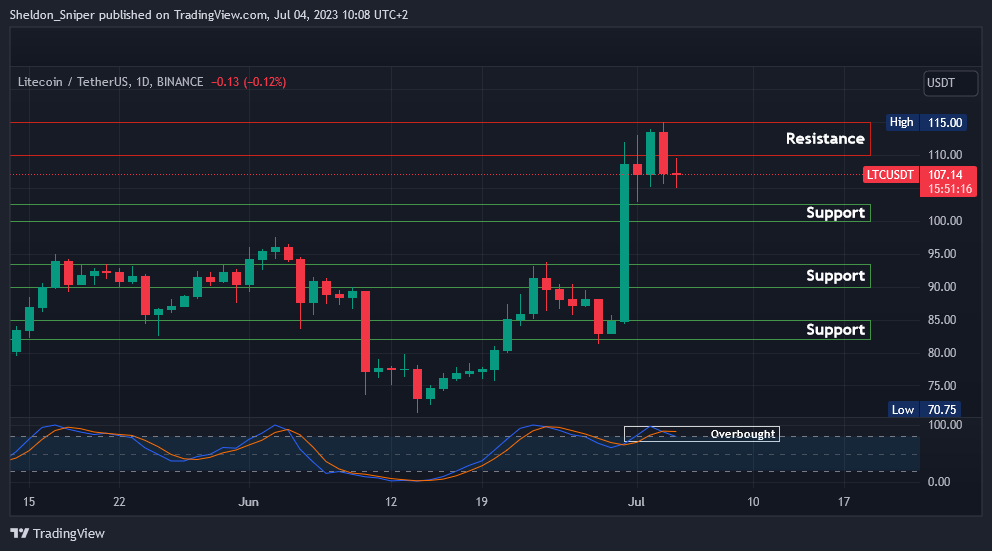
Chart #1 - Litecoin (LTCUSDT) 1-Day Chart
Chartist: Sheldon
(For the chart screenshot, click here.)
After last week's substantial rally for LTC, it was rejected at $115 yesterday morning, only to reverse in the late afternoon, settling at around $105.
The price has now bounced back slightly, with current trading levels around $107. However, given the overbought status on the higher time frames, I anticipate further retracement, possibly to test the next support at around $100 - $102.
A test of these lower support levels could position the price for a run towards higher resistance levels.
Sign-up and trade on Bybit today.
Exclusive $30,000 deposit rewards and bonuses up for grabs!
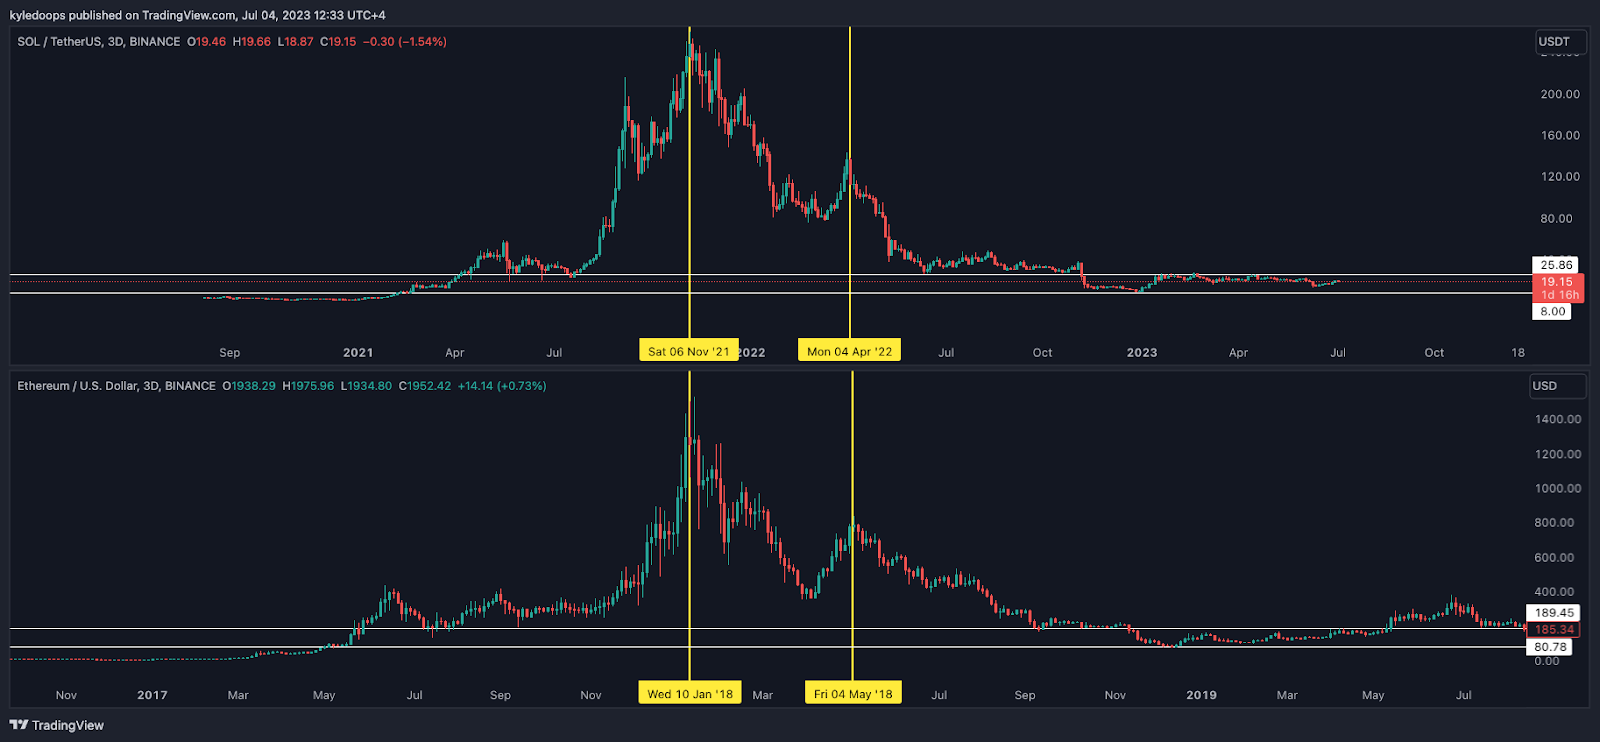
Chart #2 - Solana (SOLUSDT) 3-Day Chart
Chartist: Kyle
(For the chart screenshot, click here.)
This chart shows SOL in the top graph and ETH in the bottom graph. Many have suggested that buying SOL now is like buying ETH when its price was just $80.
The bottom chart shows ETH’s previous cycle, when it experienced a dramatic peak and subsequently plummeted to the $80 range. And the top graph presents the current price action of SOL.
As we can see, the fractal reveals a significant level of resemblance.
If this pattern were to re-occur, a safer entry point into SOL would be once it starts outperforming both BTC and ETH. This would require SOL to exceed the $25.86 range, much like how ETH surpassed the $189 level.
𝗣𝗿𝗶𝗺𝗲 𝗫𝗕𝗧
Sign up for a new Trading Account on Prime XBT!
Receive a deposit bonus of up to $7,000 with promo code: KyleDoops

Sign up for a new Trading Account on Prime XBT!
Receive a deposit bonus of up to $7,000 with promo code: SheldonSniper
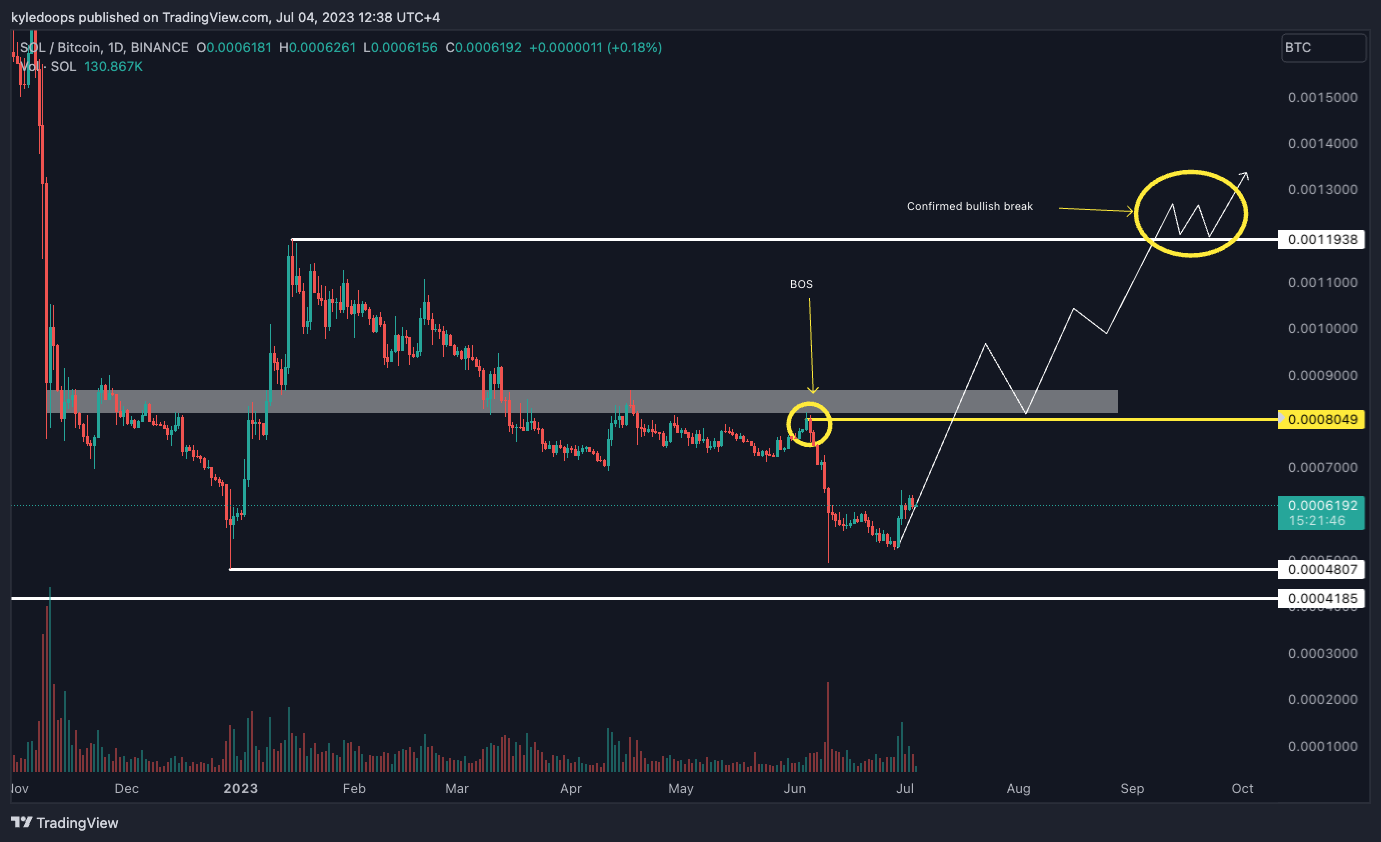
Chart #3 - Solana/Bitcoin (SOLBTC) 1-Day Chart
Chartist: Kyle
(For the chart screenshot, click here.)
The SOL to BTC ratio will confirm when it's safer to enter our long position.
The confirmation will come once SOL surpasses the structure by reaching above 0.0008049, which is considered the mid-range. When that happens, it's time to be vigilant and aim to capitalize on the higher lows.
Significant upside potential begins when it breaks out of the wider range, which will occur when the price exceeds 0.0011938.
Claim your Bitget sign-up bonuses here (details below).
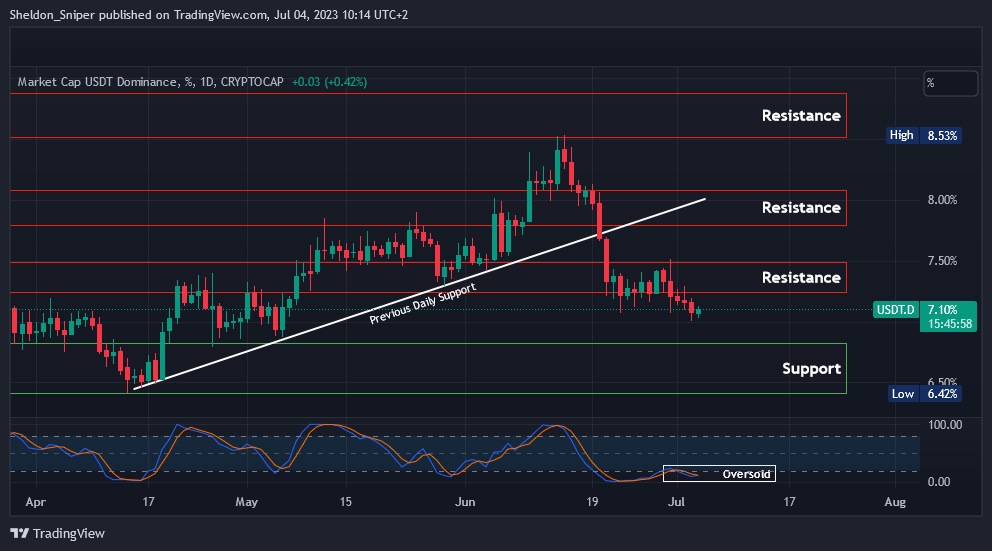
Chart #4 - USDT Dominance (USDT.D) 1-Day Chart
Chartist: Sheldon
(For the chart screenshot, click here.)
Over the past two weeks, USDT dominance has declined from 8.5% to 7.1%.
At present, USDT.D appears oversold on higher time frames, while the general market looks overbought, suggesting a potential upcoming reversal.
If USDT.D reverses its trend from this point and begins to climb, its next resistance area is around 7.25% - 7.5%.
Claim your Bitget sign-up bonuses here (details below).
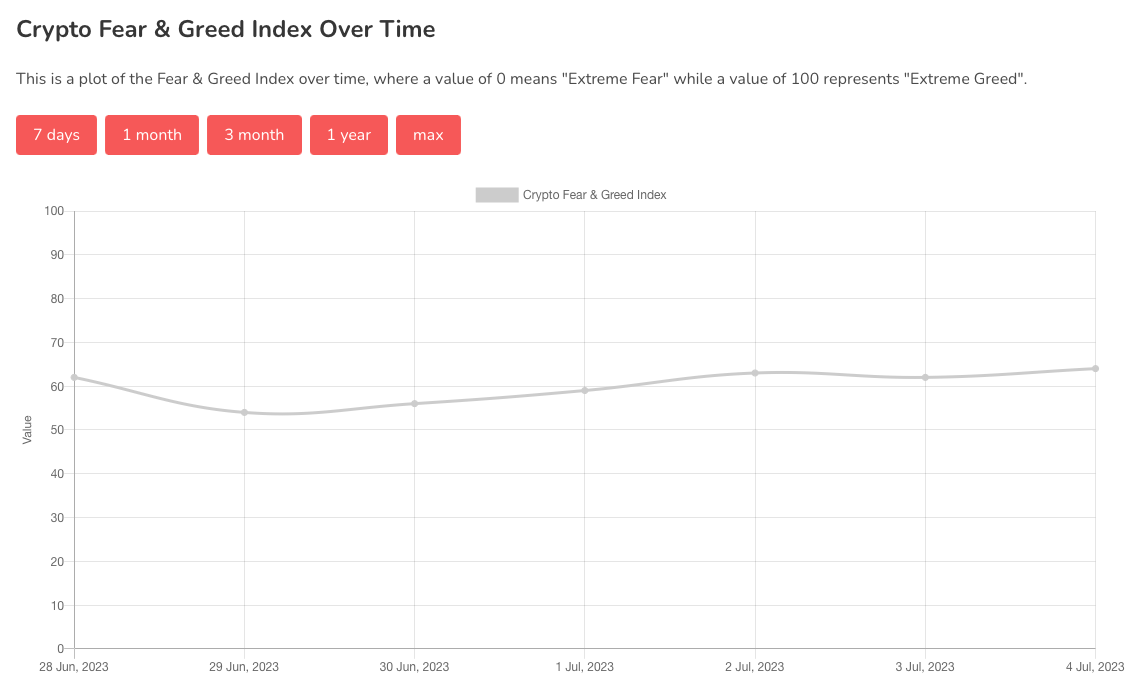
Chart #5 - Bitcoin Fear and Greed Index
The Bitcoin Fear and Greed Index is sitting at 64 today, indicating Greed.
The highest the index has been over the past seven days is 64, and the lowest is 54.
Banter’s Take
The market continues to consolidate at new local highs. As long as this trend persists, it's bullish, and we should expect the probability to be skewed towards continuation.
Stay safe my friends!
Go to our Crypto Banter Discord here where Sheldon and Kyle give updates on the charts and trades from The Daily Candle newsletter!