

📈📉 How will bitcoin react to inflation today? We are trading STEPN and ALGO!
📈📉 How will bitcoin react to inflation today? We are trading STEPN and ALGO!

Bitget winner - 9160733292
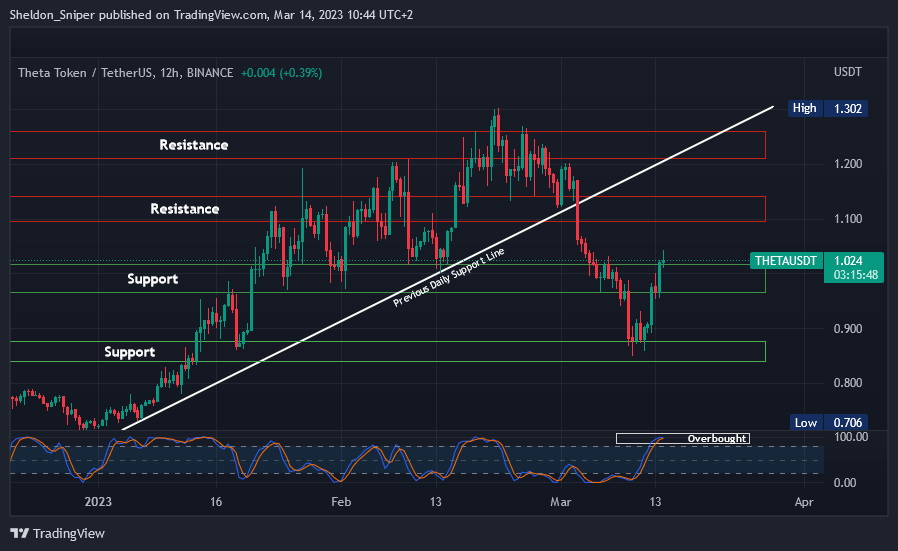
Chart #1 - Theta Network (THETAUSDT) 12-Hour Chart
Chartist: Sheldon
(For the chart screenshot, click here.)
THETA started the weekend at $0.85 (support) and rallied with the rest of the crypto market, reaching over $1.00.
Now, since it is overbought on medium time frames, it might consolidate around the $1 support zone for a while, before attempting to breach resistance levels at $1.10 and $1.20 - the previous ascending daily support line coincides with the latter.
If THETA loses the $1 level, it will most likely head back to $0.85.
𝗣𝗿𝗶𝗺𝗲 𝗫𝗕𝗧
Sign up for a new Trading Account on Prime XBT!
Receive a deposit bonus of up to $7,000 with promo code: SheldonSniper
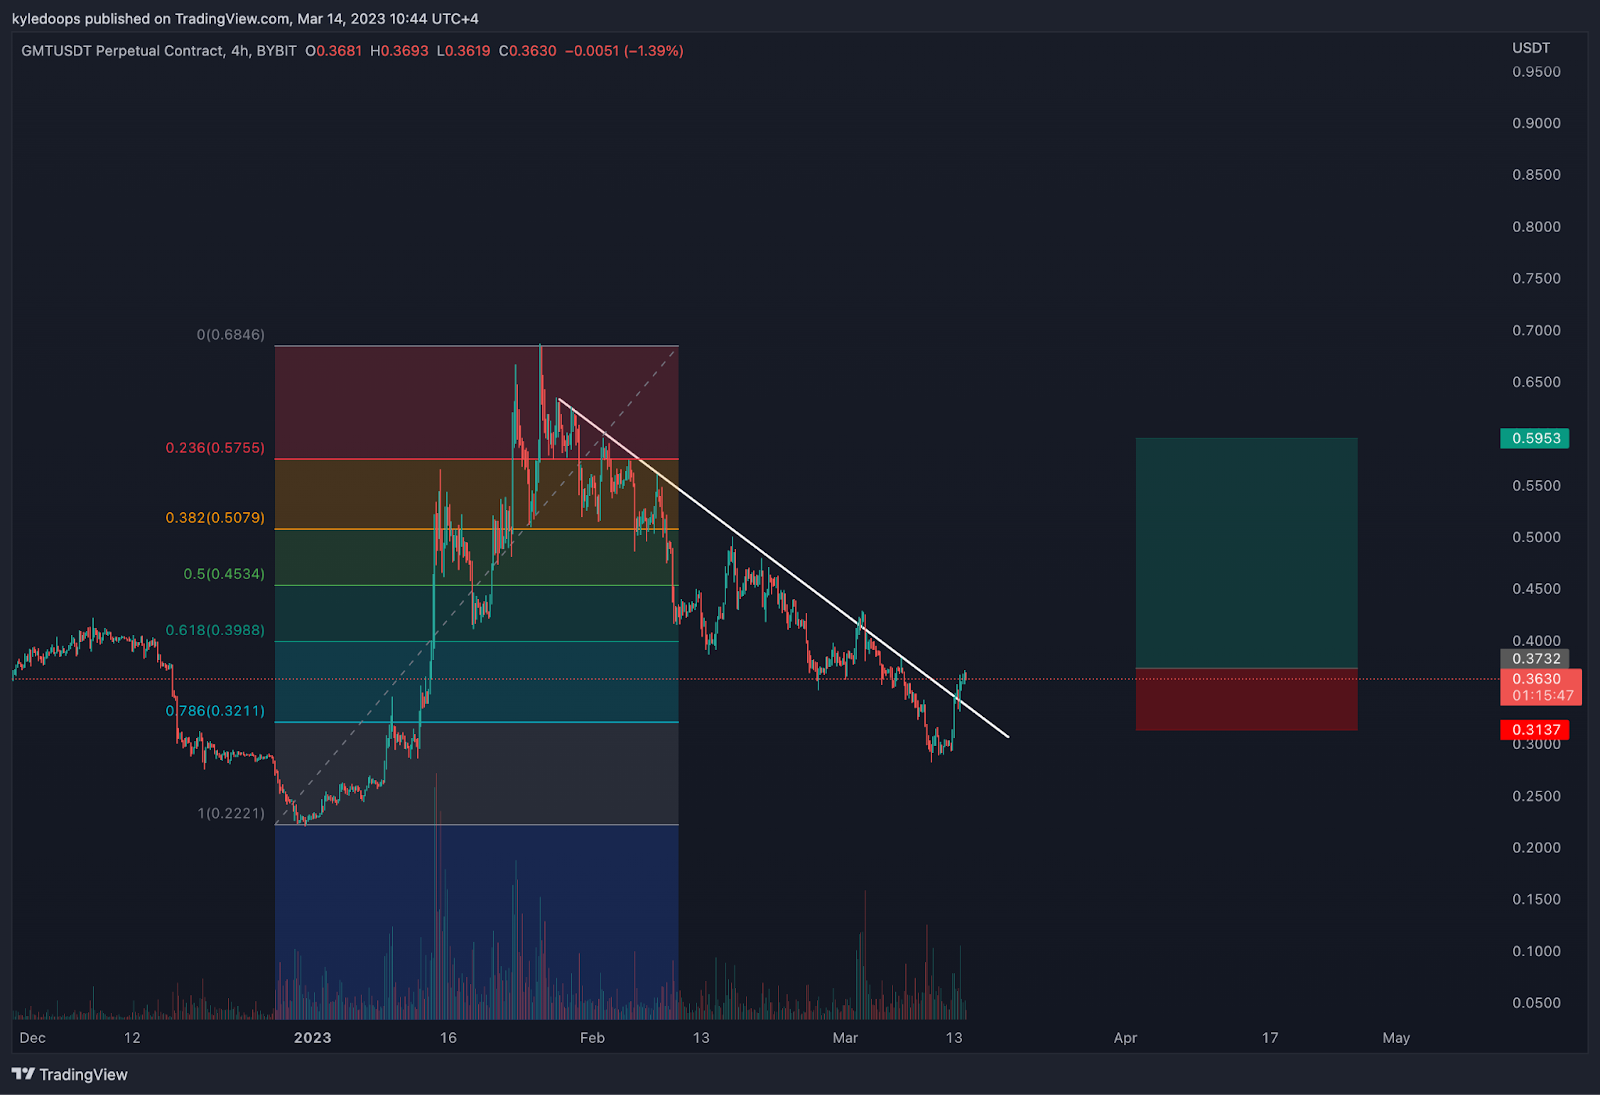
Chart #2 - STEPN (GMTUSDT) 4-Hour Chart
Chartist: Kyle
(For the chart screenshot, click here.)
This is a risky trade but nevertheless, as long as bitcoin holds up, it's still an opportunity.
GMT has stopped and reversed at the 0.767 Fib level and, additionally, it has broken through its diagonal trend line.
So, I'll place my stop loss below the prior swing low and set my take profits level at $0.59.
𝗣𝗿𝗶𝗺𝗲 𝗫𝗕𝗧
Sign up for a new Trading Account on Prime XBT!
Receive a deposit bonus of up to $7,000 with promo code: KyleDoops

Chart #3 - Algorand (ALGOUSDT) 1-Day Chart
Chartist: Kyle

(For the chart screenshot, click here.)
ALGO has reclaimed a key level.
Now we must see if the prior swing low level, at $0.16, holds. If so, there is an opportunity for a long trade here.
I would be looking to take half my profits at $0.25 - $0.26 as that is the first level of resistance. If ALGO gets above there, I'll leave the rest till the $0.34 level - as a little bonus.
Claim your Bitget sign-up bonuses here (details below).
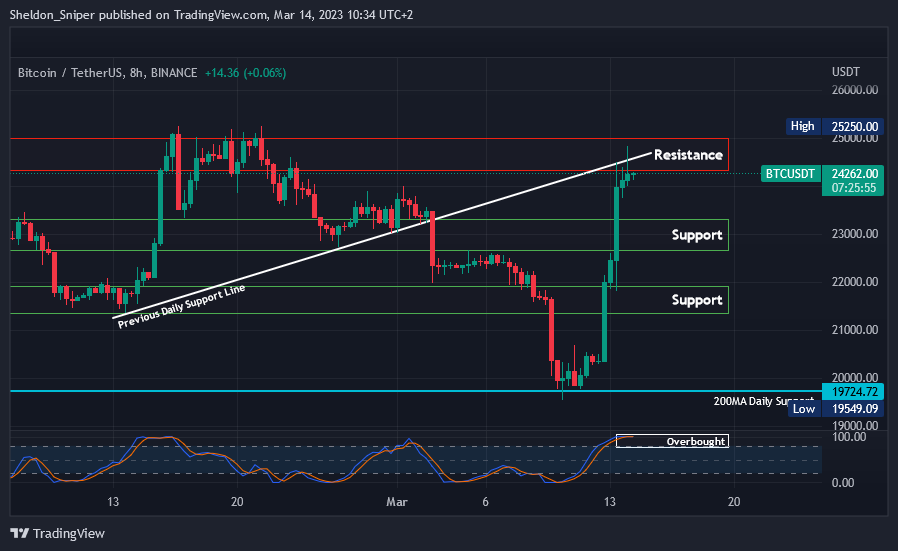
Chart #4 - Bitcoin (BTCUSDT) 8-Hour Chart
Chartist: Sheldon
(For the chart screenshot, click here.)
Bitcoin's exceptional performance yesterday means that in the last three days, its increase in price has amounted to 25%, starting the weekend below $20,000, and reaching $24,800.
Bitcoin is currently trading within the $24,300 - $25,000 resistance zone, while also testing the previous ascending daily support line, which is acting as resistance. Since bitcoin is overbought on its medium time frame charts, I expect either a small pullback here to its next support level, or a sideways consolidation before it makes another attempt to move higher.
If bitcoin can breach the current resistance, which it wasn't able to in February, it might reach the $26,500 (resistance) level. Dropping down from here would take it to $23,300.
Claim your Bitget sign-up bonuses here (details below).
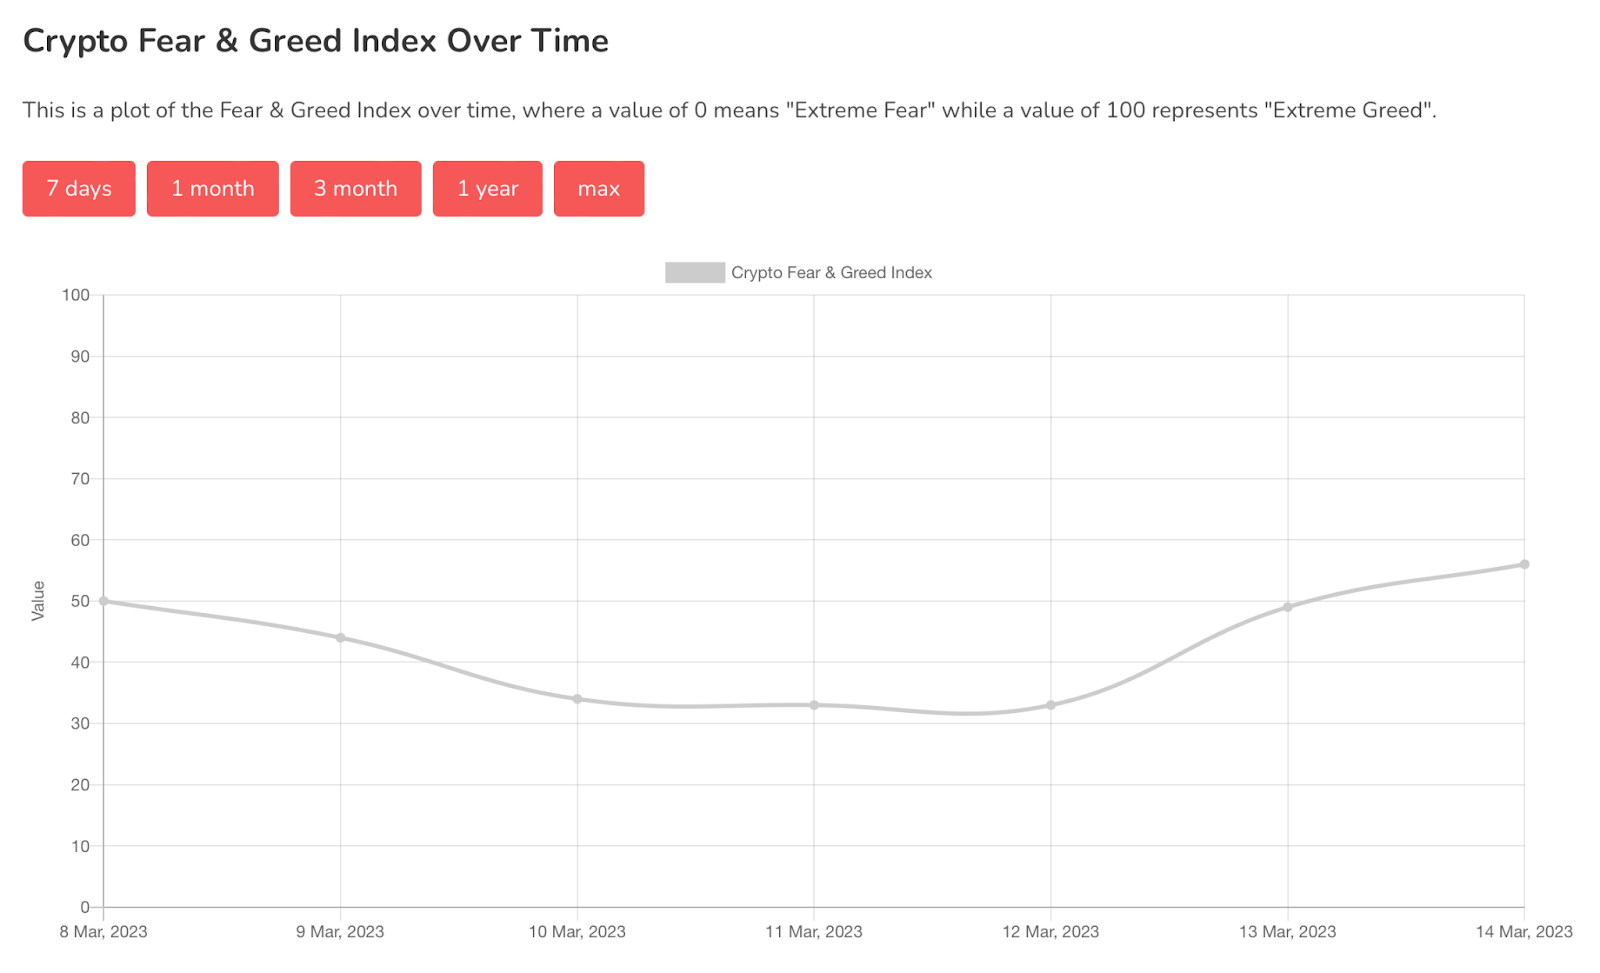
Chart #5 - Bitcoin Fear and Greed Index
The Bitcoin Fear and Greed Index is sitting at 56 today, indicating Greed.
The highest the index has been over the past seven days is 56, and the lowest is 33.
Bybit winner - 27136145
Overall Market Sentiment (Banter’s Take)
If CPI comes in at 6% or less today, the market will likely continue sideways or upwards.
Now, how bitcoin gets above its range high, at $25,500, will determine our next move. If it does it quickly, I'd consider taking profits and expect a deviation back into the range. But if it grinds up to there, bitcoin will likely maintain its bullish momentum for days to come.
Stay safe my friends!
Check out the Crypto Banter Discord here where Sheldon and Kyle give updates on the charts and trades from The Daily Candle newsletter!