

📈📉 How Will Markets React to Today’s FOMC?
📈📉 How Will Markets React to Today’s FOMC?

Overview
Chart #1 - Polkadot (DOTUSDT) Daily Chart
Chart #2 - U.S. Dollar (DXY) Weekly Chart
Chart #3 - Bitcoin (BTCUSD) Daily Chart
Chart #4 - Chainlink (LINKUSDT) 8-Hour Chart
Chart #5 - Fear and Greed Index

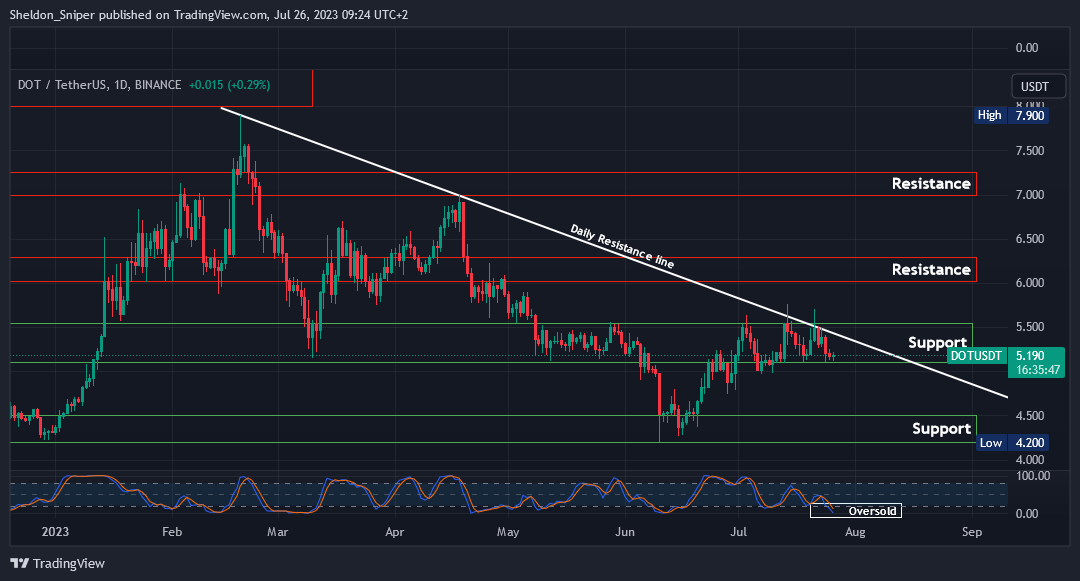
Chart #1 - Polkadot (DOTUSDT) Daily Chart
Chartist: Sheldon
(For the chart screenshot, click here.)
DOT is consolidating in the $5.15 - $5.50 area of support. With the price oversold on higher time frames, DOT could be getting ready to test the next resistance levels.
Both the $5.50 area and the daily descending resistance line, which dates back to March, have been tested on three occasions this month. If the current trend reverses back to the upside and this area can be broken, DOT could head to $6.00 - $6.30.
If the current area of support does not hold, the next target is at $4.20 - $4.50, an area last tested in June.
Sign-up and trade on Bybit today.
Exclusive $30,000 deposit rewards and bonuses up for grabs!
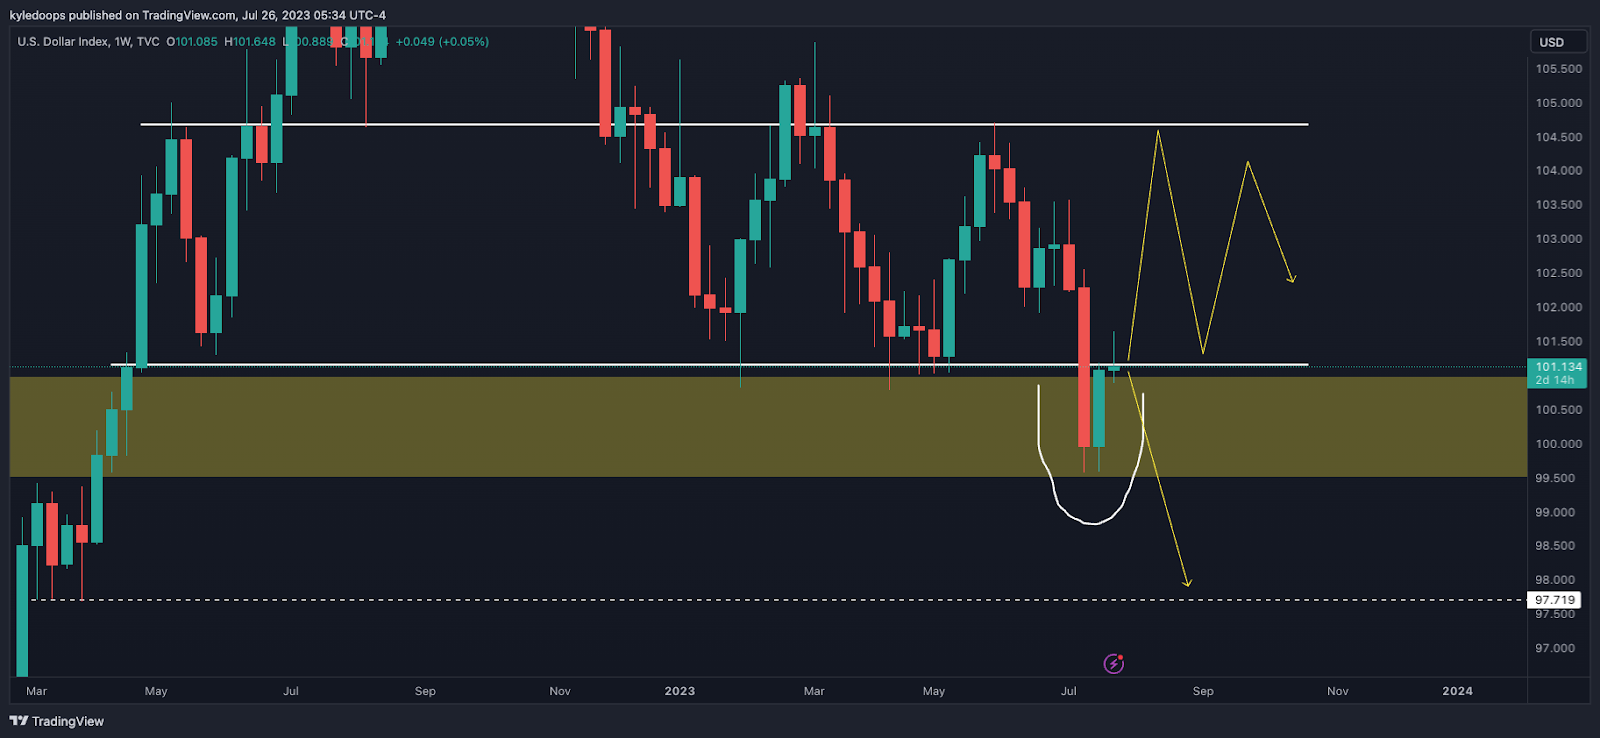
Chart #2 - U.S. Dollar (DXY) Weekly Chart
Chartist: Kyle
(For the chart screenshot, click here.)
We are paying close attention to the DXY as it's at a very key level and possibly deviating back into its range.
If it rejects from this 101.14 level this week, then that would signify a bearish retest and rejection, which likely means that crypto will rally. If it closes above that level and moves back into the range, then it's a confirmed deviation, in which case crypto will likely move sideways or downward.
Either way, there's a good chance that the market will choose its direction today based on the outcome of the FOMC meeting.
𝗣𝗿𝗶𝗺𝗲 𝗫𝗕𝗧
Sign up for a new Trading Account on Prime XBT!
Receive a deposit bonus of up to $7,000 with promo code: KyleDoops

Sign up for a new Trading Account on Prime XBT!
Receive a deposit bonus of up to $7,000 with promo code: SheldonSniper
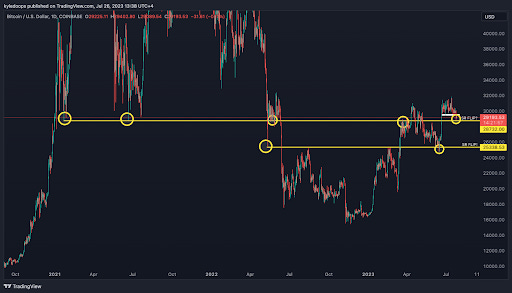
Chart #3 - Bitcoin (BTCUSD) Daily Chart
Chartist: Kyle
(For the chart screenshot, click here.)
Bitcoin may be completing an SR flip - transforming prior resistance into support.
The $28,732 level is the key level to hold.
If it flips, expect this to serve as a higher low and prompt a continuation to the upside.
Claim your Bitget sign-up bonuses here (details below).
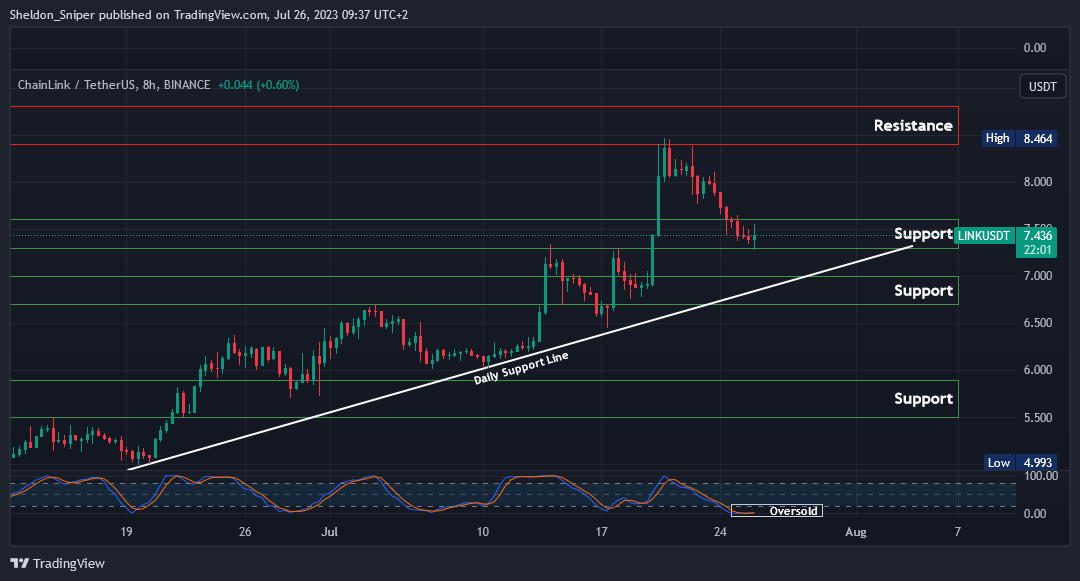
Chart #4 - Chainlink (LINKUSDT) 8-Hour Chart
Chartist: Sheldon
(For the chart screenshot, click here.)
After a massive rally for LINK earlier this month, the price is now consolidating in the $7.30 - $7.60 support area. It is also oversold on medium time frames.
If this area holds, there could be another move to the upside, to test $8.40 - $8.80. If the current level doesn’t hold, it might head to $6.70 - $7.00.
LINK has been very bullish over the last few weeks. If the outcome of today's FOMC meeting is favorable for the market, it could soar further.
Claim your Bitget sign-up bonuses here (details below).
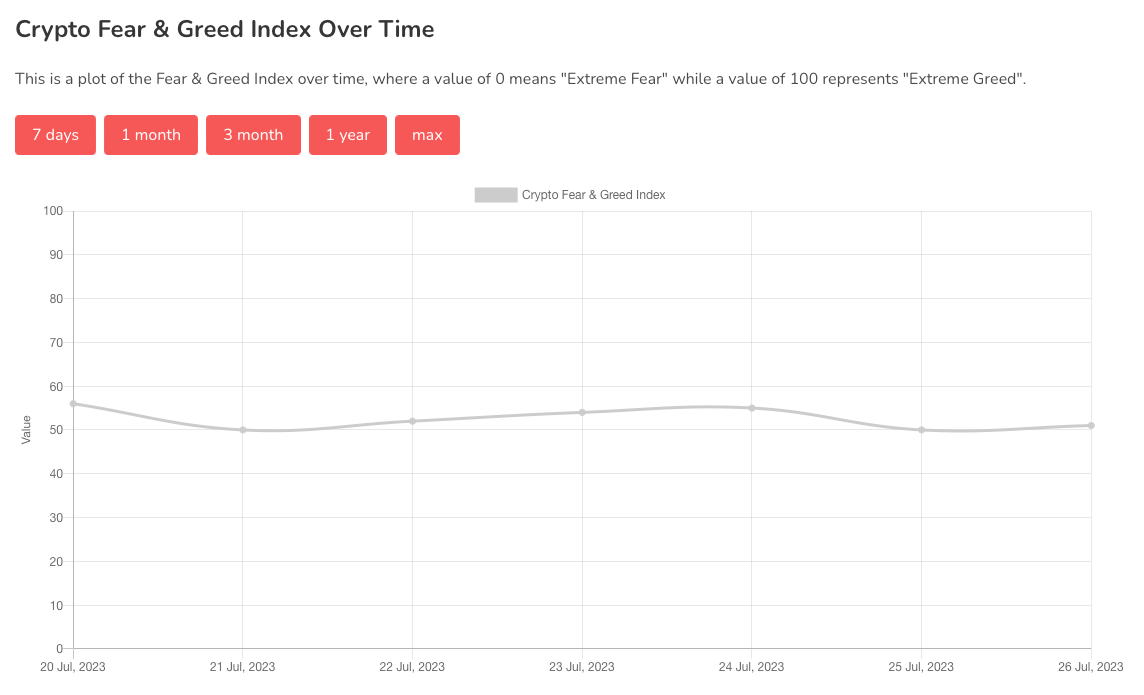
Chart #5 - Fear and Greed Index
The Fear and Greed Index is sitting at 51 today, Neutral.
The highest the index has been over the past seven days is 56, and the lowest is 50.
Banter’s Take
The FOMC meeting will dictate the direction of the next move. If it goes well, then this is likely the next higher low, and we can expect continuation. If it loses that level, then a local top may be in. We will re-evaluate tomorrow.
Stay safe my friends!
Go to our Crypto Banter Discord here where Sheldon and Kyle give updates on the charts and trades from The Daily Candle newsletter!