

📈📉 If alts lose this level, everyone will panic sell! Kyle’s ApeCoin trade revealed!
📈📉 If alts lose this level, everyone will panic sell! Kyle’s ApeCoin trade revealed!

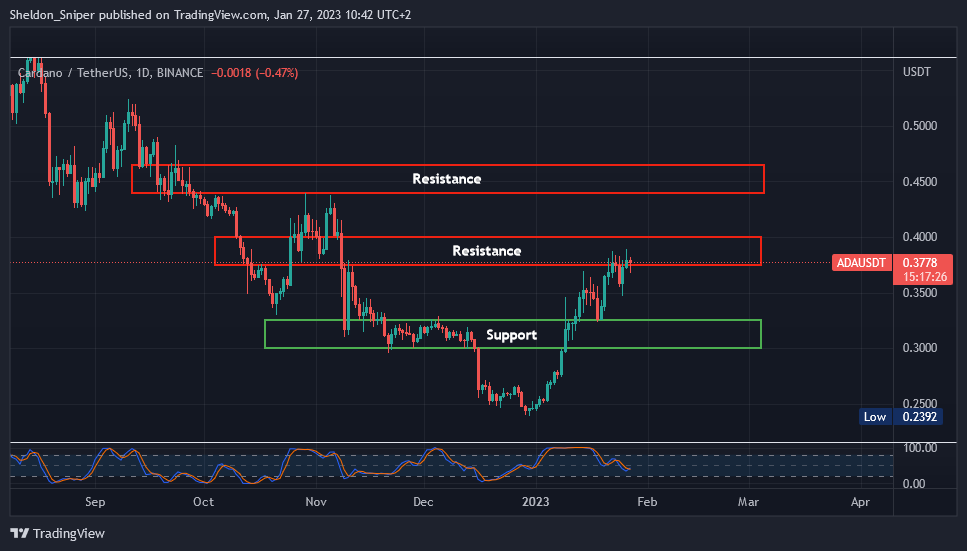
Chart #1 - Cardano (ADAUSDT) 1-Day Chart
Chartist: Sheldon
(For the chart screenshot, click here.)
ADA has increased by around 60% this year, from $0.24 to just below $0.38, and has been consolidating in the $0.3750 - $0.40 area of resistance for the last week.
Now, if the price breaks through $0.40, the next resistance is between $0.445 - $0.465 - an area that held as support from May to September last year and will hence be very tough resistance to break through.
If the price gets rejected in the current area, the next support is around $0.30 - $0.325.
ADA is a coin many investors hold in their portfolios, and if the market moves up this year, I feel it has a lot of upside potential.
Check our Crypto Banter Discord here for updates!
Follow me on Twitter for urgent updates on my trading progress!
Claim your Bitget sign-up bonuses here (details below).
Chart #2 - ApeCoin (APEUSDT) 4-Hour Chart
Chartist: Kyle

(For the chart screenshot, click here.)
APE looks like it's setting up nicely for a long trade, as a relative strength play. It's holding up decently with the pullback, and longing coins with relative strength is often a good strategy.
The $5.90 level should hold, but we want to be tight with our stop loss, so we could place it below the 4-hour candle wick-low.
These are the levels for my trade:
Entry: $6.28
Stop Loss: $5.18
Take Profits 1 (TP1): $7.50
Take Profits 2 (TP2): $10.60
Check our Crypto Banter Discord here for updates!
Make sure to follow me on Twitter, where I will post updates on my trades as they unfold!
Claim your Bitget sign-up bonuses here (details below).
Last week we introduced you to the concept of Options trading. We mentioned it can be utilized as an insurance policy to hedge risk. We will introduce four strategies over the coming weeks. Starting with call and put options.
Buying calls, also known as longing calls, are advantageous for those looking to make a directional bet in the market. If you think the price of an asset will rise, you could buy a call option, using less capital than the asset itself. If the price drops, your losses are purely limited to the price or (premium) that you paid for that call option or contract.
Options are leveraged instruments that allow you to amplify the potential upside by using a smaller amount than what would otherwise be required if you were trading the underlying asset itself.
For example, an investor might buy a call option on XYZ stock with a strike price of $50 and an expiration date of 3 months from now. If the price of XYZ stock goes up to $55 before the expiration date, the investor can exercise the option and buy the stock at the lower strike price of $50, resulting in a profit.
On the other hand, an investor might buy a put option on XYZ stock with a strike price of $50 and an expiration date of 3 months from now for a premium of $2 per share. The investor pays $200 ($2 x 100 shares) for the option. That gives them the right, but not the obligation, to sell XYZ stock at the strike price of $50 within the next 3 months. If the price of XYZ stock falls to $45 before the expiration date, the investor can exercise the option and sell their shares at the higher strike price of $50, resulting in a profit of $500 ($50 - $45 x 100 shares). The total profit would be $500 - $200 = $300.
Think of this like cashing in on an insurance claim. Your loss as a trader is limited to the price you pay for the options contract, while the upside profit is unlimited, because the options contract's payoff will increase along with the underlying asset price until expiration, and in theory, there is no limit to how high it can go.
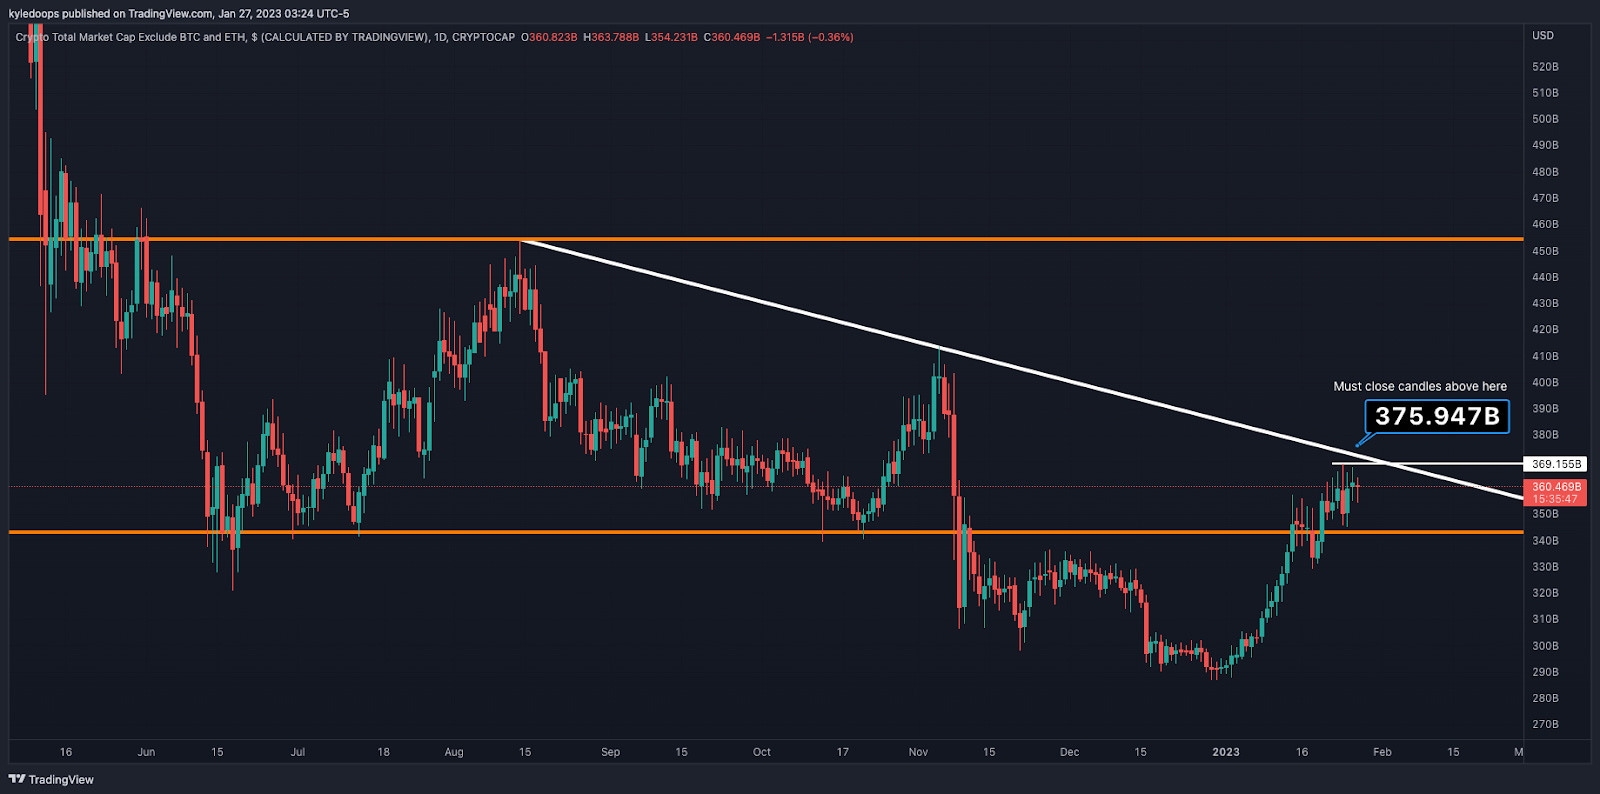
Chart #3 - TOTAL3 1-Day Chart
Chartist: Kyle
(For the chart screenshot, click here.)
The TOTAL3 has been struggling to breach its diagonal trend line - something we can see by all the wicks up to that line. But, if we see a clean break and close above that level, it will mean a trend shift and potentially even a reversal for altcoins.
If it rejects from the $370 billion level, those longing altcoins will likely panic sell, which could create high panic in the market.
On the other hand, the more time spent around this upper trend line, the more likely the TOTAL3 is to pop through it.
Check our Crypto Banter Discord here for updates!
Make sure to follow me on Twitter, where I will post updates on my trades as they unfold!
Claim your Bitget sign-up bonuses here (details below).
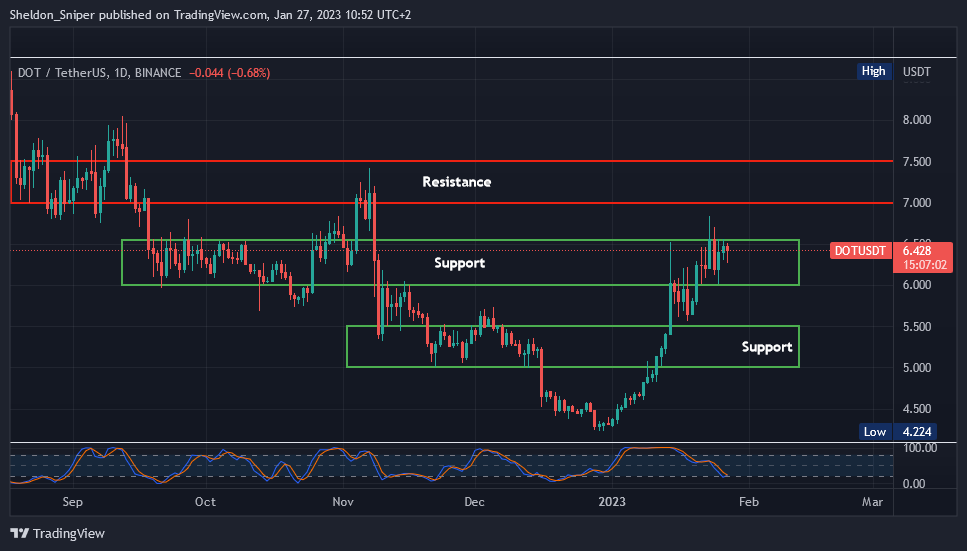
Chart #4 - Polkadot (DOTUSDT) 1-Day Chart
Chartist: Sheldon
(For the chart screenshot, click here.)
DOT has performed very well this year, increasing over 50%, from $4.22 to $6.40.
The price has been consolidating between $6.00 (support) and $6.50 (resistance) for a week. If there is a push higher, the next resistance is at $7.00 - $7.50. And if $6.00 is lost, the next support level comes in between $5.00 - $5.50.
DOT is very cheap compared to where it was 18 months ago, and that is sure to have many investors eyeing it.
Check our Crypto Banter Discord here for updates!
Follow me on Twitter to get all the updates on my personal trading progress!
Claim your Bitget sign-up bonuses here (details below).
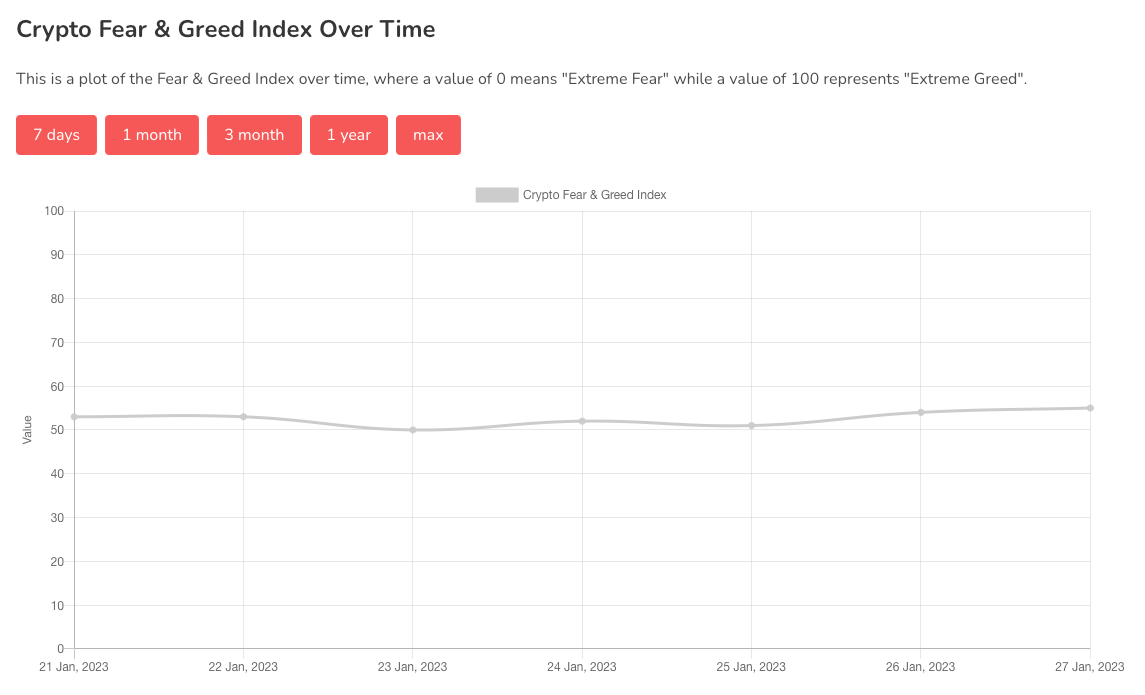
Chart #5 - Bitcoin Fear and Greed Index
The Bitcoin Fear and Greed Index is sitting at 55 today, indicating Greed.
The highest the index has been over the past seven days is 55, and the lowest is 50.
Overall Market Sentiment (Banter’s Take)
The market is currently pulling back, and as it stands, we expect bitcoin to continue ranging between $23,000 and $21,000. That range will not be resolved until the price confirms a move above or below it. As for range traders, they should have a field day.
Stay safe my friends!