

📈📉 If bitcoin holds this level, THETA could pump 60%!
📈📉 If bitcoin holds this level, THETA could pump 60%!

Bitget winner - 9368096096
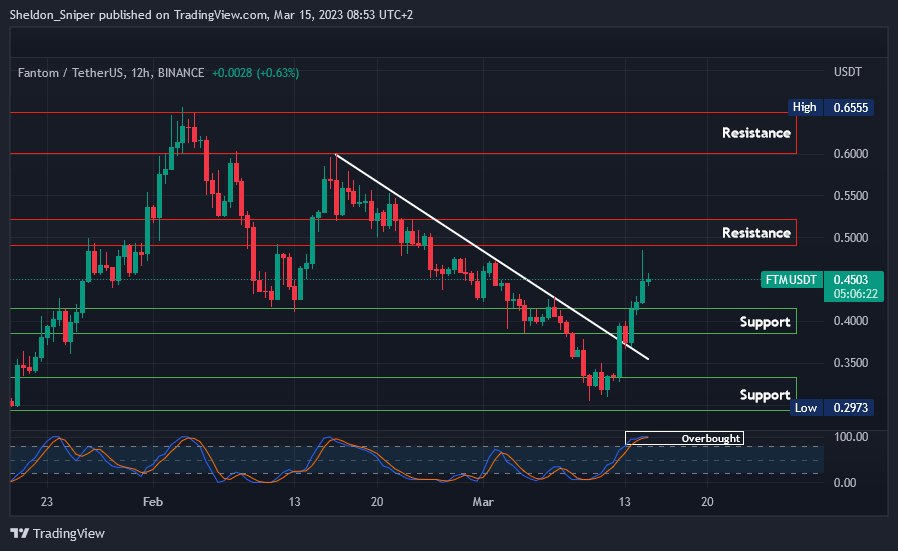
Chart #1 - Fantom (FTMUSDT) 12-Hour Chart
Chartist: Sheldon
(For the chart screenshot, click here.)
After saying goodbye to $0.30 and rallying 60% over the past five days, FTM got rejected at $0.49 (resistance). It has since retraced to its current price of $0.45.
FTM's medium time frame indicators are overbought, so it may pull back to $0.40 - $0.4250, potentially giving us a nice opportunity to enter a long trade. But if it keeps on rallying up, the next resistance level after the $0.49 - $0.52 zone comes in at $0.60.
Bitcoin has been sucking in all the cash over the past week, but if it stabilizes, I believe cash will start flowing into the alts.
𝗣𝗿𝗶𝗺𝗲 𝗫𝗕𝗧
Sign up for a new Trading Account on Prime XBT!
Receive a deposit bonus of up to $7,000 with promo code: SheldonSniper
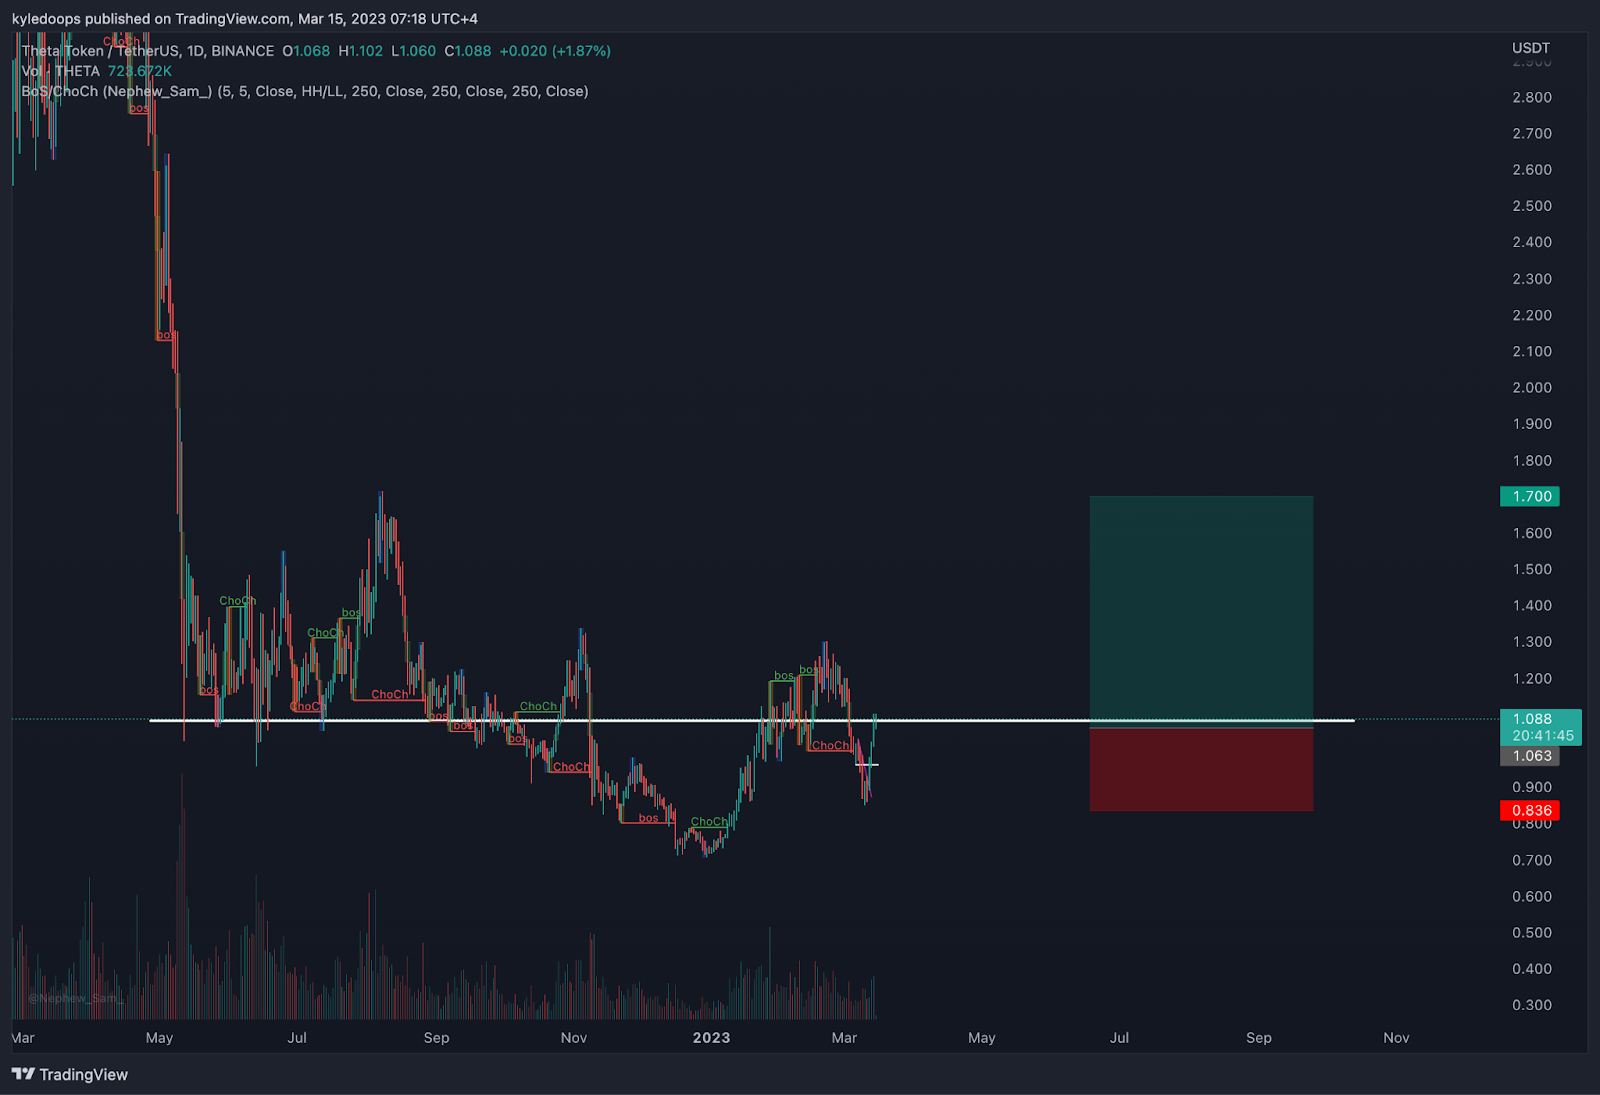
Chart #2 - Theta Network (THETAUSDT) 1-Day Chart
Chartist: Kyle
(For the chart screenshot, click here.)
THETA created a swing low below its range low but just recently reclaimed it. What that does, is present us with a swing trade opportunity.
As long as bitcoin can maintain its price above its range low horizontal level, which is where it currently is, then THETA will likely test its range high - which comes in at $1.70 - in the coming weeks.
𝗣𝗿𝗶𝗺𝗲 𝗫𝗕𝗧
Sign up for a new Trading Account on Prime XBT!
Receive a deposit bonus of up to $7,000 with promo code: KyleDoops

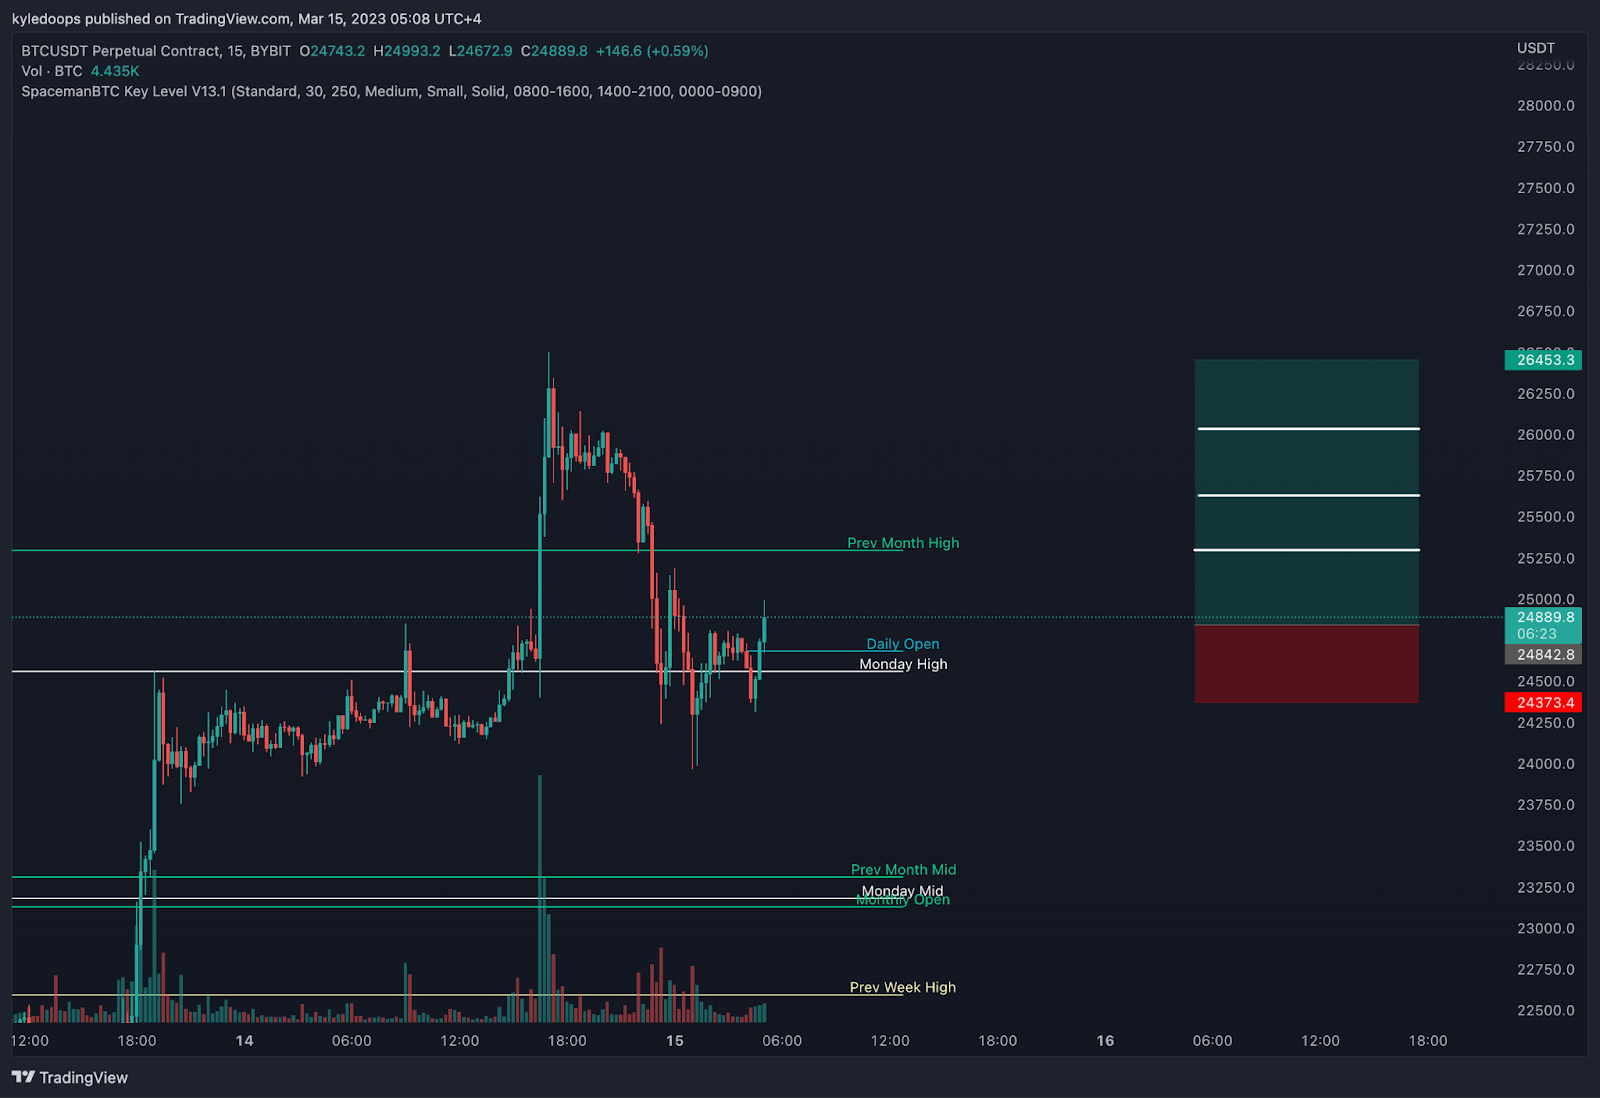
Chart #3 - Bitcoin (BTCUSDT) 15-Minute Chart
Chartist: Kyle
(For the chart screenshot, click here.)
Bitcoin experienced a massive spike to the upside, followed by a deviation back down into its range. So now I am watching to make sure the recent lows hold, and that bitcoin quickly trades back up to where the highs have now been set.
If the high set on Monday holds, it means that we are most likely in for more upside.
Claim your Bitget sign-up bonuses here (details below).
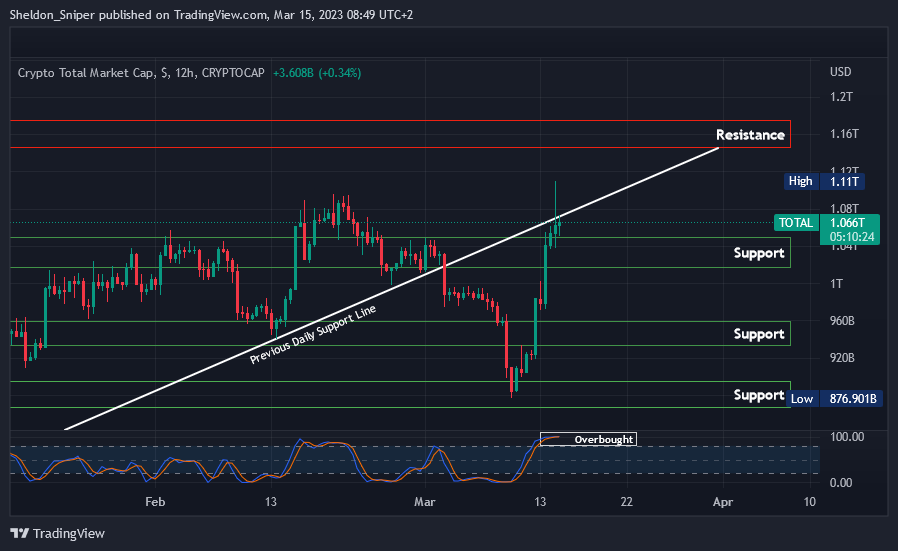
Chart #4 - TOTAL 12-Hour Chart
Chartist: Sheldon
(For the chart screenshot, click here.)
Yesterday the TOTAL saw a significant increase of 7% but found resistance at $1.1 trillion where the previous ascending daily support line intersects. It breached that line on the 3rd of March and this could potentially be seen as a retest.
Currently, at $1.066 trillion, the TOTAL's indicators are overbought on its medium timeframes, so it may head down to the $1T level again. Once there, a relief bounce may take place. But if not, and it breaches that level, the TOTAL will head to $960 billion, and failure to hold there will send it to $900 billion.
To the upside, the next resistance is at $1.16T.
Claim your Bitget sign-up bonuses here (details below).
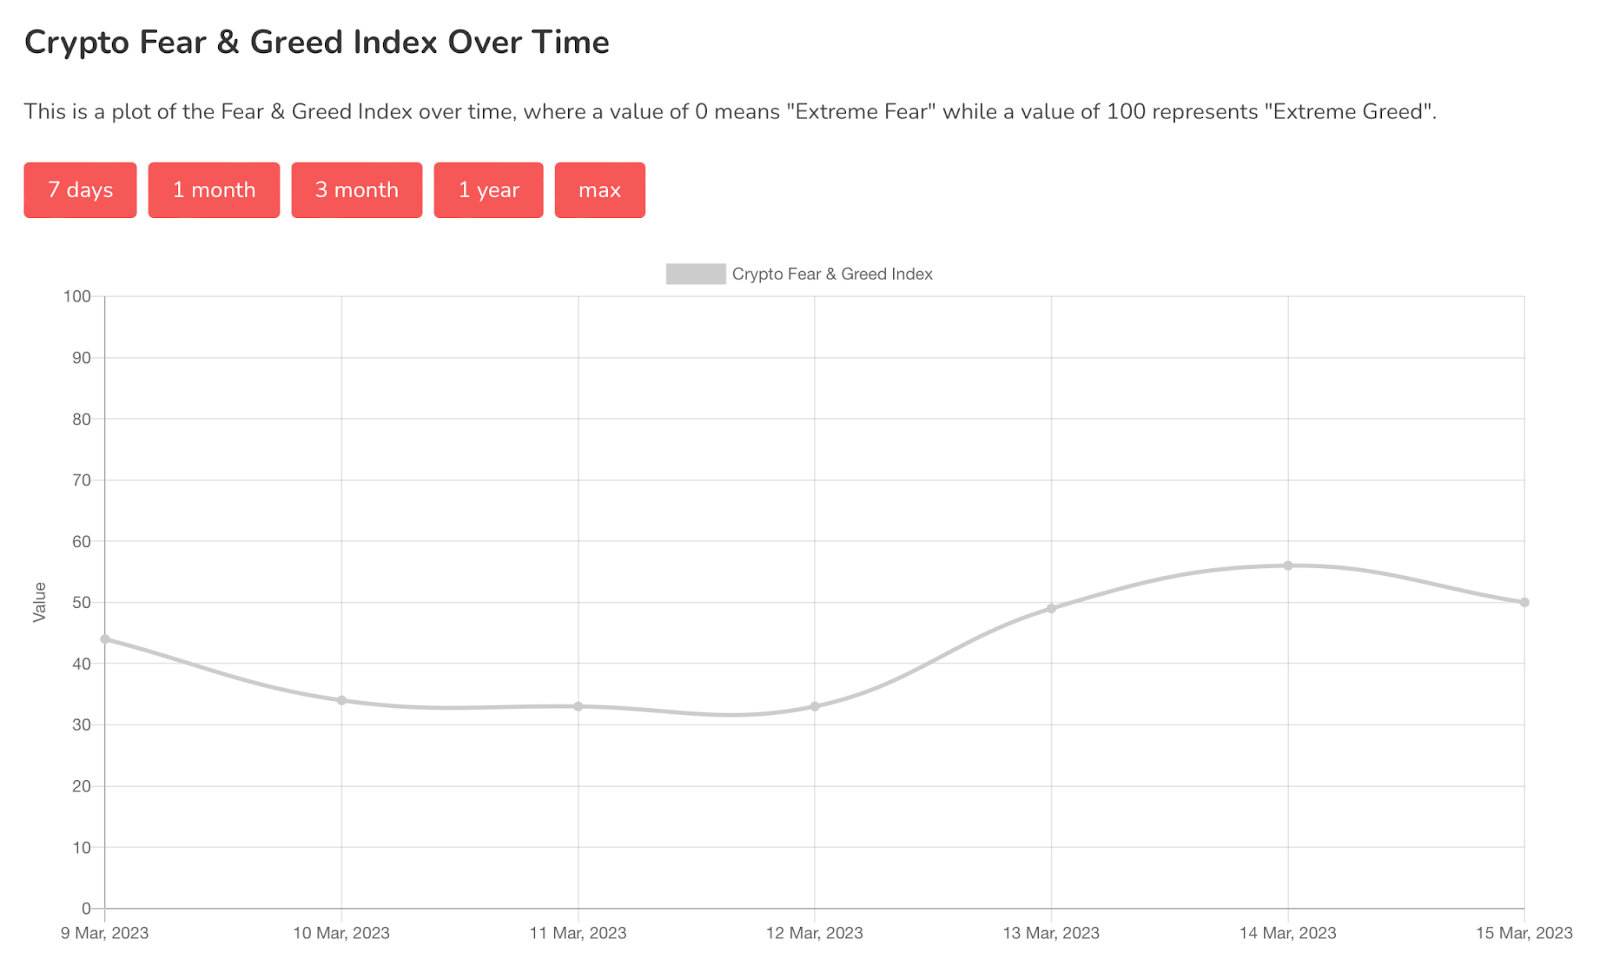
Chart #5 - Bitcoin Fear and Greed Index
The Bitcoin Fear and Greed Index is sitting at 50 today, Neutral.
The highest the index has been over the past seven days is 56, and the lowest is 33.
Overall Market Sentiment (Banter’s Take)
PPI data is out today which, alongside yesterday's CPI results, will be used by the Fed to decide what the updated interest rate will be - ultimately determining whether we go up or back down.
Chart-wise, bulls want to see consolidation and a grind back above bitcoin's range high, of $25,000. The bears, on the other hand, will be looking for the recent daily close on bitcoin to hold as a swing failure pattern.
If bitcoin starts turning down sharply, it must hold $23,500, or the bears will be back in control.
Stay safe my friends!
Go to our Crypto Banter Discord here where Sheldon and Kyle give updates on the charts and trades from The Daily Candle newsletter!
Bybit winner - 2714747