

📈📉 If THIS Happens ETH Goes FULL BULL!
📈📉 If THIS Happens ETH Goes FULL BULL!
PLUS: TOTAL3 Needs to Reclaim THIS Level ASAP!
Overview
Chart #1 - S&P 500 (SPX) Daily
Chart #2 - Ethereum to Bitcoin Ratio (ETHBTC) Daily
Chart #3 - Crypto Total Market Cap Exc. BTC and ETH (TOTAL3) Daily
Chart #4 - Solana (SOLUSDT) Daily
Chart #5 - Fear and Greed Index
Chart #1 - S&P 500 (SPX) Daily
Chartist: Sheldon
(For the chart screenshot, click here.)
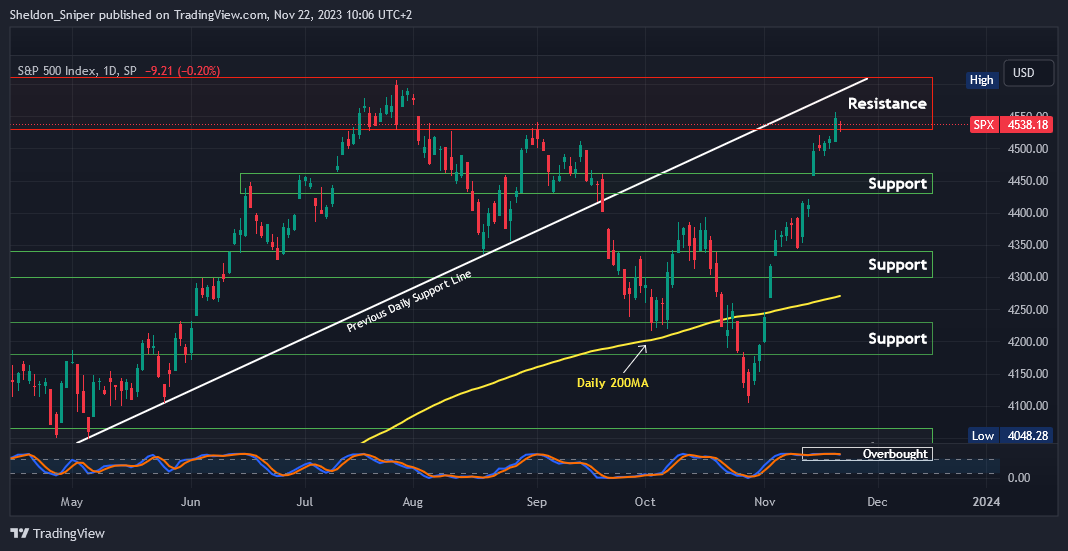
After a rally in the SPX over the last three weeks, the SPX has once again reached its 4,530 - 4,600 resistance, which is the same area that the SPX was rejected at the end of July.
It is currently at 4,538 and overbought.
I am now watching to see if this is a retest of the break.
If it gets rejected, the next area of support is at 4,430 - 4,460.
Sign-up and trade on Bybit today.
Exclusive $30,000 deposit rewards and bonuses up for grabs!
Chart #2 - Ethereum to Bitcoin Ratio (ETHBTC) Daily
Chartist: Kyle
(For the chart screenshot, click here.)
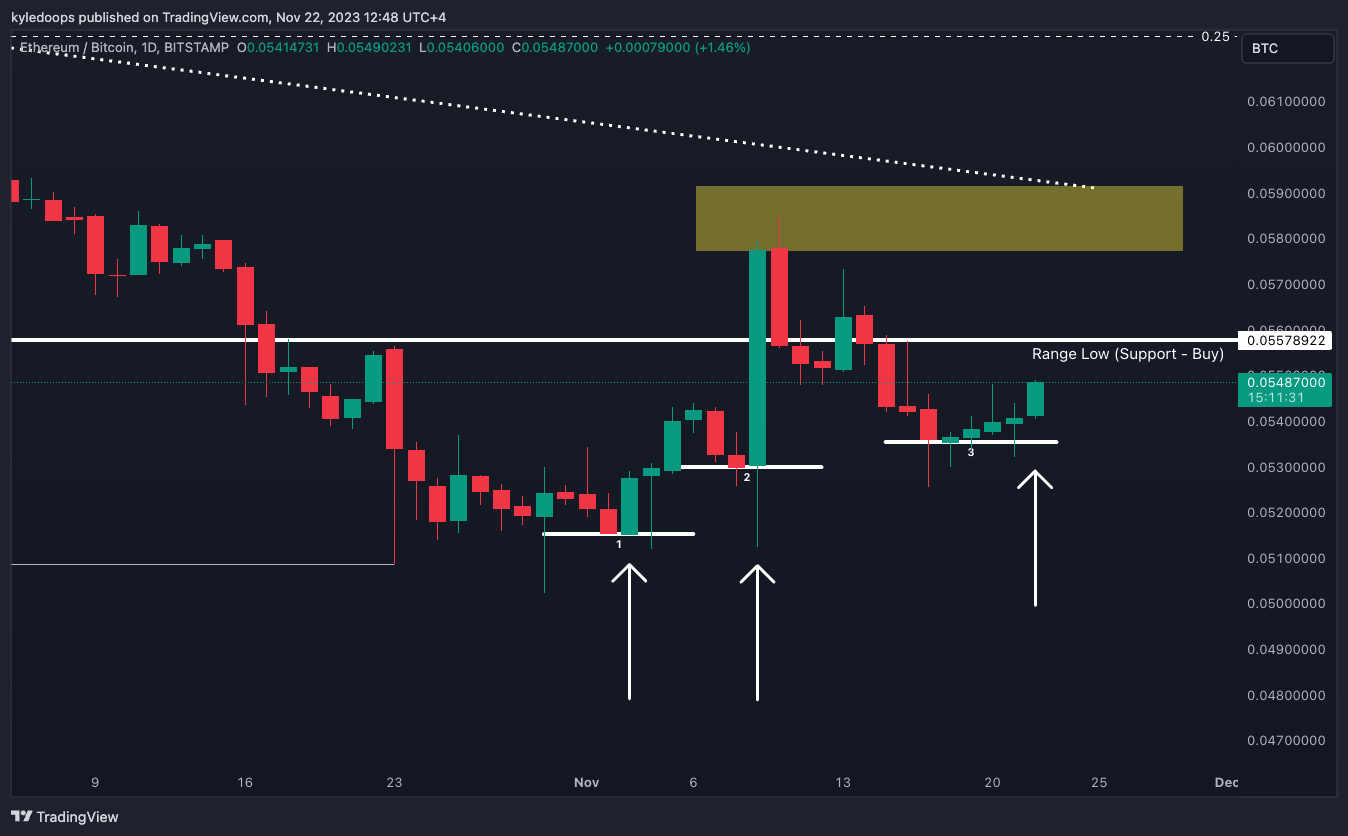
ETH/BTC is on track to reclaim the range low support.
The price is pushing up to the 0.055 level; a reclaim likely confirms the deviation, at which point ETH outperforms BTC in the short to mid-term.
Getting above the yellow box will activate full bull.
Claim your Bitget sign-up bonuses here (details below).

Outsmart 99% Of The Market!
Get full access into our Discord And Telegram group, where you'll find all of our premium content!
👉 Trade Signals!
👉 Trade Set-Ups!
👉 Trading Challenges!
👉 Education!
👉 SO MUCH MORE!
Chart #3 - Crypto Total Market Cap Exc. BTC and ETH (TOTAL3) Daily
Chartist: Kyle
(For the chart screenshot, click here.)
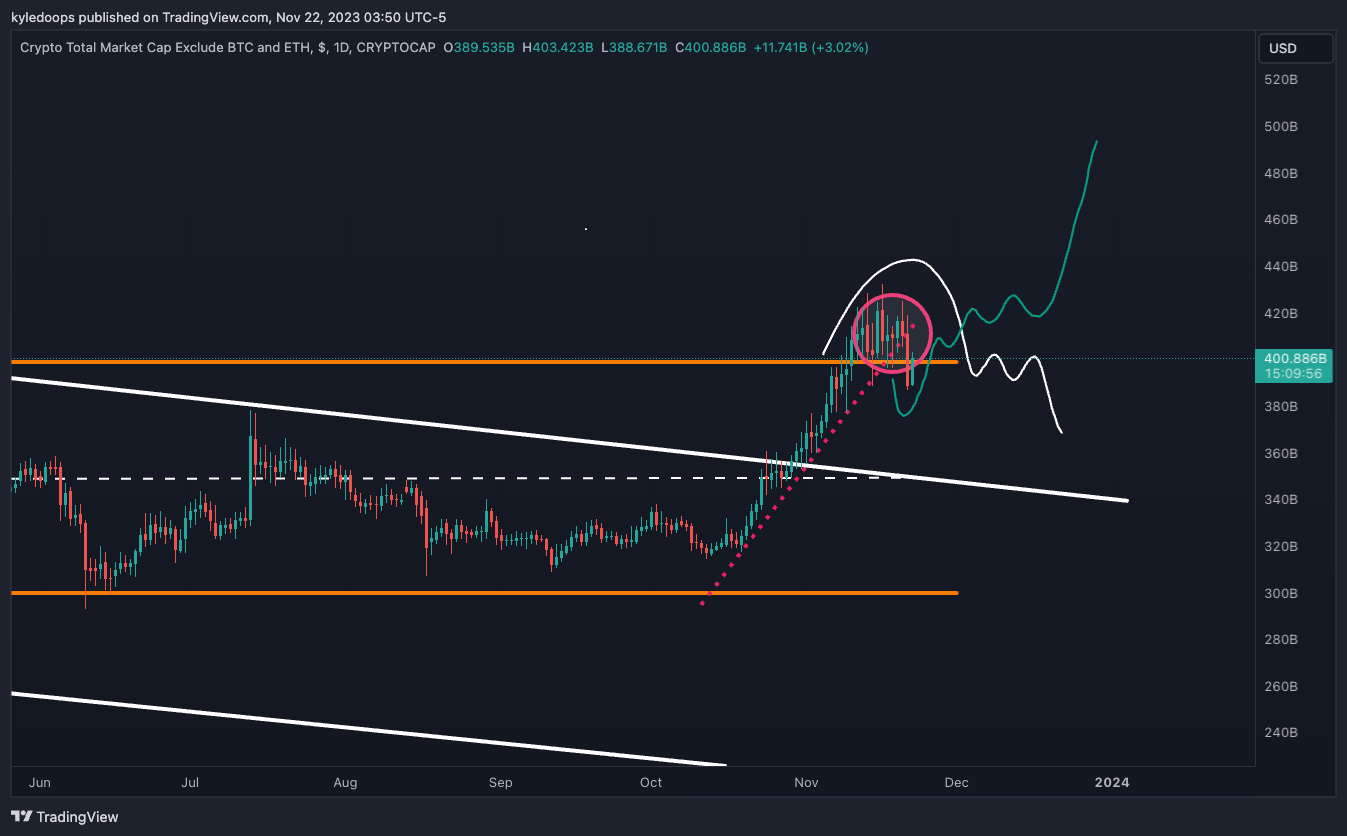
It's decision time for TOTAL3!
A break of trend occurred, and a break back into the range occurred too, but only one candle close occurred. If it follows the white path lines, that would be bearish for alts in the short term and confirm that there is a deeper selloff before the higher low occurs.
If it reclaims $400B, that likely confirms a shallow pullback and bulls should take control once again.
Claim your Bitget sign-up bonuses here (details below).
Chart #4 - Solana (SOLUSDT) Daily
Chartist: Sheldon
(For the chart screenshot, click here.)
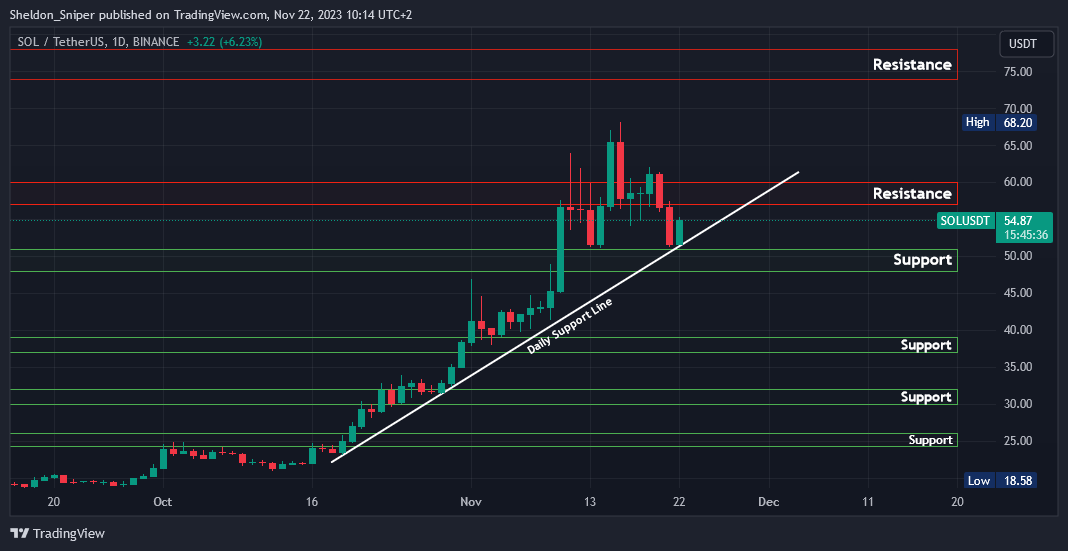
SOL is just below $55.00, and this current move up could be a retest of the break of the previous support at around $57.00.
A rejection will send it down to $48.00 - $51.00.
A break through could send it as high as $75.00 - $78.00.
Claim your Bitget sign-up bonuses here (details below).
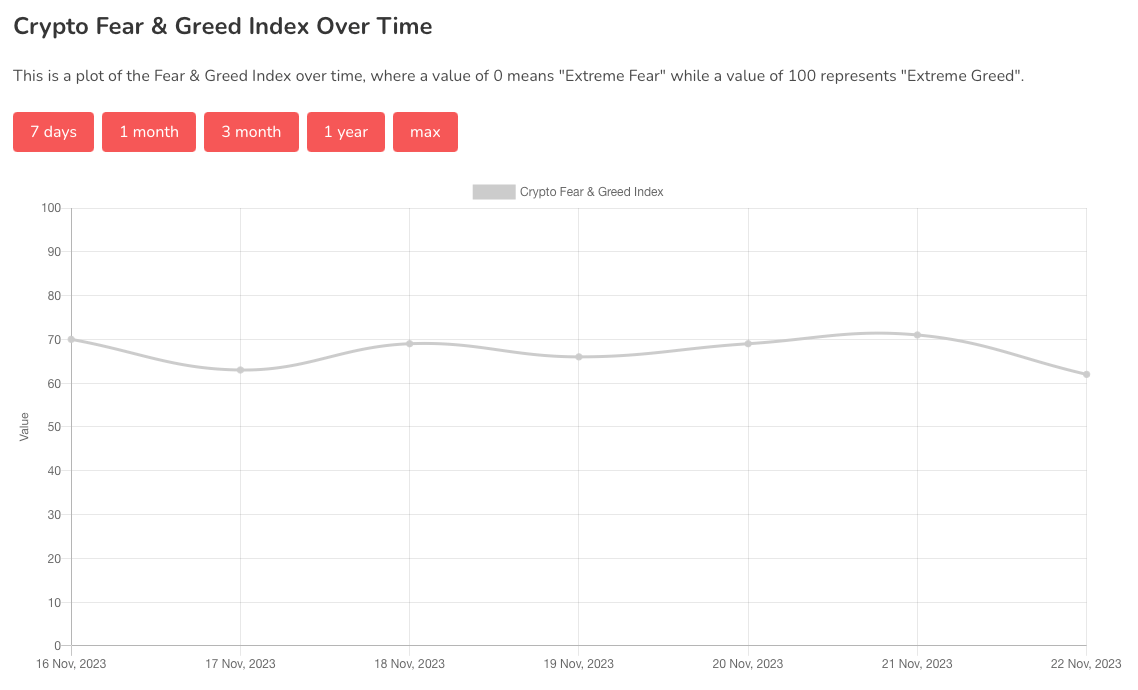
Chart #5 - Fear and Greed Index
The Fear and Greed Index is sitting at 62 today, indicating Greed.
The highest the index has been over the past seven days is 71, and the lowest is 62.
Banter’s Take
Major crypto risk factors have been addressed, notably the concerns surrounding a Binance collapse, potentially paving the way for price rallies in the coming weeks.
Despite many altcoins already having broken trends to the downside, caution is advised! There could still be further downside.
Stay safe my friends!
Go to our Crypto Banter Discord here where Sheldon and Kyle give updates on the charts and trades from The Daily Candle newsletter!