

📈📉 If this happens next, bitcoin is going to $28k! Will ETH break resistance?
📈📉 If this happens next, bitcoin is going to $28k! Will ETH break resistance?

Bitget winner - 7462419289
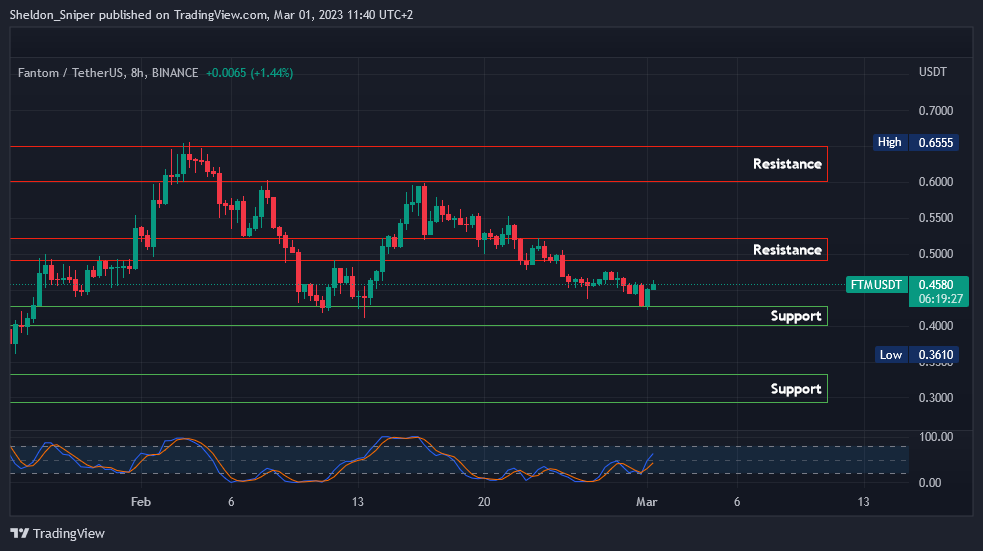
Chart #1 - Fantom (FTMUSDT) 8-Hour Chart
Chartist: Sheldon
(For the chart screenshot, click here.)
Over the past four weeks, FTM dropped from $0.6555 to support at $0.40 - $0.42, a level it has tested twice now. Currently, FTM is trading at just below $0.46.
If the market continues its bullish momentum, FTM should test resistance at $0.50. Breaking through there would take it to $0.55, and possibly $0.60 (resistance). If it heads down though, FTM will likely visit support at $0.40. Losing that level will take it to $0.30.
I believe FTM still has room to move up in the next few months.
Check our Crypto Banter Discord here for updates!
Follow me on Twitter for urgent updates on my trading progress!
Claim your Bitget sign-up bonuses here (details below).
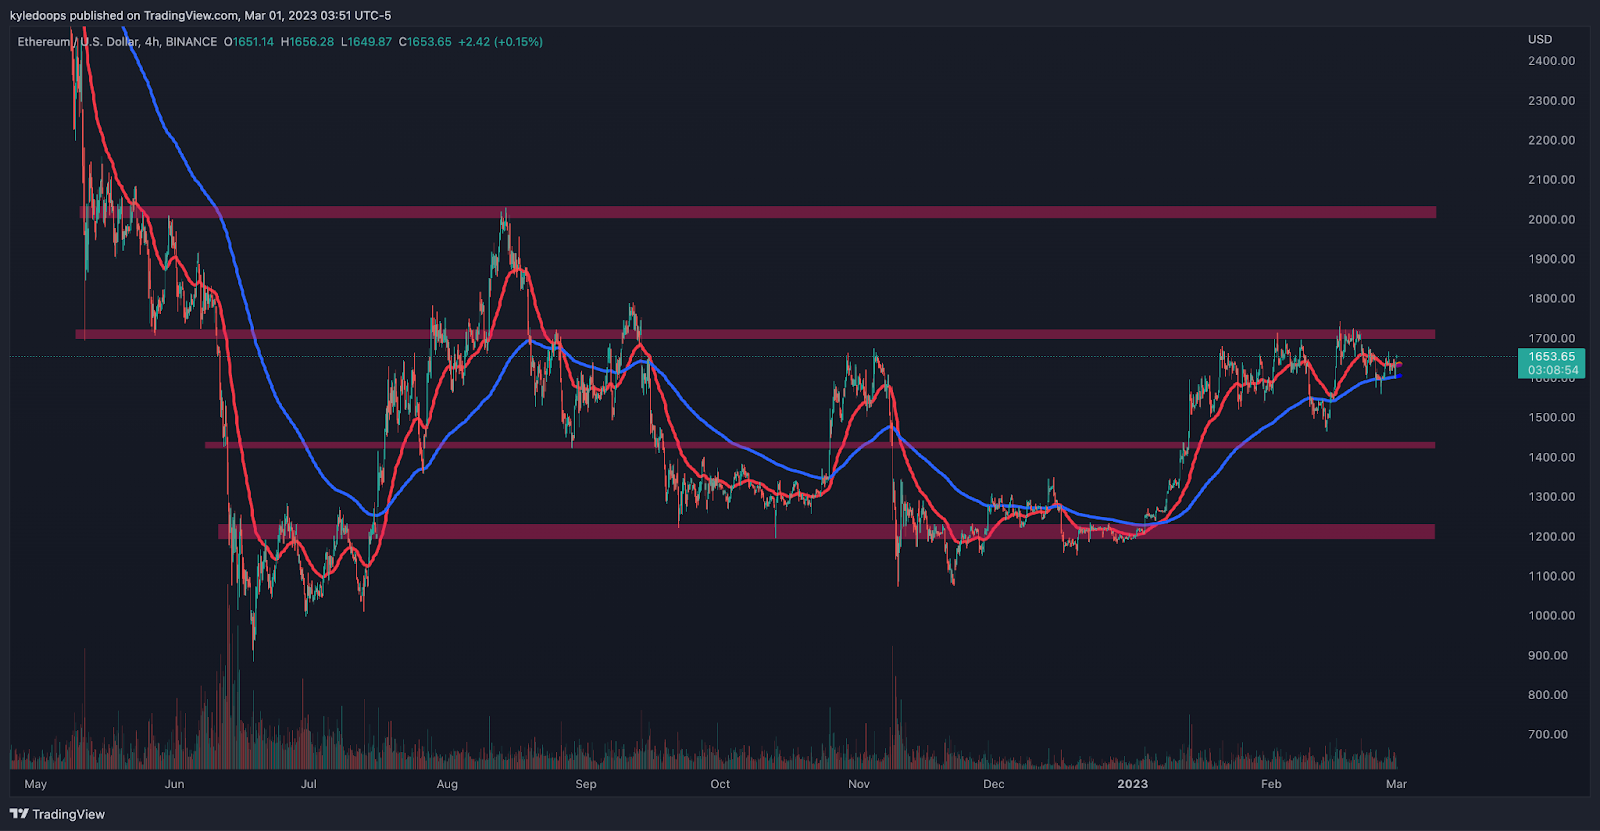
Chart #2 - Ethereum (ETHUSD) 4-Hour Chart
Chartist: Kyle
(For the chart screenshot, click here.)
ETH still finds itself caught below the important $1,700 resistance level.
The 50 EMA and 200 EMA are still in a bullish posture, with the golden cross present. That means that if ETH can simply continue moving sideways, or slightly up, and push into resistance, it will likely break through it.
If the price falls below the EMAs, then it's likely ETH revisits $1,429.
Check our Crypto Banter Discord here for updates!
Make sure to follow me on Twitter, where I will post updates on my trades as they unfold!
Claim your Bitget sign-up bonuses here (details below).
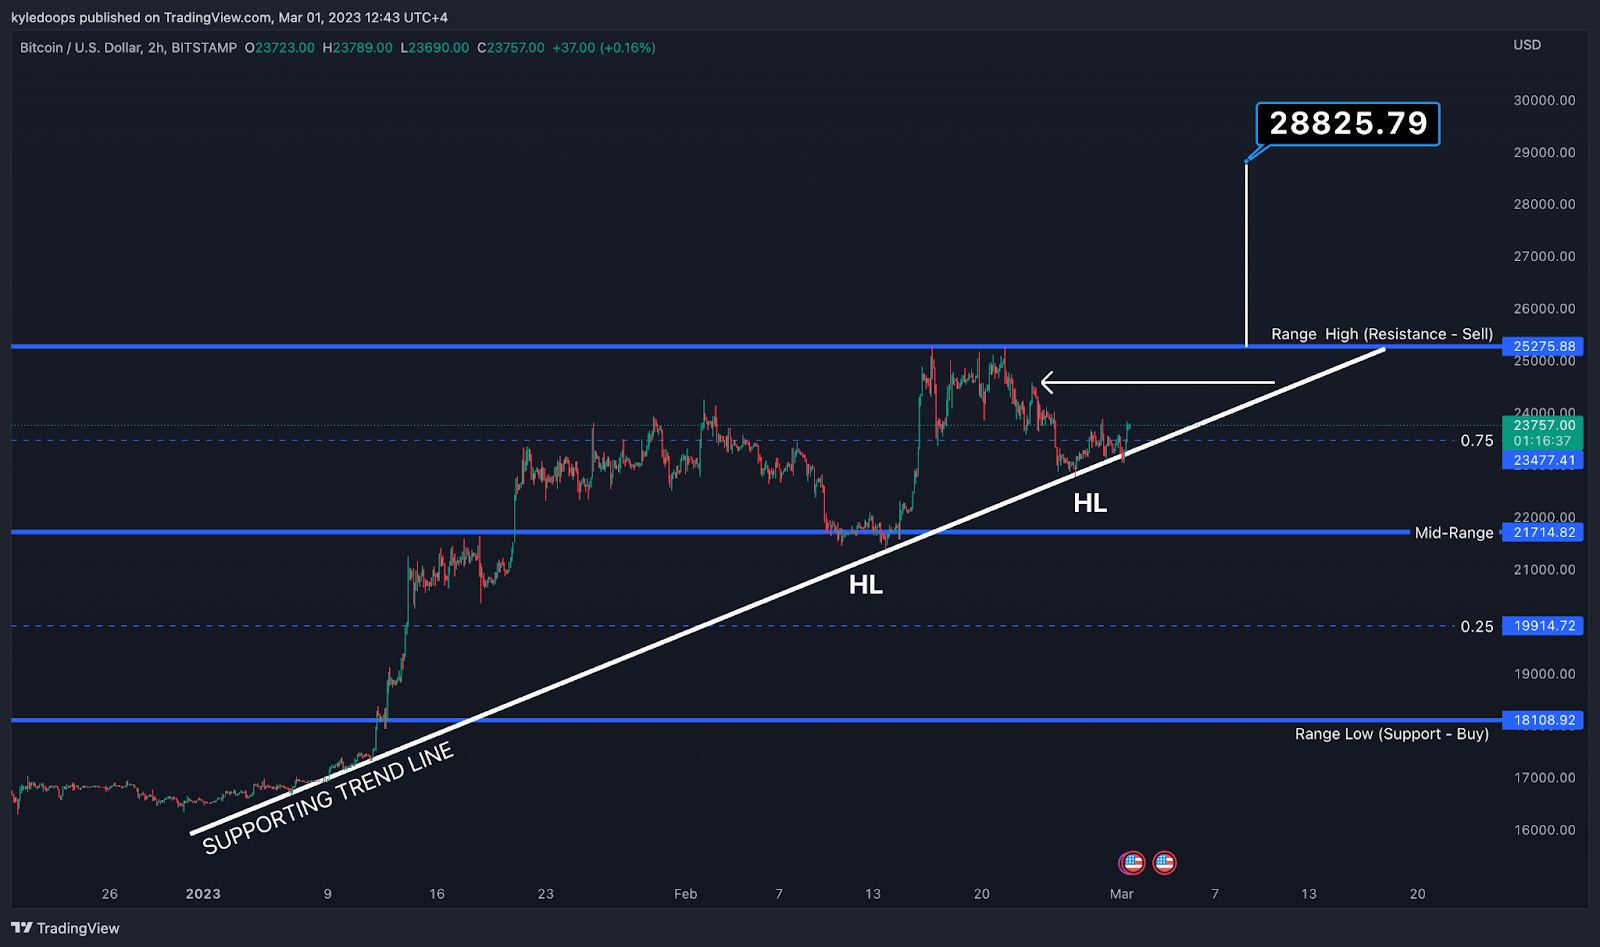
Chart #3 - Bitcoin (BTCUSD) 2-Hour Chart
Chartist: Kyle
(For the chart screenshot, click here.)
Bitcoin has managed to reclaim the 0.75 level of the range it is currently trading within, and at the same time is holding its diagonal trend line.
If the price can confirm a higher low on the charts, the next thing I will be looking at is the potential for an ascending triangle to form.
The formation of an ascending triangle would have a measured move up to $28,825 and would also mean a break of the major resistance at $25,275.
Check our Crypto Banter Discord here for updates!
Make sure to follow me on Twitter, where I will post updates on my trades as they unfold!
Claim your Bitget sign-up bonuses here (details below).
Chart #4 - S&P 500 (SPX) 8-Hour Chart
Chartist: Sheldon

(For the chart screenshot, click here.)
Over the past four weeks, the S&P 500 dropped from 4,200 to 3,940 and found support on its previous weekly resistance line that began forming in January 2022.
It moved up again, but unfortunately straight into resistance at 4,000. There, it got rejected, and now finds itself at 3,970. Notice that indicators on higher time frames are oversold, so I suspect it's getting ready to make an attempt on 4,000 again. If it breaks through, the next resistance is around 4,150.
If it drops from here, the next support is at 3,900. Breaking that level and moving back under the weekly support line, could take it to support at 3,800.
Crypto is following the US stock market closely, so if the SPX increases later in the week, crypto should follow.
Check our Crypto Banter Discord here for updates!
Follow me on Twitter to get all the updates on my personal trading progress!
Claim your Bitget sign-up bonuses here (details below).
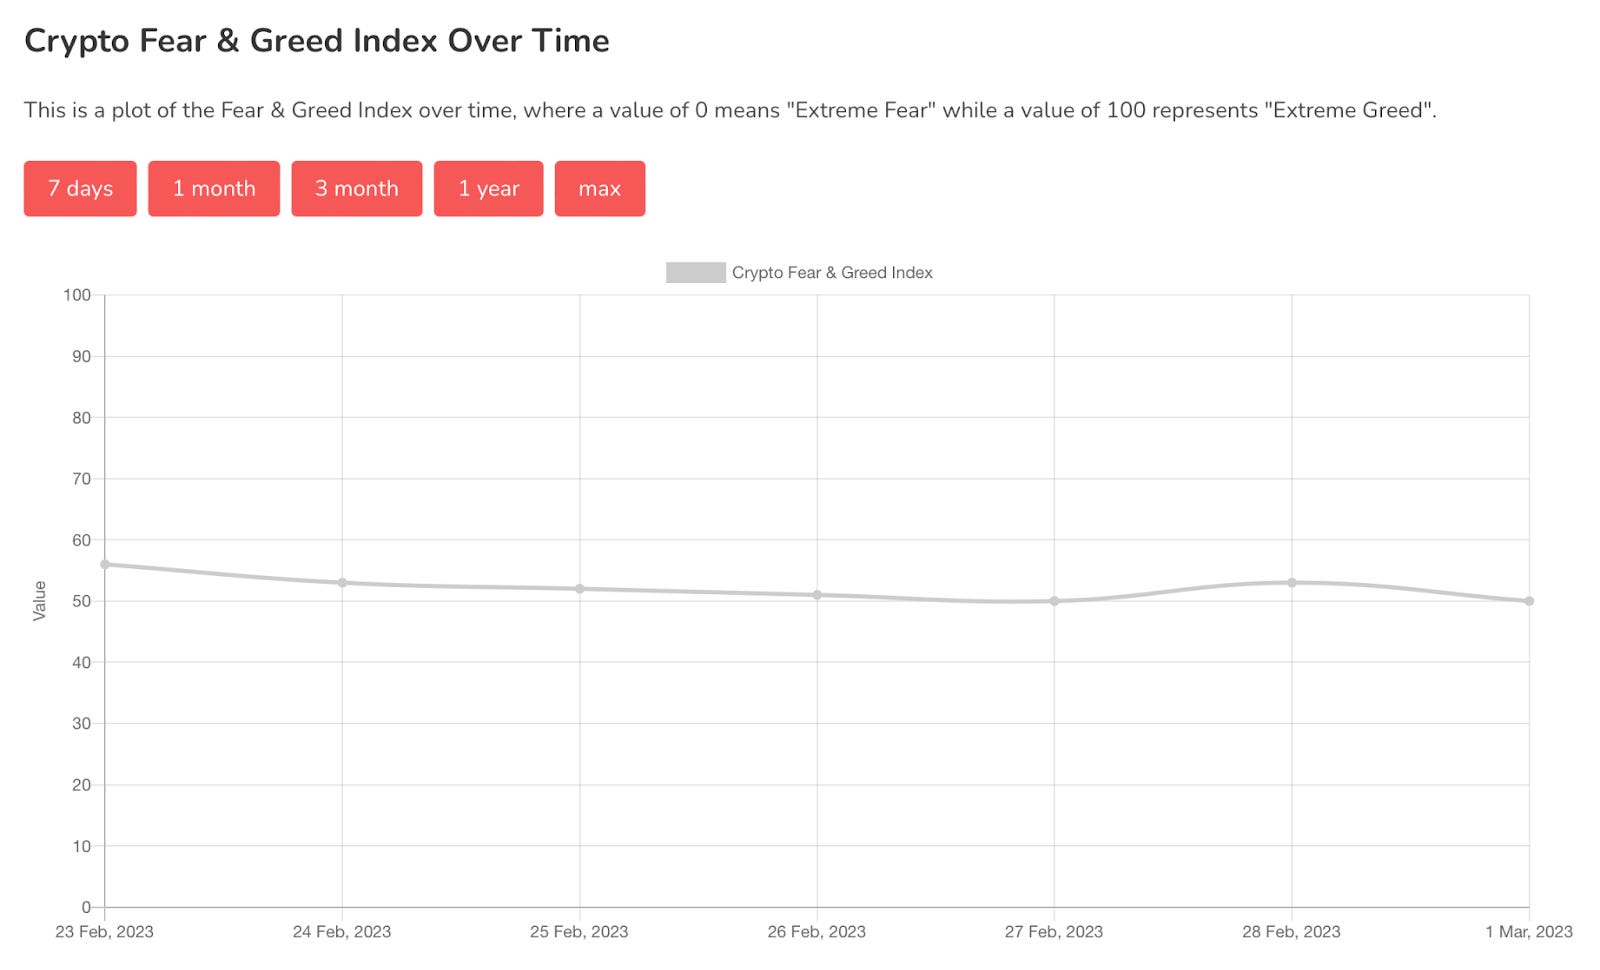
Chart #5 - Bitcoin Fear and Greed Index
The Bitcoin Fear and Greed Index is sitting at 50 today, Neutral.
The highest the index has been over the past seven days is 56, and the lowest is 50.
Overall Market Sentiment (Banter’s Take)
Multiple coins are bouncing from support and creating their higher lows, and a strong daily close would confirm the higher low on bitcoin. If that happens, the next thing we want to see is a higher high.
But we must remain cautious in case of a swing failure pattern and liquidity grab that would see an upward thrust stop out the shorts, only to then come back down into the range.
Stay safe my friends!
Bybit winner - 28472878