Hey Chart Hackers,
For those who missed our entries in Chart Hackers and the show, these are some setups that could play out next. Don’t miss them!
Let’s dive in!
Overview
Chart #1 - Bitcoin (BTCUSD) 1-Day
Chart #2 - Fartcoin (FARTCOINUSDT) 2-Hour
Chart #3 - Virtuals Protocol (VIRTUALUSDT) 8-Hour
Chart #4 - Turbo (TURBOUSDT) 12-Hour
Chart #5 - Optimism (OPUSDT) 4-Hour
Chart #6 - Gold (XAUUSD) 8-Hour
Chart #1 - Bitcoin (BTCUSD) 1-Day
Chartist: Dylan
(For the chart screenshot, click here.)
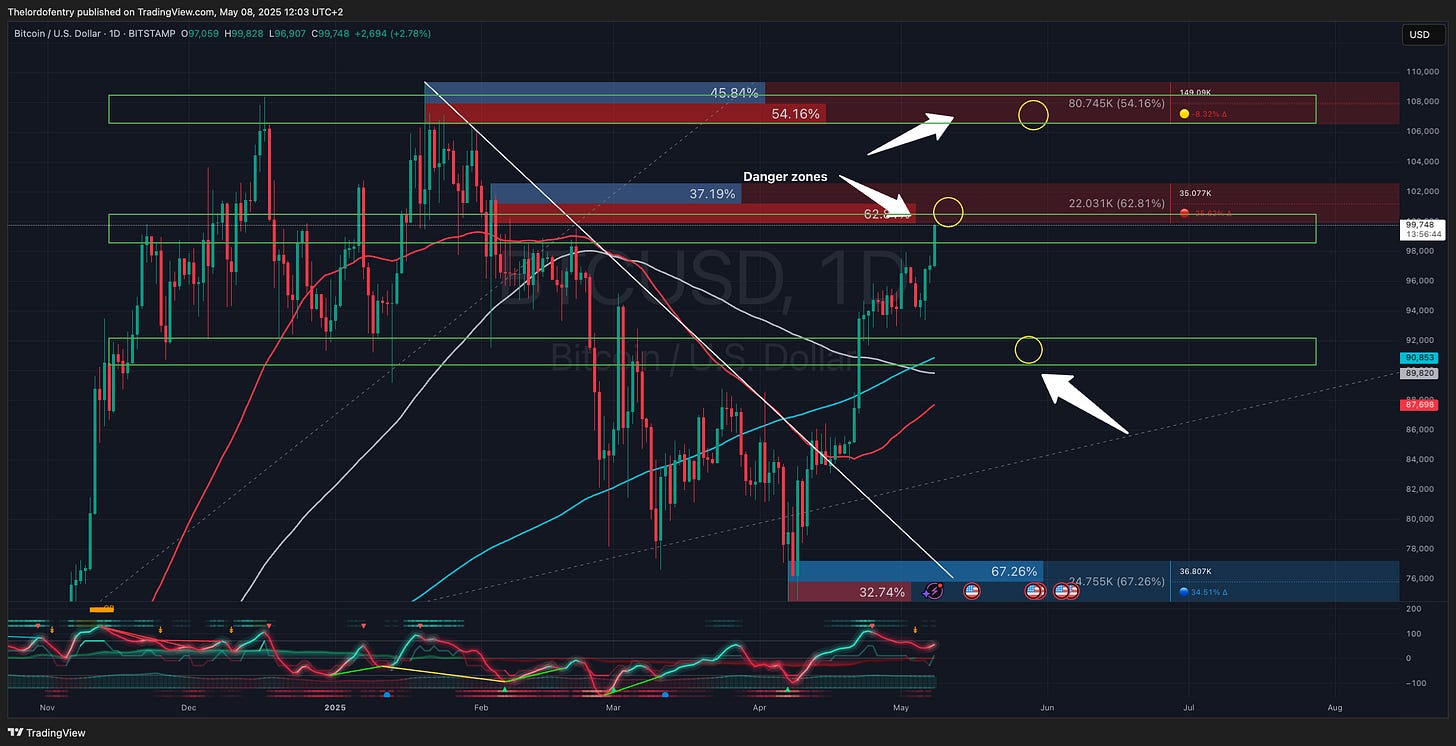
BTC has responded well to the recent tariff, macro, and FOMC news but is now approaching one of two big danger areas: $100,000 and $108,000.
I’d like to see some consolidation in or just below these regions to give the alts time to flex and run a bit. A hard rejection in any of these zones could do some alt damage, so make sure you are watching the BTC chart and dominance charts regularly - I cover this daily on my show.
If you would like to find out more about using the Oscillator, join Chart Hackers and register for the Xcelerator course!👇
Chart #2 - Fartcoin (FARTCOINUSDT) 2-Hour
Chartist: Dylan
(For the chart screenshot, click here.)
Fresh longs on dips into the $1.02/$1.05 region, potential short options at $1.20 and $1.29. I want to see a few reversal signs before entering the shorts here. Make sure you are watching the show daily.
If you would like to find out more about using the Oscillator, join Chart Hackers and register for the Xcelerator course!👇
Good Morning Crypto
Trump's first trade deal is sending crypto soaring—will Bitcoin break $100K? Meanwhile, altcoins like Celestia (TIA) and Io.net (IO) are surging on Upbit listings, but history suggests a 79% chance of a crash.
Discover more in today's Good Morning Crypto! 👇
Chart #3 - Virtuals Protocol (VIRTUALUSDT) 8-Hour
Chartist: Dylan’s Chart Hackers Team
(For the chart screenshot, click here.)
VIRTUAL has broken out of a long-term descending trendline, retesting a key Fair Value Gap (FVG) and showing signs of a "Turtle Soup" fake-out above recent highs. We are now looking for a healthy pullback into a confluence of key support levels for a high-probability long entry.
Our entry zone aligns with:
0.618 Fibonacci Retracement at $0.9766
0.5 Fibonacci Retracement at $1.1497
Daily 50 EMA (Blue Line) support
Levels:
Entry: $0.97 - $1.14
TP1: $1.49 (Recent high/liquidity sweep zone)
TP2: $1.83 - $1.84 (Major resistance level & psychological target)
TP3: Above $2.00 (optional hold if momentum continues and macro structure supports continuation)
Stop Loss: Below $0.93
This sits below the 0.618 Fibonacci, the EMA, and the VAH, giving the trade room to breathe while protecting capital if structure fails.
If you would like to find out more about using the Oscillator, join Chart Hackers and register for the Xcelerator course!👇
Chart #4 - Turbo (TURBOUSDT) 12-Hour
Chartist: Dylan’s Chart Hackers Team
(For the chart screenshot, click here.)
A short-term pullback is looking likely for TURBO.
Today, we've seen a surge in the altcoin market, but TURBO seems to have lost some steam as it has rallied 278% since the April 16th lows.
We are currently rejecting the 200-day MA and Anchored VWAP, which could indicate this as a reversal zone.
We are currently fighting against a Point of Control showing on the Chart Prime 12-hour time frame, and we've also printed a Bearish Divergence with a Blue Reversal Dot a few candles ago.
Currently looking for a potential 30% pullback towards the AVWAP dropped from the lows, which also ties in with a 0.382 Max Extension Pull.
If you would like to find out more about using the Oscillator, join Chart Hackers and register for the Xcelerator course!👇
Chart #5 - Optimism (OPUSDT) 4-Hour
Chartist: Dylan’s Chart Hackers Team
(For the chart screenshot, click here.)
While a lot of the market has been moving today, OP is lagging behind. This can be either a sign of weakness in a token or what's to follow.
As such, I am offering two views here.
Note firstly the RSI and cashflow wave on the oscillator, both facing firmly up and nice and low, indicating a big push to the upside to come.
Candles are still red; however, combine this with the previous S (Short) signal and TP1 that went with it, and the candles should start to change to green soon.
We still have 25% of a move to meet the trendline, ample room to go, and a potential huge trade.
This run will depend on the market as a whole and Bitcoin, so we will likely, in Chart Hackers, be moving stop losses up as we go and updating this chart daily to maximize our profit.
Levels:
Entry: $0.60 - $0.62 region
TP1: $0.71 region
TP2: $0.83 region
TP3: $0.91 region
Stop Loss: Below $0.57
SL below the yellow line under the wicks; this trade can be as much as a 5:1 trade depending on levels.
Bearish View:
As shown in the same chart – if we reject on the underside of this most local order block to the upside, it’s still a 7% move up and therefore a good trade when well managed. We will look to assess it at each level and update accordingly.
If you would like to find out more about using the Oscillator, join Chart Hackers and register for the Xcelerator course!👇
Chart #6 - Gold (XAUUSD) 8-Hour
Chartist: Dylan
(For the chart screenshot, click here.)
Gold has recently sold off on the sentiment shift into equities and crypto. If this momentum continues in these markets, we should see gold sell off and give us some entries on the next bit of macro “bad news.”
Zones I like for my longs are:
$3,200/$3,250
$3,100/$3,150.
If you would like to find out more about using the Oscillator, join Chart Hackers and register for the Xcelerator course!👇


