Hey Chart Hackers,
AIXBT could go either way, so we're looking at both long and short setups today to ensure we don’t miss out. Meanwhile, with Sonic Summit 2025 approaching (May 6–8, 2025, Vienna), I’m going long on Sonic (S).
Let’s dive in!
Overview
Chart #1 - Bitcoin (BTCUSD) 3-Day
Chart #2 - Bitcoin (BTCUSDT) Perpetuals 4-Hour
Chart #3 - Gala (GALAUSDT) Perpetuals 8-Hour
Chart #4 - Jupiter (JUPUSDT) 4-Hour
Chart #5 - Sonic (SUSDT) 4-Hour
Chart #6 - aixbt (AIXBTUSDT) 8-Hour
Chart #7 - Microsoft Corporation (MSFT) 1-Week
Chart #1 - Bitcoin (BTCUSD) 3-Day
Chartist: Dylan
(For the chart screenshot, click here.)
BTC is currently showing some promising bullish signals. However, a retest of the $89,000–$90,000 zone cannot be ruled out before the next significant move upward (if it occurs).
Key rejection zones to watch for on any BTC strength: $96,000 and $99,000–$100,000.
f you would like to find out more about using the Oscillator, join Chart Hackers and register for the Xcelerator course!👇
Chart #2 - Bitcoin (BTCUSDT) Perpetuals 4-Hour
Chartist: Dylan
(For the chart screenshot, click here.)
Note the bullish divergence on the 4-hour chart while BTC remains in a tight range/flag pattern. Based on the liquidation heatmap and this bullish divergence, I'm leaning toward a breakout to the $95,500 region today.
Bull Case: A break of the flag pattern followed by a retest could signal a long opportunity targeting $99,000.
Bear Case: Watch for a potential fakeout into the liquidation cluster. Possible short opportunities may arise at the high $96,000 or low $97,000 levels.
If you would like to find out more about using the Oscillator, join Chart Hackers and register for the Xcelerator course!👇
Chart #3 - Gala (GALAUSDT) Perpetuals 8-Hour
Chartist: Dylan’s Chart Hackers Team
(For the chart screenshot, click here.)
GALA failed to break above the Value Area High (VAH) and is now trading below the Point of Control (POC) while sitting at the 50-day EMA on the daily timeframe. This indicates fading bullish momentum and a potential pullback.
Current Outlook:
Rejection from VAH suggests buyer exhaustion.
Price below POC signals value shifting lower.
Testing the 50-day EMA as support, but no strong bounce has occurred yet.
Key Levels:
Entry Zone (Pullback Expected): $0.01528 (Value Area Low - VAL)
Demand Zone: $0.01528 to $0.01421 (aligns with 50%–61.8% Fibonacci retracement)
TP1: $0.01917
TP2: $0.02202
Game Plan: Anticipating a clean pullback to VAL at $0.01528 for a potential long setup. Will wait for confirmation (e.g., bullish structure or a strong reaction wick). No longs while price remains below POC and VAH—patience is key.
If you would like to find out more about using the Oscillator, join Chart Hackers and register for the Xcelerator course!👇
Good Morning Crypto
An explosive move is imminent for crypto!
Is Ethereum (ETH) about to go on a 7-day rally?
Dive into today's issue of Good Morning Crypto! 👇
Chart #4 - Jupiter (JUPUSDT) 4-Hour
Chartist: Dylan’s Chart Hackers Team
(For the chart screenshot, click here.)
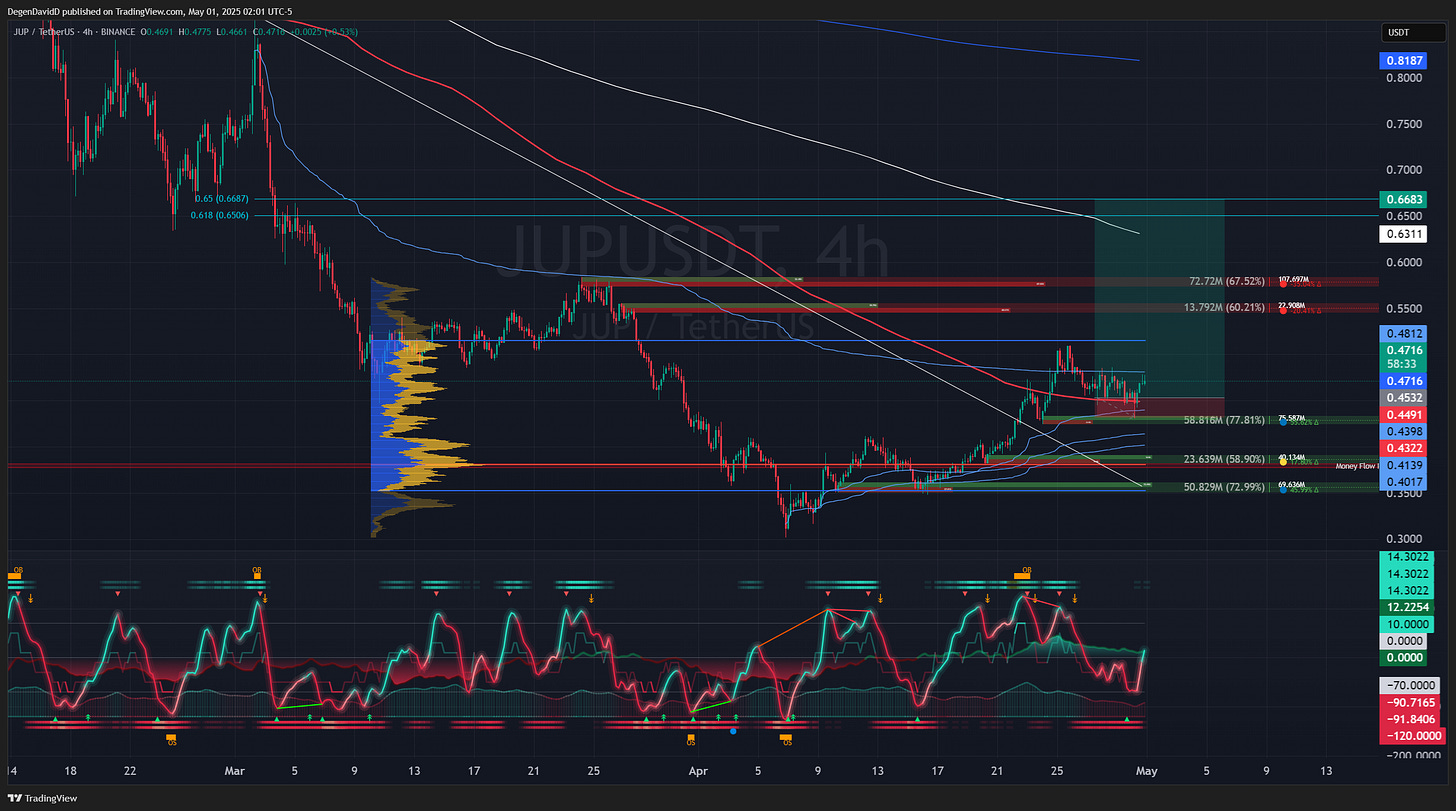
JUP is holding the 50-day Moving Average and has bounced off a bullish order block, signaling a potential move toward the 0.618 Fibonacci retracement in the medium term.
It broke its downtrend on April 22 and has been consolidating above the 50-day Moving Average while holding the Anchored VWAP. A bullish order block, visible on Chart Prime below the 50-day MA, reinforces JUP’s bullish posture, setting the stage for the next leg up. Many tokens that rallied in recent weeks have reached their 100-day Moving Average, with some consolidating above it. JUP is currently 33% below its 100-day MA, making it a plausible short-term target.
Trade Setup:
Target: 100-day Moving Average (approximately 33% from current levels)
Stop Loss: Below the 50-day Moving Average and Anchored VWAP at approximately $0.4491
If you would like to find out more about using the Oscillator, join Chart Hackers and register for the Xcelerator course!👇
Chart #5 - Sonic (SUSDT) 4-Hour
Chartist: Dylan’s Chart Hackers Team
(For the chart screenshot, click here.)
Entry: $0.54 region
Stop Loss (SL): $0.515 region
Take Profit 1 (TP1): $0.62 region
Take Profit 2 (TP2): $0.75 region
Despite the cautious “Sell in May” sentiment, Sonic continues to show strength. We have been capturing key levels since April 9, when we tapped the bottom of the descending channel. Since then, we’ve been in a lucrative long position within Chart Hackers.
Points of Note:
Cashflow and RSI on the oscillator are primed for an upward push.
Reversal signals printed on both the chart and oscillator four candles ago.
By capturing this level in the local structure, we are confirming an uptrend.
We’ve pushed through two order blocks, with the next blocks (highlighted on the chart) aligning with TP1 and TP2.
Resistance around $0.57 must be breached. Once the trade is in profit, consider moving the stop loss to break-even to protect gains.
Additional Observations:
The first green candle (bullish action) has appeared.
We’re awaiting the oscillator turning green and the cashflow wave turning positive, both expected within the next few hours if no rejection occurs.
If the oscillator and cashflow wave begin to decline, a rejection may be occurring at the current order blocks. We’ll protect our trade by running a stop loss—we’ll never trade without one.
If you would like to find out more about using the Oscillator, join Chart Hackers and register for the Xcelerator course!👇
Chart #6 - aixbt (AIXBTUSDT) 8-Hour
Chartist: Dylan’s Chart Hackers Team
(For the chart screenshot, click here.)
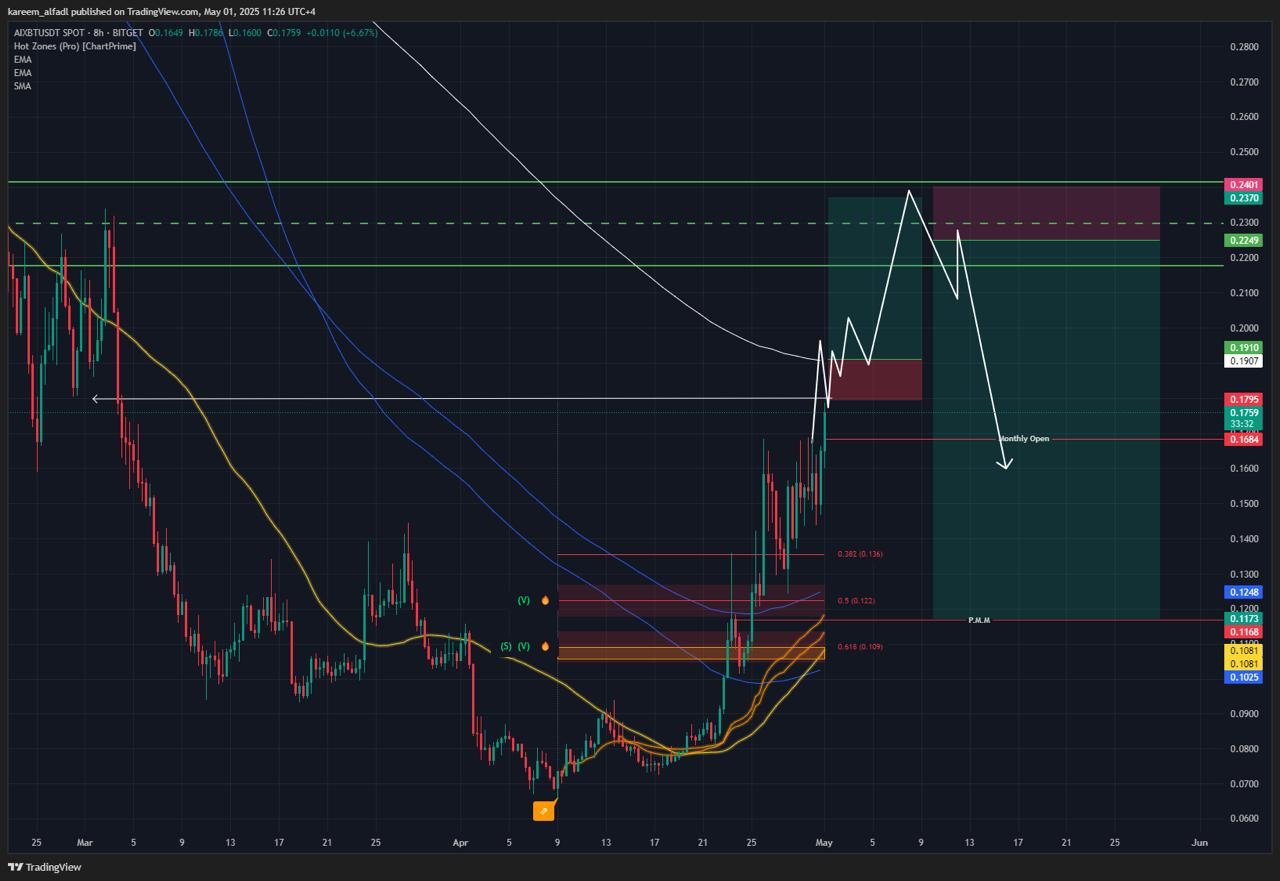
AIXBT and the broader AI sector have shown relative strength, with the AI narrative gaining traction recently. AIXBT, alongside Virtual, has been a leader from the start and retains some momentum, though higher timeframes indicate a slowdown.
The primary trade idea is for us to short. However, if the AI narrative persists, AIXBT is approaching the 100-day Moving Average (MA). Claiming this level could trigger an impulsive upside move, potentially a 25% gain. Should this occur, the Stochastic oscillator is likely to become overbought, signaling a slowdown and setting up the short opportunity.
Trade Setup:
Key Zone: A massive bearish order block spans an 8% range, coinciding with a previous daily support/resistance zone between $0.2250 and $0.2414.
Execution (Long):
Condition: The trade is valid only if the 100-day MA ("white line") is claimed, confirmed by two 4-hour candle bodies closing above the MA. The trigger is a claim of $0.1954, with pullbacks validating a long attempt.
Entry: $0.1955 area (after the 100-day MA is claimed)
Stop Loss: 4-hour close below $0.1800
Technique: I’ll ladder in with three staggered positions
Take Profit (TP):
TP1: $0.22
TP2: $0.24
Execution (Short):
Condition: The trade is valid only if the price loses the bottom of the POC range (around $0.2300). Expect multiple wicks up to $0.24 for fakeouts and liquidity sweeps. I’ll enter on the retest after liquidity is swept around $0.24.
Technique: Ladder in with three staggered positions
Take Profit (TP):
TP1: $0.1900
TP2: $0.17
TP3: $0.132
f you would like to find out more about using the Oscillator, join Chart Hackers and register for the Xcelerator course!👇
Chart #7 - Microsoft Corporation (MSFT) 1-Week
Chartist: Dylan
(For the chart screenshot, click here.)
Microsoft reported an earnings beat and is expected to gap up at market open today. I’d be cautious about longing today’s big green candle, but I’m bullish on a retest of support after the euphoria from the earnings beat subsides.
Trade Setup:
Entry: $398 to $380
Stop Loss: Close below $380
TP1: $420
TP2: $440
TP3: $460
f you would like to find out more about using the Oscillator, join Chart Hackers and register for the Xcelerator course!👇


