

📈📉 Is $25k BTC Possible? + DXY Shows Strength!
📈📉 Is $25k BTC Possible? + DXY Shows Strength!

Overview
Chart #1 - Crypto Total Market Cap (TOTAL) Daily Chart
Chart #2 - Bitcoin (BTCUSD) 4-Hour Chart
Chart #3 - U.S. Dollar (DXY) Daily Chart
Chart #4 - U.S. Government Bonds 10-Year Yield (US10Y) Daily Chart
Chart #5 - Fear and Greed Index

Chart #1 - Crypto Total Market Cap (TOTAL) Daily Chart
Chartist: Sheldon
(For the chart screenshot, click here.)
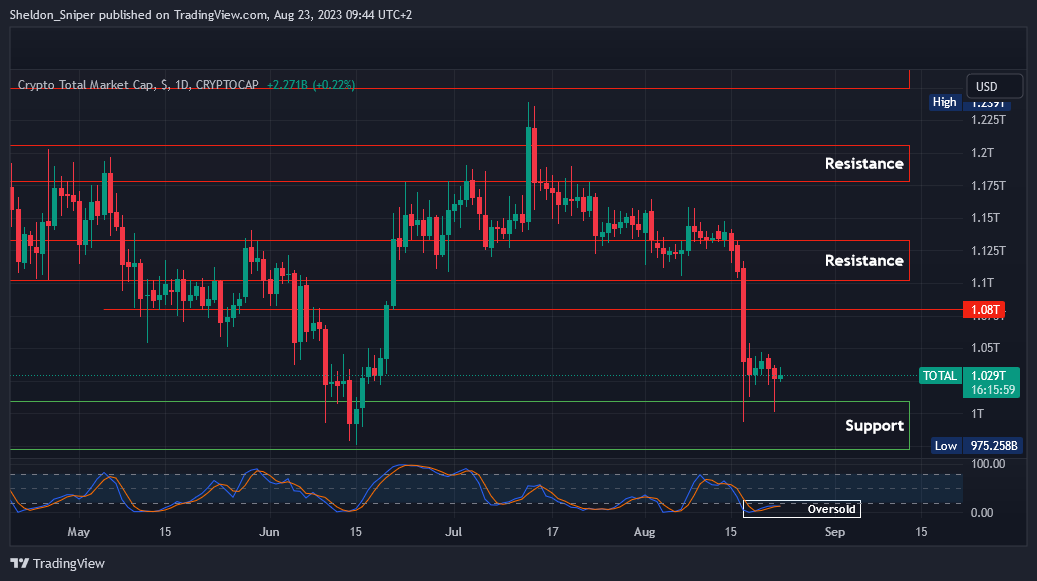
For the second time in the past week, the Total Crypto Market has retraced down to the $1T mark, a level that seemingly attracts considerable buying interest.
The market saw a move up overnight, currently standing at $1.03T. Given that it is oversold, I anticipate a relief bounce soon, potentially testing the next resistance level at $1.08T, or even pushing towards the $1.1T - $1.13T resistance zone.
Should the market continue its retracement, the subsequent support level after $1T rests at $975B, a region last visited in June.
Sign-up and trade on Bybit today.
Exclusive $30,000 deposit rewards and bonuses up for grabs!
Chart #2 - Bitcoin (BTCUSD) 4-Hour Chart
Chartist: Kyle
(For the chart screenshot, click here.)
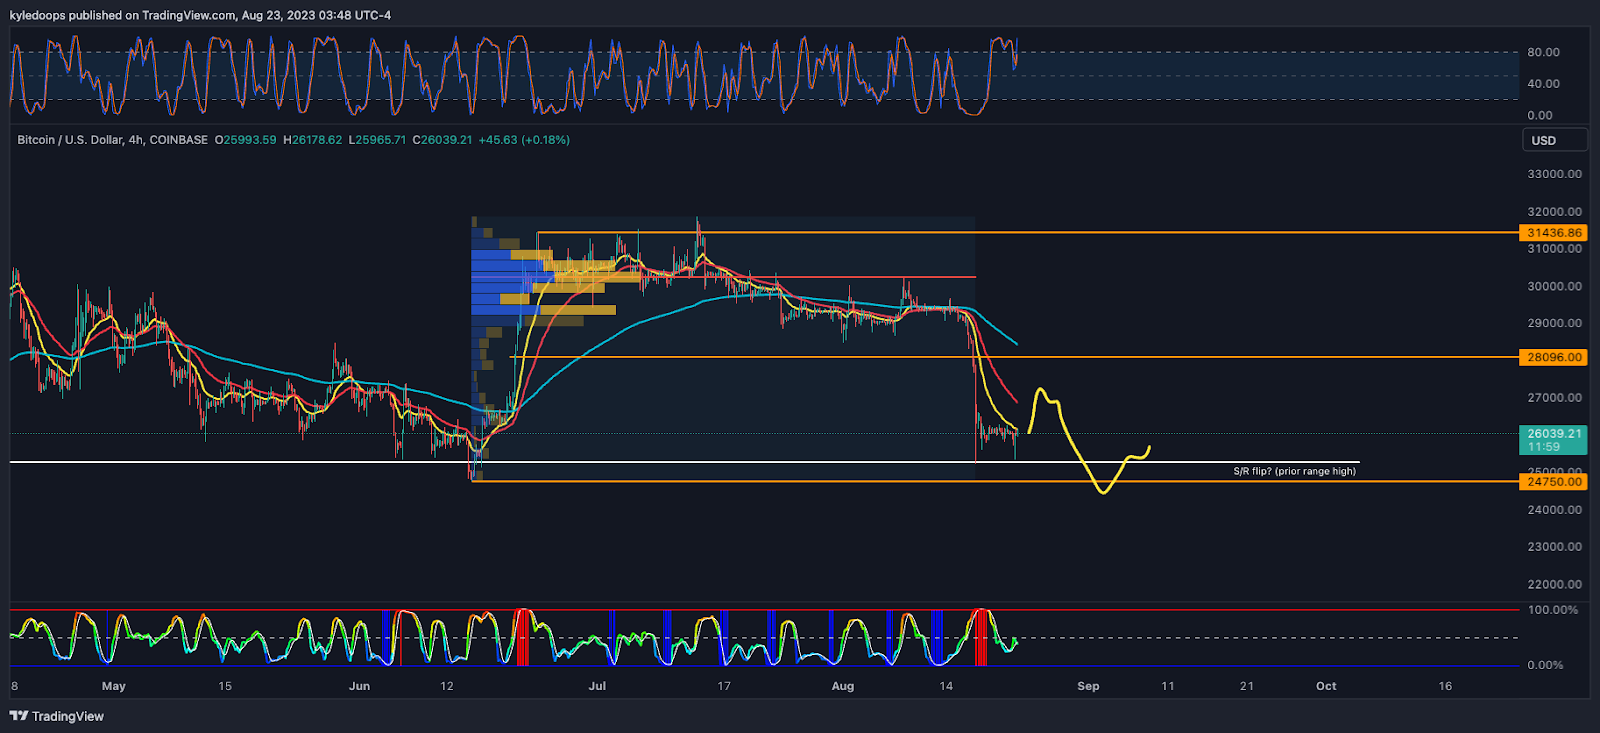
Bitcoin is still in a tight range following the sell-off.
The plan remains the same: a potential push up to $27,200 and then we watch for another move to the downside.
Sweeping the lows at $24,750 is still possible to take the lows out. Then we will re-evaluate.
𝗣𝗿𝗶𝗺𝗲 𝗫𝗕𝗧
Sign up for a new Trading Account on Prime XBT!
Receive a deposit bonus of up to $7,000 with promo code: KyleDoops
Chart #3 - U.S. Dollar (DXY) Daily Chart
Chartist: Kyle
(For the chart screenshot, click here.)
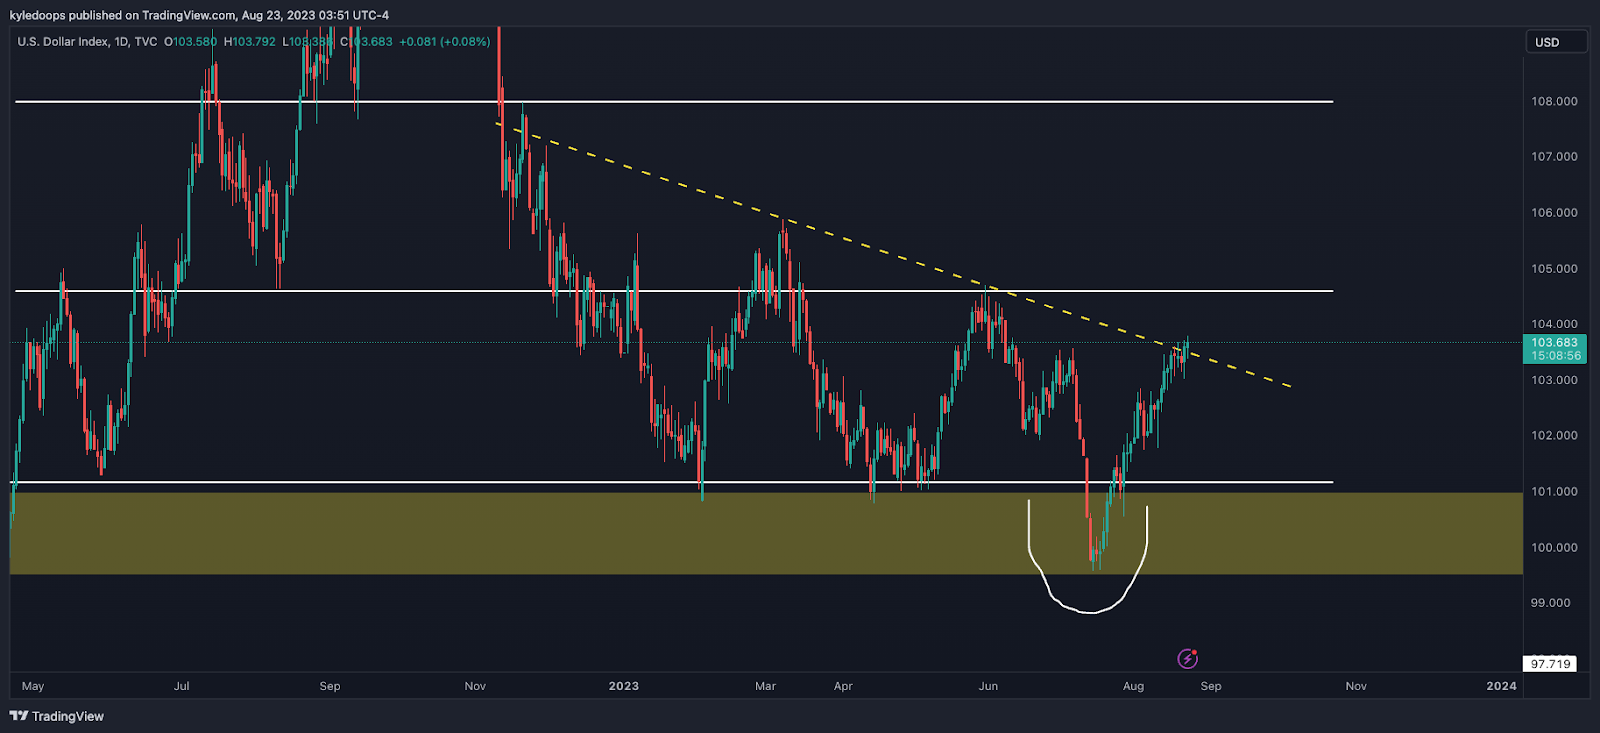
The DXY is beginning to push through its downsloping resistance level, indicating the next target is 104.6.
If the DXY breaks above 104.6, which is the mid-range, then expect it to consolidate and hold that level, eventually aiming for 107.9, the range high.
Claim your Bitget sign-up bonuses here (details below).
Chart #4 - U.S. Government Bonds 10-Year Yield (US10Y) Daily Chart
Chartist: Sheldon
(For the chart screenshot, click here.)
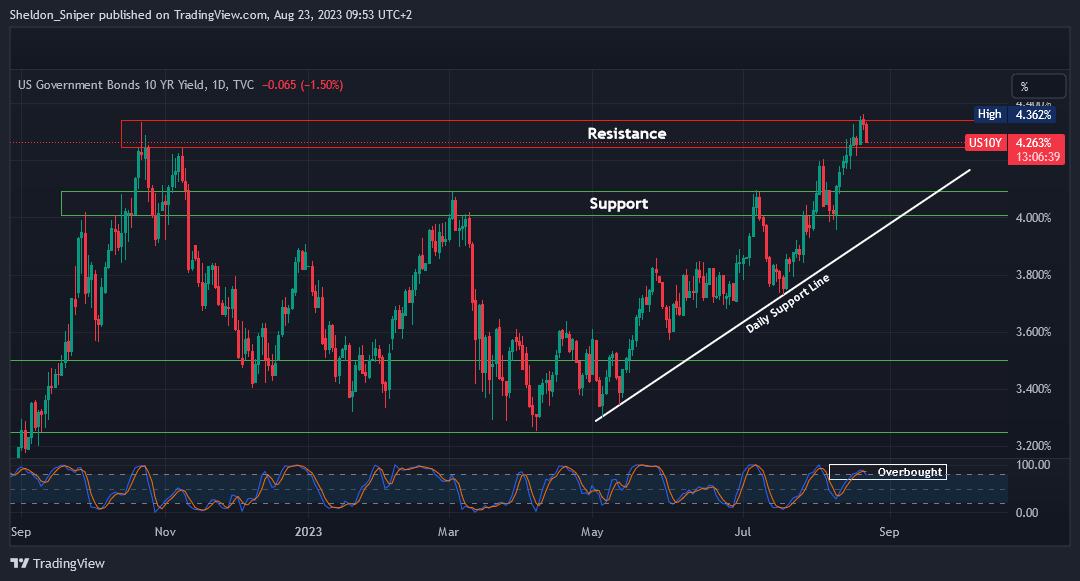
The US10Y has been in an uptrend since the beginning of May. More significantly, it broke out of the ten-month range of 3.2% - 4% at the start of August.
Since the breakout, both the US stock market and the crypto market have shown signs of a retracement. The US10Y has now reached the 4.25% - 4.30% resistance area, a zone last tested in October.
Given it’s overbought on the daily time frame, there's potential for a retracement to test the lower support areas, with the next support at 4% - 4.1%. A retracement in the 10YR Yield might offer some relief to both the US stock and crypto markets.
Claim your Bitget sign-up bonuses here (details below).
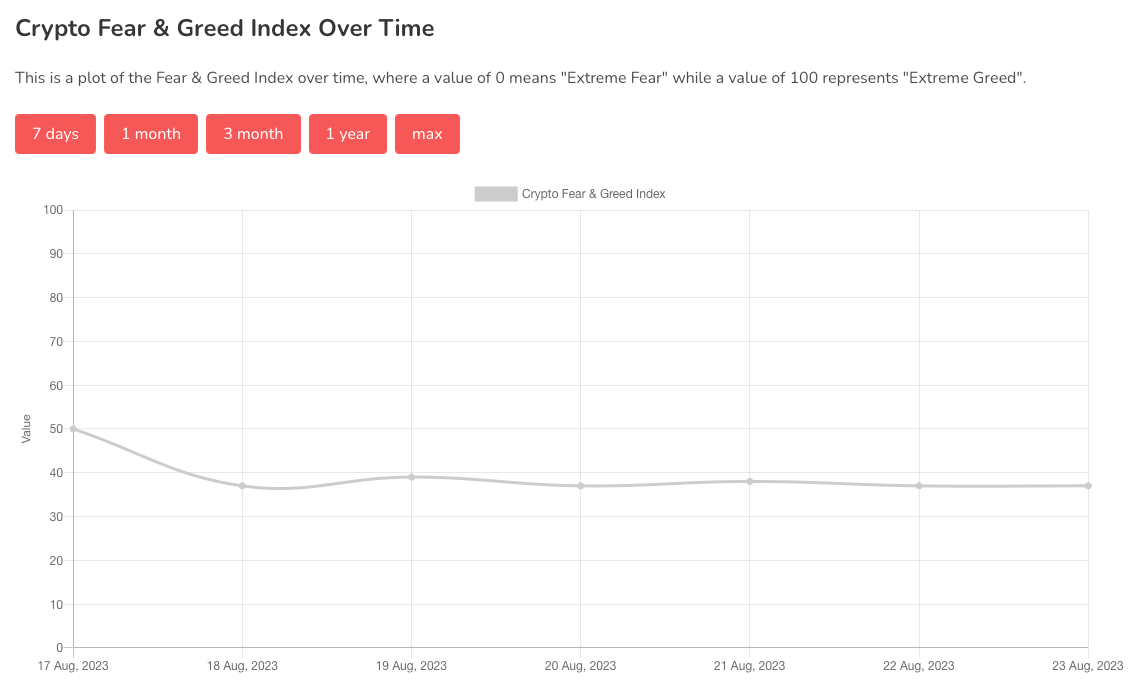
Chart #5 - Fear and Greed Index
The Fear and Greed Index is sitting at 37 today, indicating Fear.
The highest the index has been over the past seven days is 50, and the lowest is 37.
Banter’s Take
Bitcoin is reclaiming the 50 EMA on the hourly chart and attempting to recapture the very short timeframe mid-range. So, if it can maintain its position above, it might start to push up to the $27,200 level, which is the short-term target.
After the bounce, we’ll watch for signs of weakness. If there is any, the price is likely to drop sharply once again.
Stay safe my friends!
Go to our Crypto Banter Discord here where Sheldon and Kyle give updates on the charts and trades from The Daily Candle newsletter!