📈📉 Is a Massive Long Position Forming on the TOTAL3?
📈📉 Is a Massive Long Position Forming on the TOTAL3?

Chart #1 - Litecoin (LTCUSDT) 8-Hour Chart
Chartist: Sheldon

(For the chart screenshot, click here.)
LTC is consolidating within the $90 - $93 resistance zone. Given that the Litecoin halving event is still about ten weeks away, I predict there may be further upside for Litecoin ahead.
The Stochastic RSI on medium time frames is oversold, suggesting a potential for price rebound. If LTC succeeds in breaching its current resistance area, its next substantial resistance level is within the $100 - $103 range, which is also this year's high. If the price manages to break through there, the subsequent major resistance is at $140.
That’s a highly bullish scenario for LTC!
𝗣𝗿𝗶𝗺𝗲 𝗫𝗕𝗧
Sign up for a new Trading Account on Prime XBT!
Receive a deposit bonus of up to $7,000 with promo code: SheldonSniper
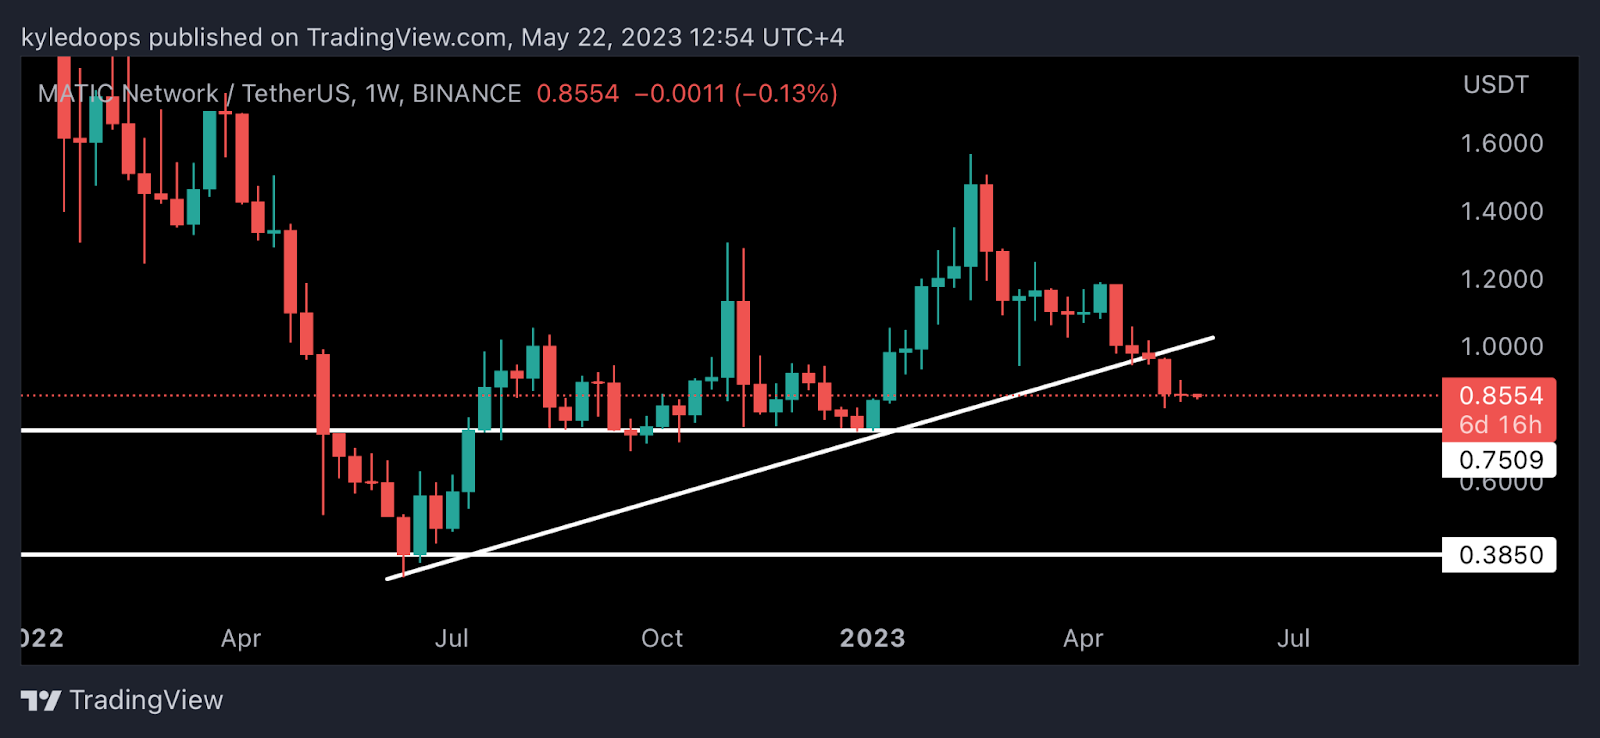
Chart #2 - Polygon (MATICUSDT) 1-Week Chart
Chartist: Kyle
(For the chart screenshot, click here.)
MATIC has been in a downtrend since peaking at its all-time high of $2.40 in May 2021.
Currently, the price has slumped below the $1 support level and is trading at $0.85. According to the weekly Relative Strength Index (RSI), we're in oversold territory, which could indicate the downtrend nearing its end. On the other hand, the weekly Moving Average Convergence Divergence (MACD) remains bearish, suggesting the potential for further price decreases.
Overall, the technical indicators offer a mixed picture, but the oversold RSI does hint at a potential upward bounce in the near future.
Here are some pivotal levels to watch:
Support: $0.85
Resistance: $1.00
Should the price break above $1.00, a rally towards $2.40 could take place. But, if the price dips below $0.85, we could see it drop to as low as $0.50.
𝗣𝗿𝗶𝗺𝗲 𝗫𝗕𝗧
Sign up for a new Trading Account on Prime XBT!
Receive a deposit bonus of up to $7,000 with promo code: KyleDoops

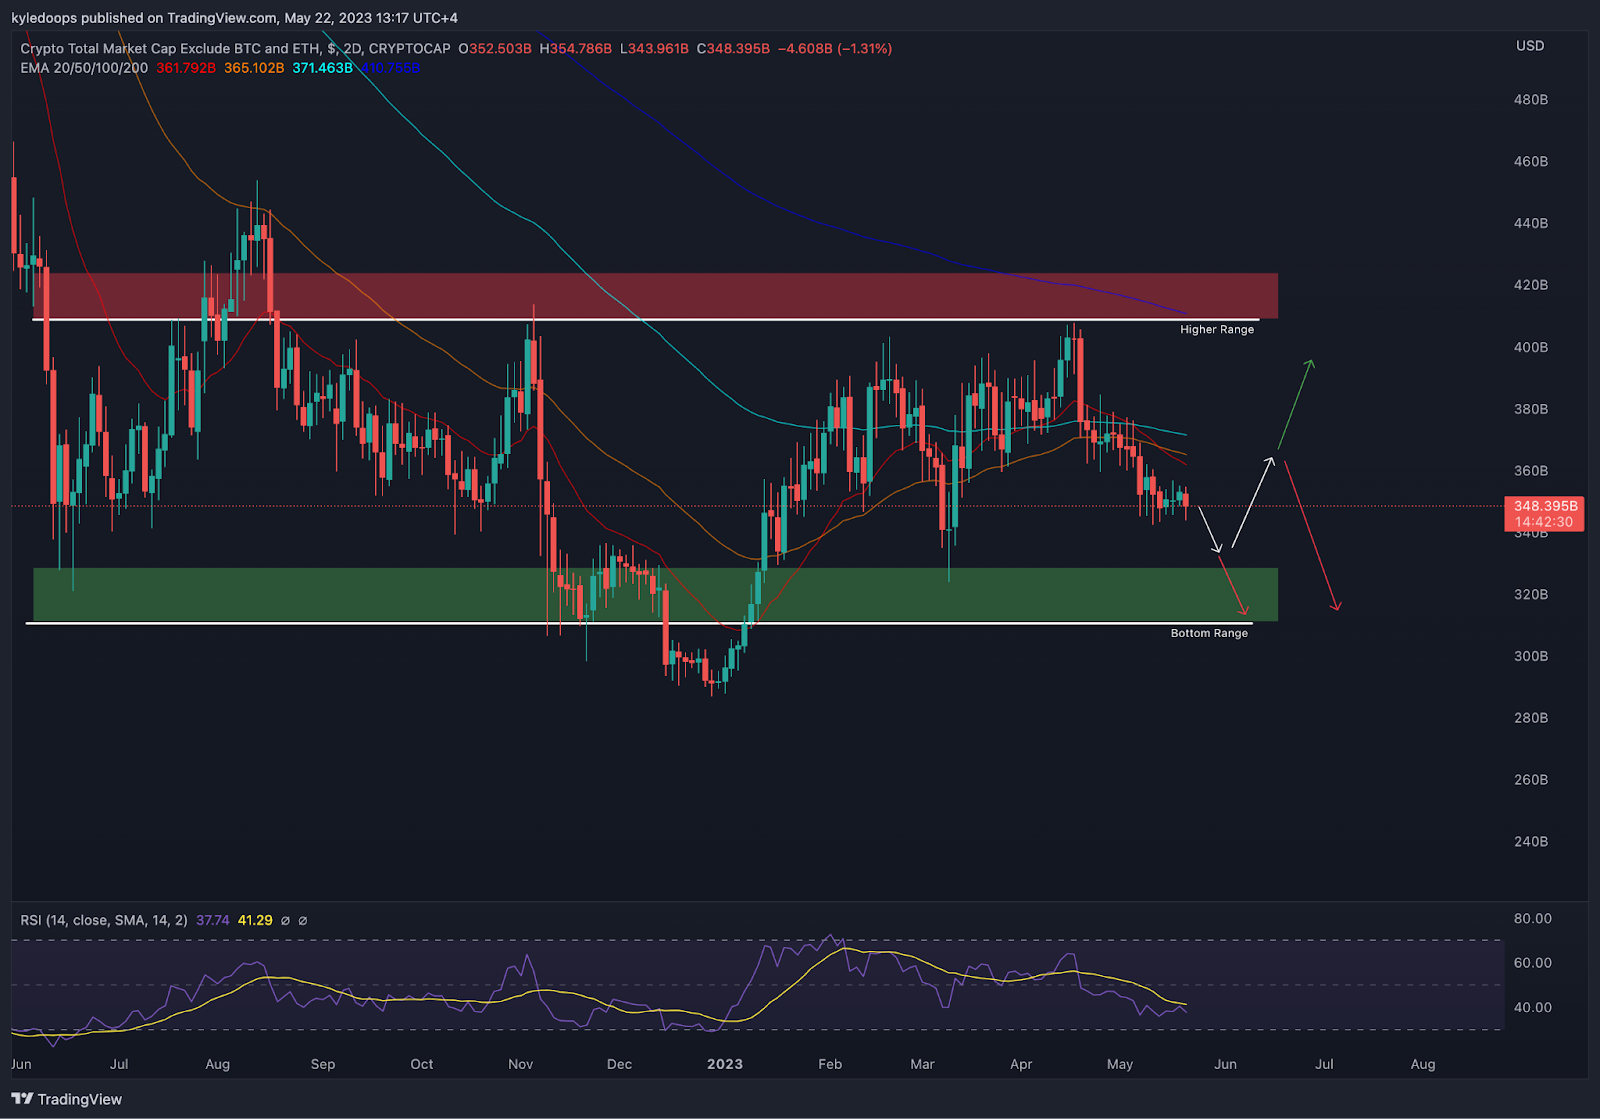
Chart #3 - TOTAL3 2-Day Chart
Chartist: Kyle
(For the chart screenshot, click here.)
The TOTAL3 on the 2-day chart is currently still range-bound but exhibits increased pressure towards the downside.
That negative pressure is intensifying as it remains stuck below all major Exponential Moving Averages (EMAs) and Moving Averages (MAs).
Should there be a break below the territory marked by the green box, it would lead to full-on capitulation for altcoins. In fact, many alts are already making new lows.
The sweep of the green box would represent the earliest possible entry point for altcoin longs, although we need to wait and observe the reaction at that level. If the reaction seems favorable, it could present an opportunity for a long position back to the range high, identified by the red box area in the chart.
Claim your Bitget sign-up bonuses here (details below).
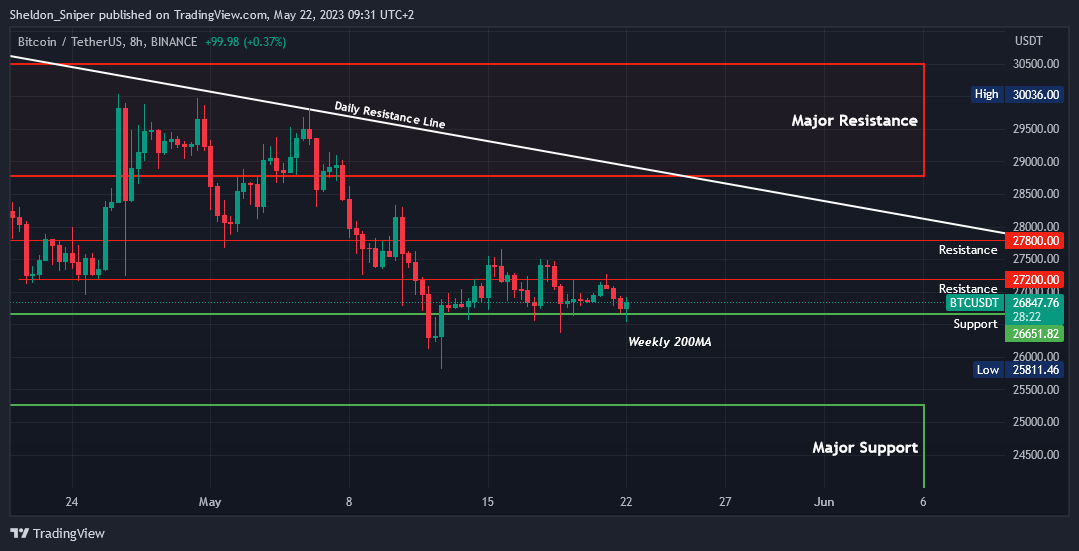
Chart #4 - Bitcoin (BTCUSDT) 8-Hour Chart
Chartist: Sheldon
(For the chart screenshot, click here.)
Over the past two weeks, bitcoin has been steadily ranging between a support level of $26,600 and a resistance level of around $27,800.
Looking at the trend of bitcoin's price action for the same months (May and June) in the previous two years suggests a possibility of it continuing its current sideways movement, or possibly declining further, in the upcoming weeks. In the meantime, many alts are bleeding as traders exit the market.
If bitcoin's value drops below its $26,600 support level, the next one is at the Weekly 200 Moving Average, at around $26,300. And there is a crucial support zone between $23,800 - $25,300.
If bitcoin manages to breach the $27,800 resistance level, the next major resistance is at $28,700, where the daily resistance line, from mid-April, is located.
Claim your Bitget sign-up bonuses here (details below).
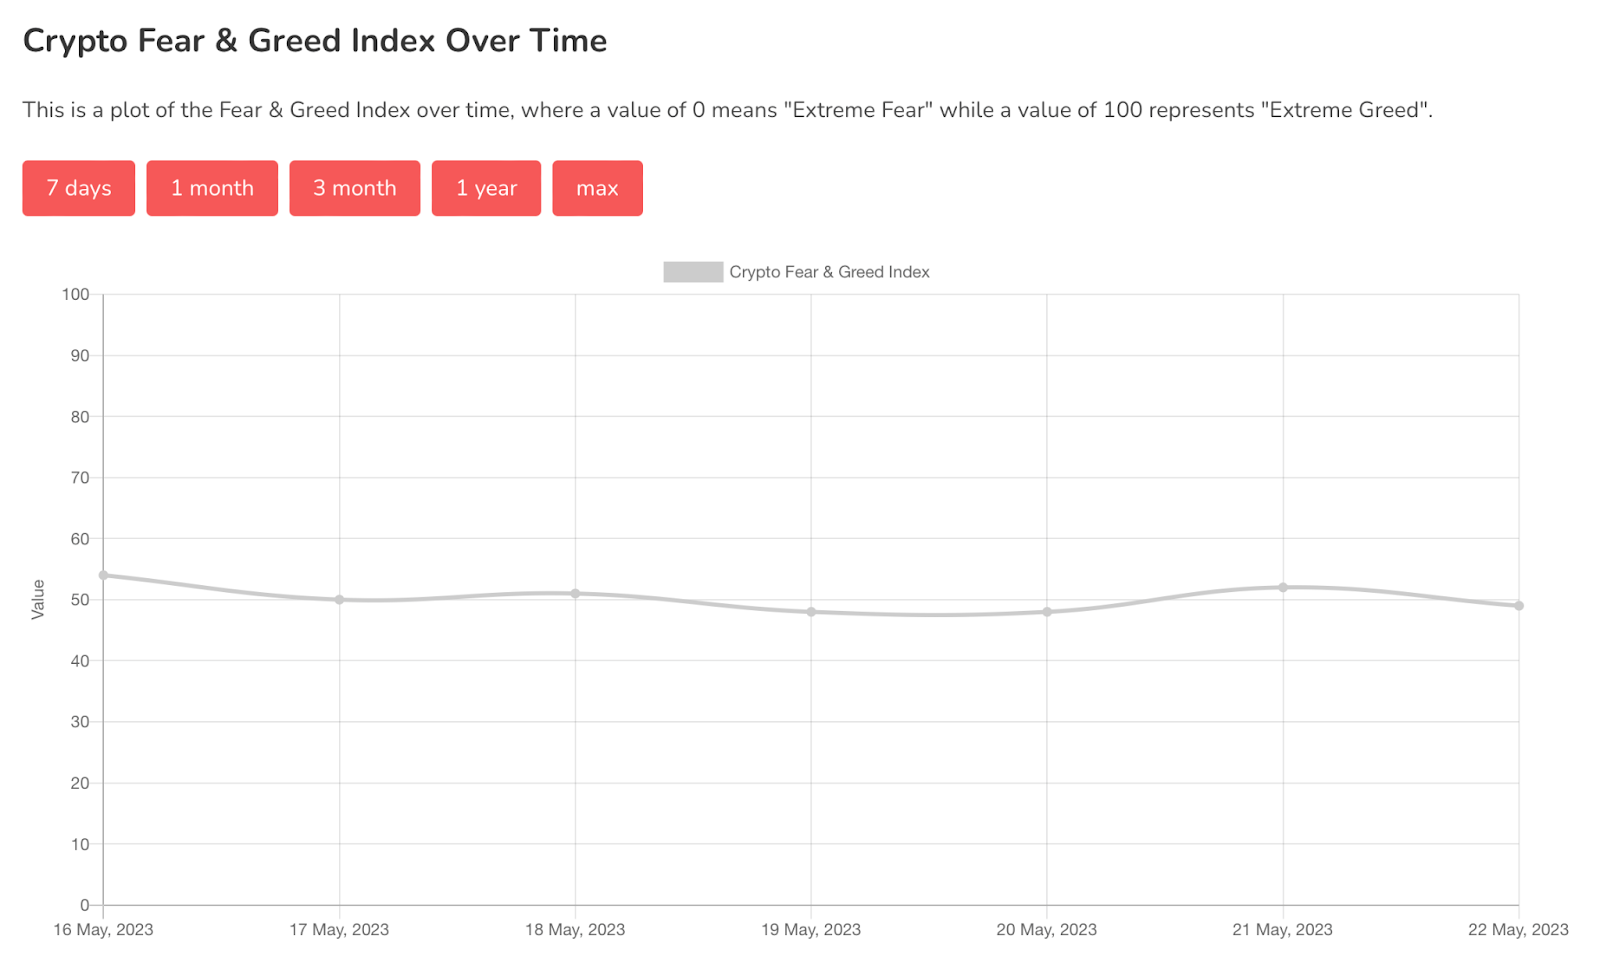
Chart #5 - Bitcoin Fear and Greed Index
The Bitcoin Fear and Greed Index is sitting at 49 today, Neutral.
The highest the index has been over the past seven days is 54, and the lowest is 48.
Banter’s Take
In the short term, the risk continues to tilt more towards the downside than the upside. On a longer timeframe, we're in a transitional phase where the price may be accumulating and slowly grinding up.
Stay safe my friends!
Go to our Crypto Banter Discord here where Sheldon and Kyle give updates on the charts and trades from The Daily Candle newsletter!
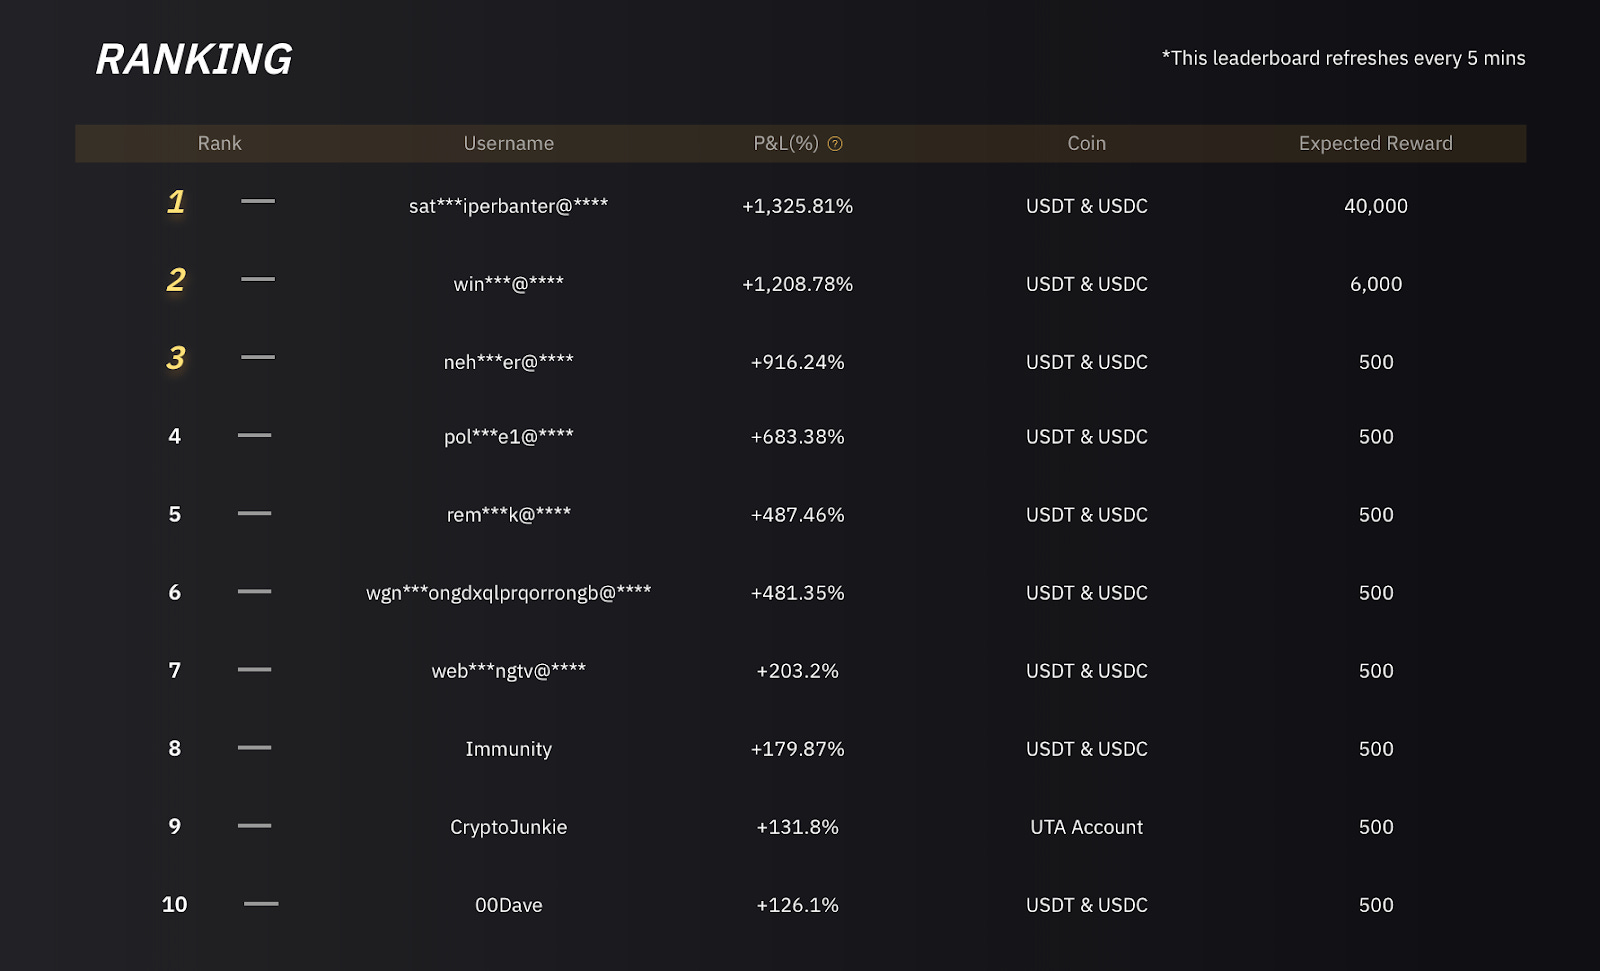
Competition Leaderboard