

📈📉 Is a Massive U.S. Dollar Crash Just Days Away?
📈📉 Is a Massive U.S. Dollar Crash Just Days Away?

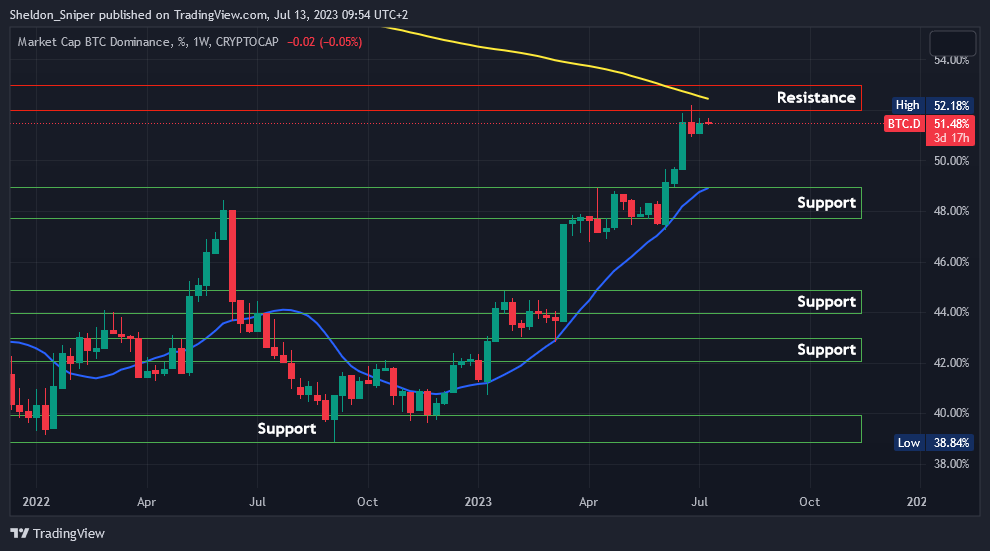
Chart #1 - Bitcoin Dominance (BTC.D) 1-Week Chart
Chartist: Sheldon
(For the chart screenshot, click here.)
Bitcoin Dominance has been on an upward move since September, rising from just below 39% to touch a two-year high of 52% at the start of this month.
BTC.D is not only at the crucial resistance zone of 52% - 53%, but the 200 weekly Moving Average (yellow line) is also acting as major resistance. We are waiting to see if BTC.D gets rejected at this level, potentially reversing the higher time frame trend, which would be highly bullish for altcoins and could lead to significant gains.
The next support zone lies between 48% - 49%, near the 100 daily Moving Average (blue line). It's worth noting that the 100 daily MA has been acting as support since the start of this year.
Sign-up and trade on Bybit today.
Exclusive $30,000 deposit rewards and bonuses up for grabs!
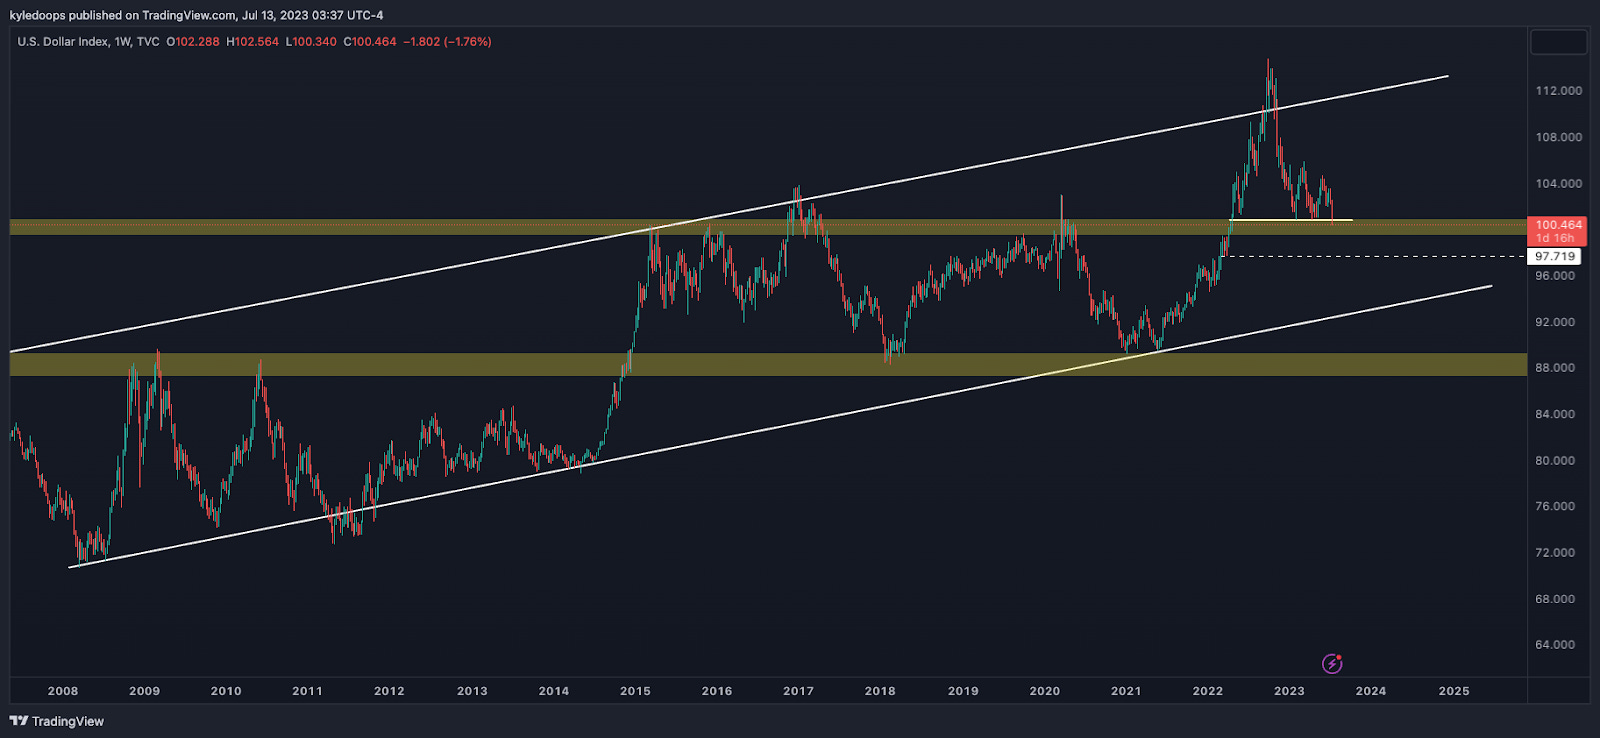
Chart #2 - U.S. Dollar (DXY) 1-Week Chart
Chartist: Kyle
(For the chart screenshot, click here.)
The DXY is experiencing a breakdown below a critical level, specifically 100.987.
If it fails to rebound above this point, it's likely to lead to lower prices.
The DXY has been oscillating within a parallel channel for a considerable period, and a breakdown could potentially drive it down to 92.3, which corresponds to the upward sloping trend line.
𝗣𝗿𝗶𝗺𝗲 𝗫𝗕𝗧
Sign up for a new Trading Account on Prime XBT!
Receive a deposit bonus of up to $7,000 with promo code: KyleDoops

Sign up for a new Trading Account on Prime XBT!
Receive a deposit bonus of up to $7,000 with promo code: SheldonSniper
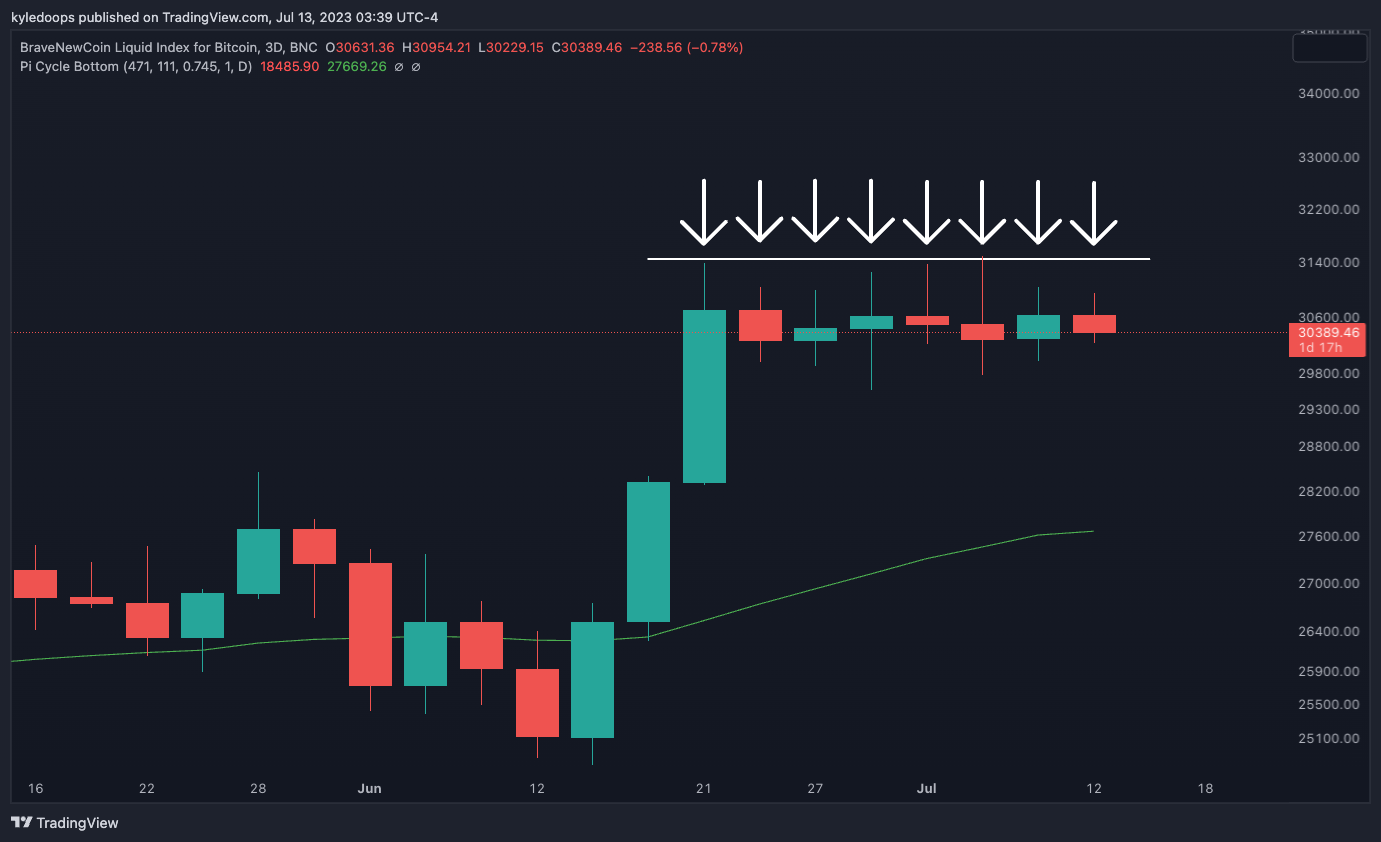
Chart #3 - Bitcoin 3-Day Chart
Chartist: Kyle
(For the chart screenshot, click here.)
Bitcoin has been in a consolidation phase for 21 consecutive days, marking what could be a record number of spinning top candles.
Spinning tops are indecision candles. Until the price breaks and closes above $31,450, no clear direction can be confirmed.
However, bulls appear to be absorbing the price action, while bears seem unable to drive the price down.
Claim your Bitget sign-up bonuses here (details below).
Chart #4 - Litecoin (LTCUSDT) 1-Day Chart
Chartist: Sheldon

(For the chart screenshot, click here.)
On Monday, LTC dipped into the $90 - $93 support zone, before reversing its trend within the same day.
It is currently trading within the $100 - $102 resistance zone.
The LTC halving will happen in the first week of August, so there's potential for one more upward price push. If the $102 resistance level is breached, we could see a further 10% move towards the next resistance zone at $110 - $115. And if that level is also broken, it could head to $140.
Claim your Bitget sign-up bonuses here (details below).
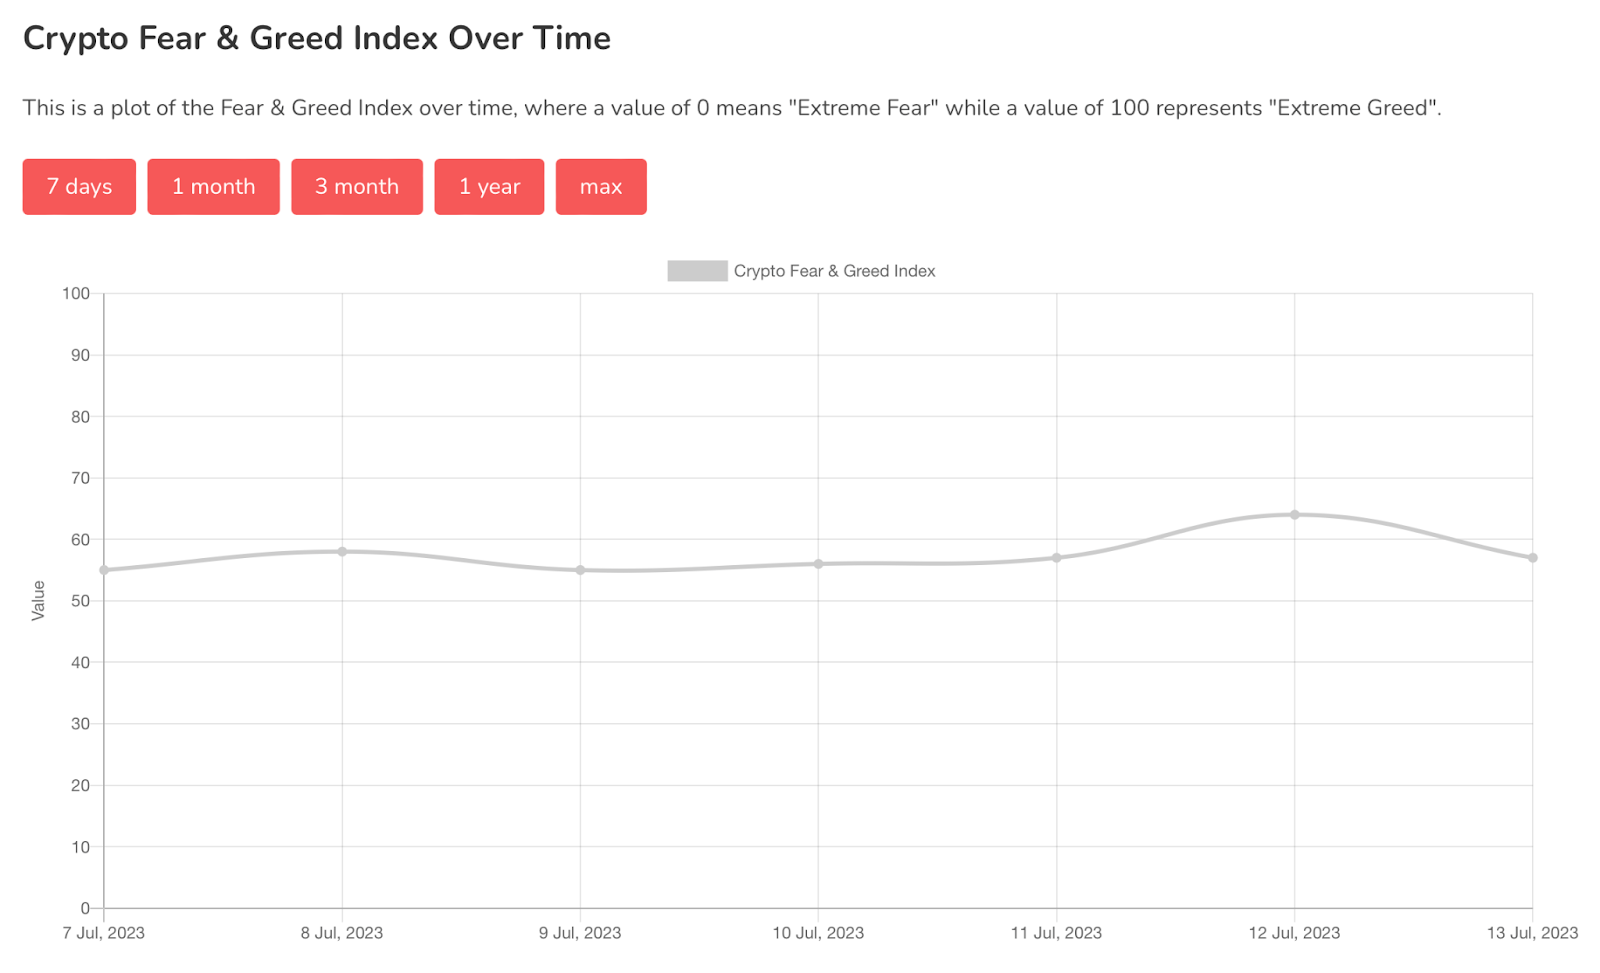
Chart #5 - Bitcoin Fear and Greed Index
The Bitcoin Fear and Greed Index is sitting at 57 today, indicating Greed.
The highest the index has been over the past seven days is 64, and the lowest is 55.
Banter’s Take
If bitcoin gets to $28,500, it's likely a buy-the-dip opportunity.
Until then, the consolidation will continue, and I would still air on the side of bullishness.
Stay safe my friends!
Go to our Crypto Banter Discord here where Sheldon and Kyle give updates on the charts and trades from The Daily Candle newsletter!