

📈📉 Is Bitcoin Headed Below $29K Again?
📈📉 Is Bitcoin Headed Below $29K Again?

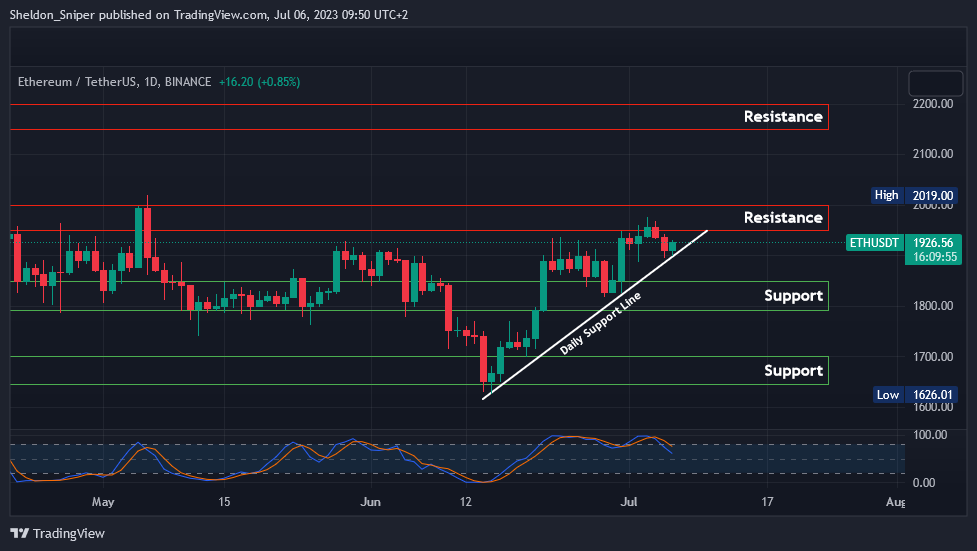
Chart #1 - Ethereum (ETHUSDT) 1-Day Chart
Chartist: Sheldon
(For the chart screenshot, click here.)
ETH was rejected at just below $2,000 and has begun to retrace.
It's currently trading at $1,925. The daily ascending support line, originating from mid-June, is currently acting as support. However, I believe there could possibly be further downside over the next week, which may lead the price to test the next areas of support, the major one being at $1,800 - $1,850.
On the upside, if the price can break through the $1,950 - $2,000 level, then the next area of resistance lies at $2,150. It's worth noting that the BTC dominance chart on higher time frames is currently overbought. If the crypto market maintains its current bullish trend, I would expect capital to start moving out of BTC and into major altcoins like ETH over the next couple of weeks.
Sign-up and trade on Bybit today.
Exclusive $30,000 deposit rewards and bonuses up for grabs!
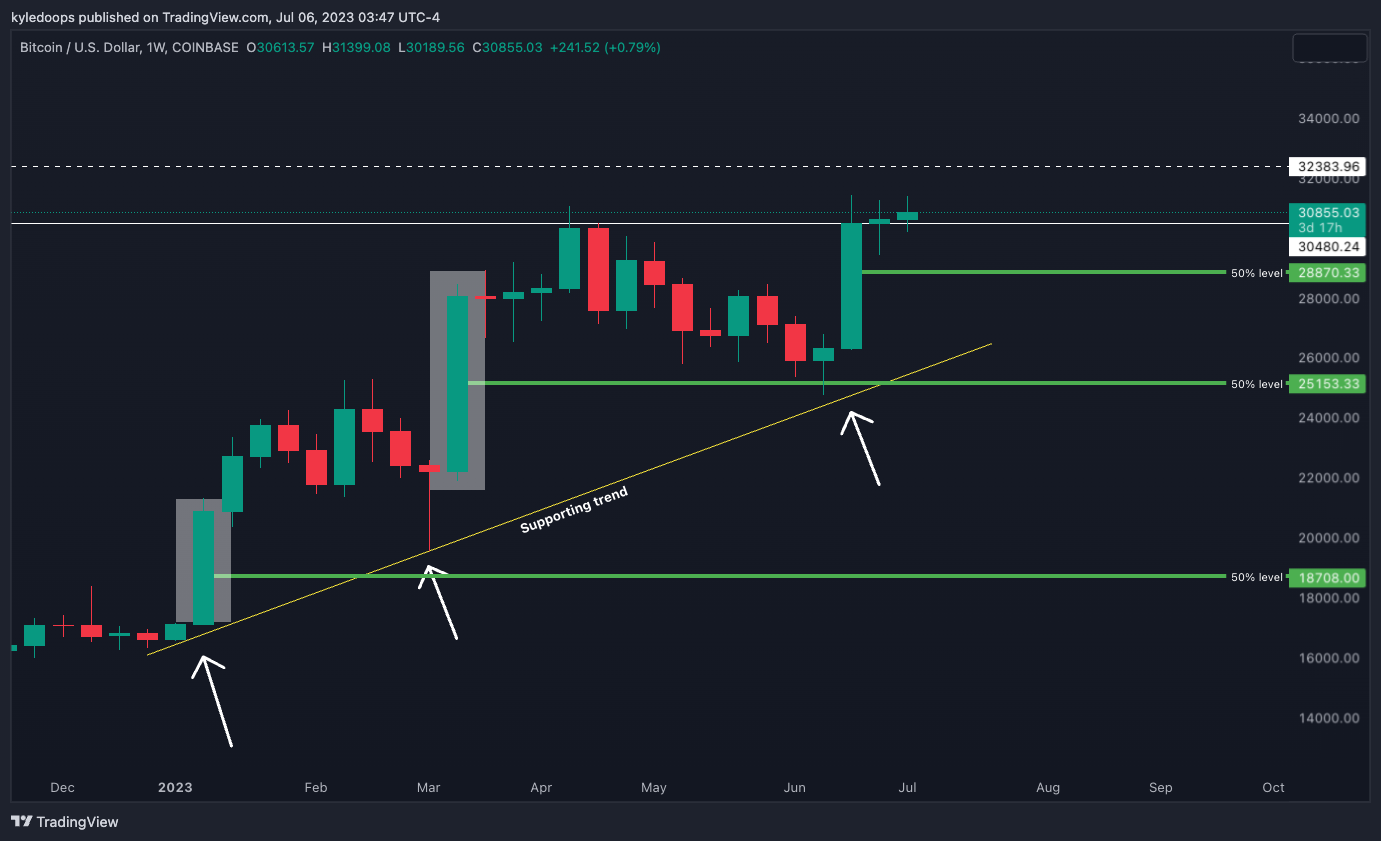
Chart #2 - Bitcoin (BTCUSD) 1-Week Chart
Chartist: Kyle
(For the chart screenshot, click here.)
Bitcoin's previous weekly pumps were followed by a retracement of the weekly candle by 40-50%. If this pattern repeats, we could potentially see a drop to around $28,870.
However, there are absolutely no guarantees that this pullback will occur. If it does, though, I would view it as an opportunity to place additional bids. That's because the overall structure remains intact, with consistent higher highs and higher lows.
And Bitcoin remains on track to establish a new swing high.
𝗣𝗿𝗶𝗺𝗲 𝗫𝗕𝗧
Sign up for a new Trading Account on Prime XBT!
Receive a deposit bonus of up to $7,000 with promo code: KyleDoops

Sign up for a new Trading Account on Prime XBT!
Receive a deposit bonus of up to $7,000 with promo code: SheldonSniper
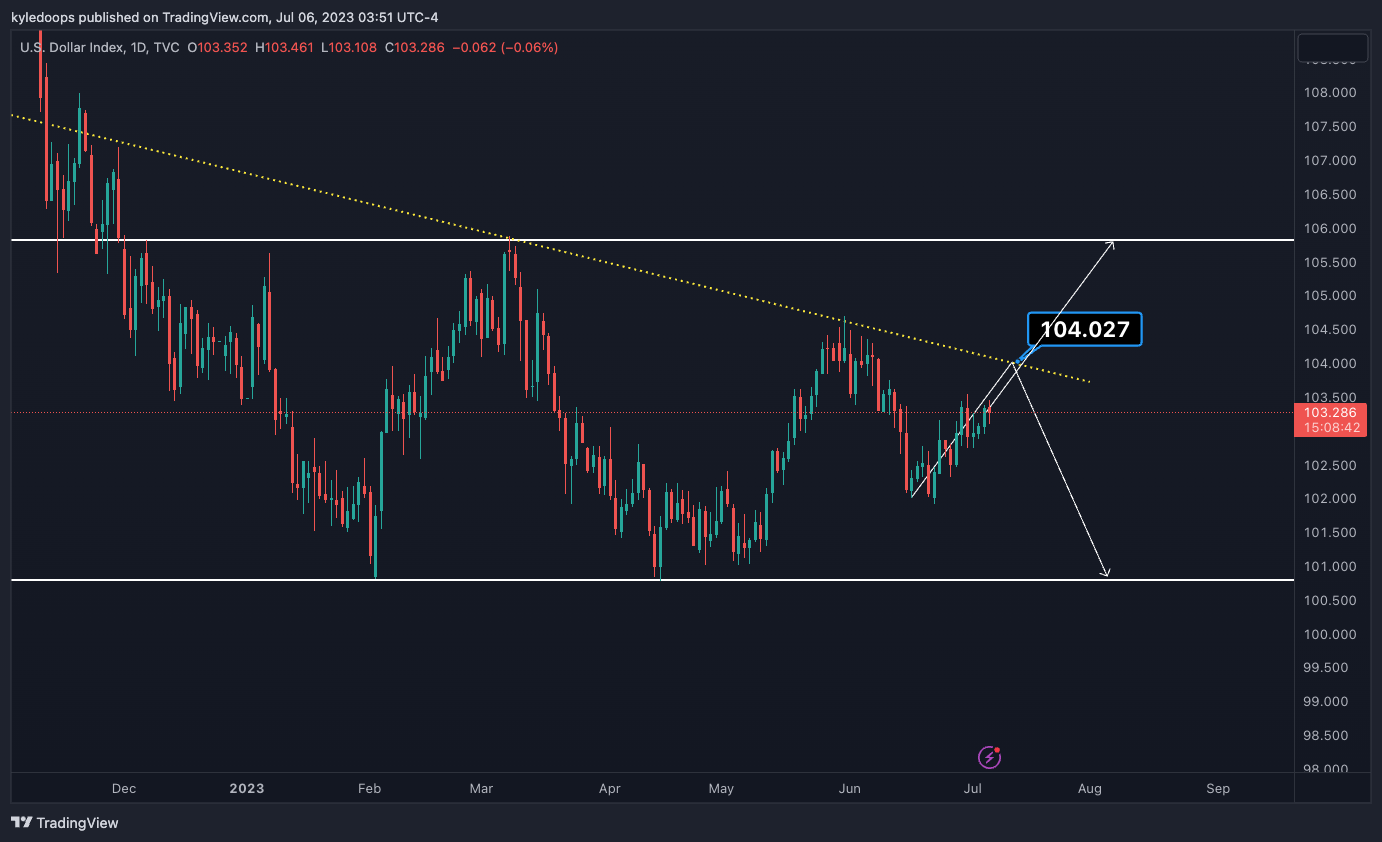
Chart #3 - U.S. Dollar (DXY) 1-Day Chart
Chartist: Kyle
(For the chart screenshot, click here.)
The DXY is currently approaching its downward trendline, which will serve as resistance at 104.027.
If it manages to rise above that level, then the next target is 105.8. However, if it fails to reach that level - which is more probable - then we can expect a move down to 100.8.
The next test of 100.8 will be interesting because it will mark yet another hit on that support level, which could potentially lead to a break. Generally speaking, a rising DXY correlates to a falling Bitcoin, while a falling DXY corresponds with a rising Bitcoin.
Claim your Bitget sign-up bonuses here (details below).
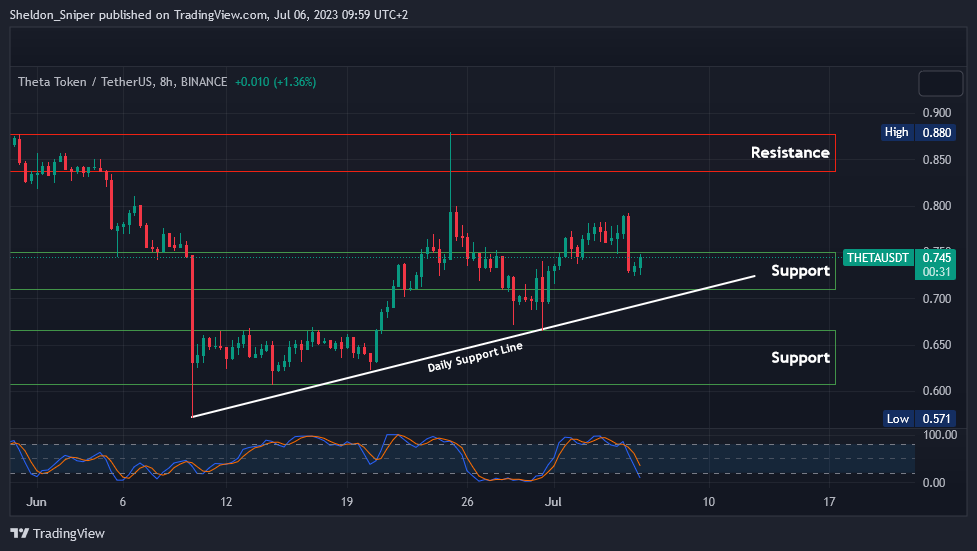
Chart #4 - Theta Network (THETAUSDT) 8-Hour Chart
Chartist: Sheldon
(For the chart screenshot, click here.)
THETA has been unable to break through the $0.80 level and appears to have started a potential retracement to lower support levels.
The price is currently trading around $0.75, having entered the first area of support between $0.71 - $0.75. The price might consolidate in this area for some time, allowing the indicators to reset.
If the current support area fails to hold, the subsequent support zone is around $0.61 - $0.66. But, if the market can maintain its bullish uptrend, I believe there's a possibility of THETA rising to test the $1 level again over the next couple of weeks.
Claim your Bitget sign-up bonuses here (details below).
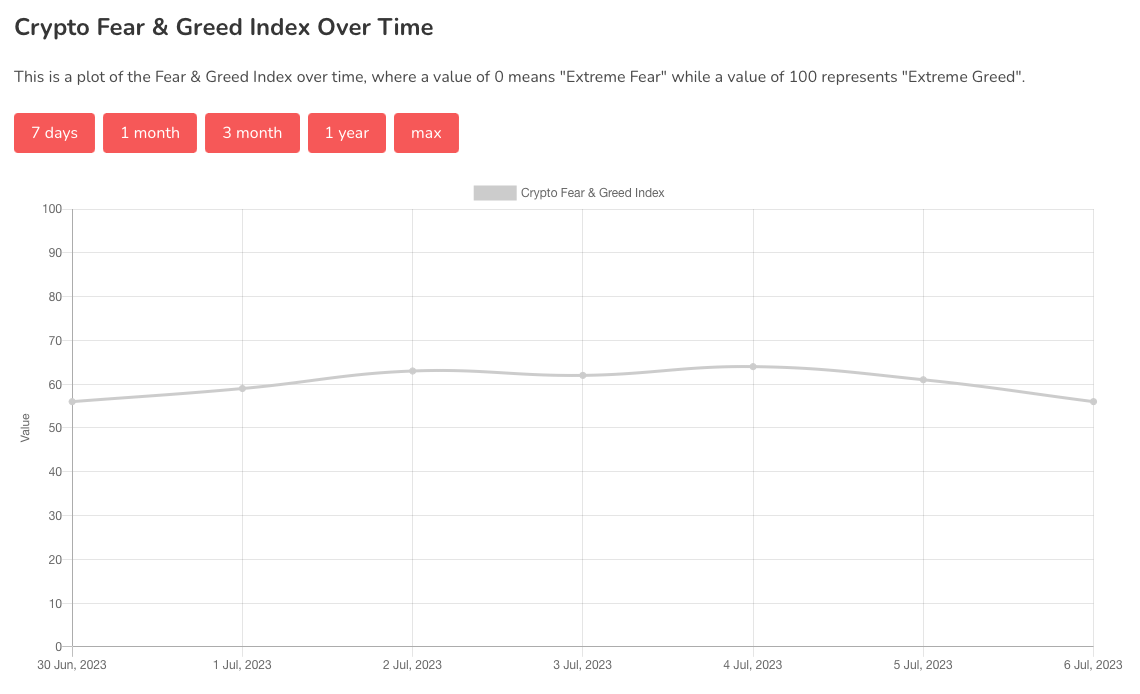
Chart #5 - Bitcoin Fear and Greed Index
The Bitcoin Fear and Greed Index is sitting at 56 today, indicating Greed.
The highest the index has been over the past seven days is 64, and the lowest is 56.
Banter’s Take
Bitcoin's next major move is likely to be upward, given that the price continues to consolidate at these levels following a significant uptrend. And that will build stronger support below.
Stay safe my friends!
Go to our Crypto Banter Discord here where Sheldon and Kyle give updates on the charts and trades from The Daily Candle newsletter!
Love your work, many thanks!