

📈📉 Is BTC Heading to $42,000?
📈📉 Is BTC Heading to $42,000?
A Wyckoff Distribution Might be in Play on ETH/BTC!
Overview
Chart #1 - Cosmos (ATOMUSDT) Daily
Chart #2 - Bitcoin (BTCUSD) Daily
Chart #3 - Ethereum to Bitcoin Ratio (ETHBTC) Daily
Chart #4 - Crypto Total Market Cap (TOTAL) 3-Day
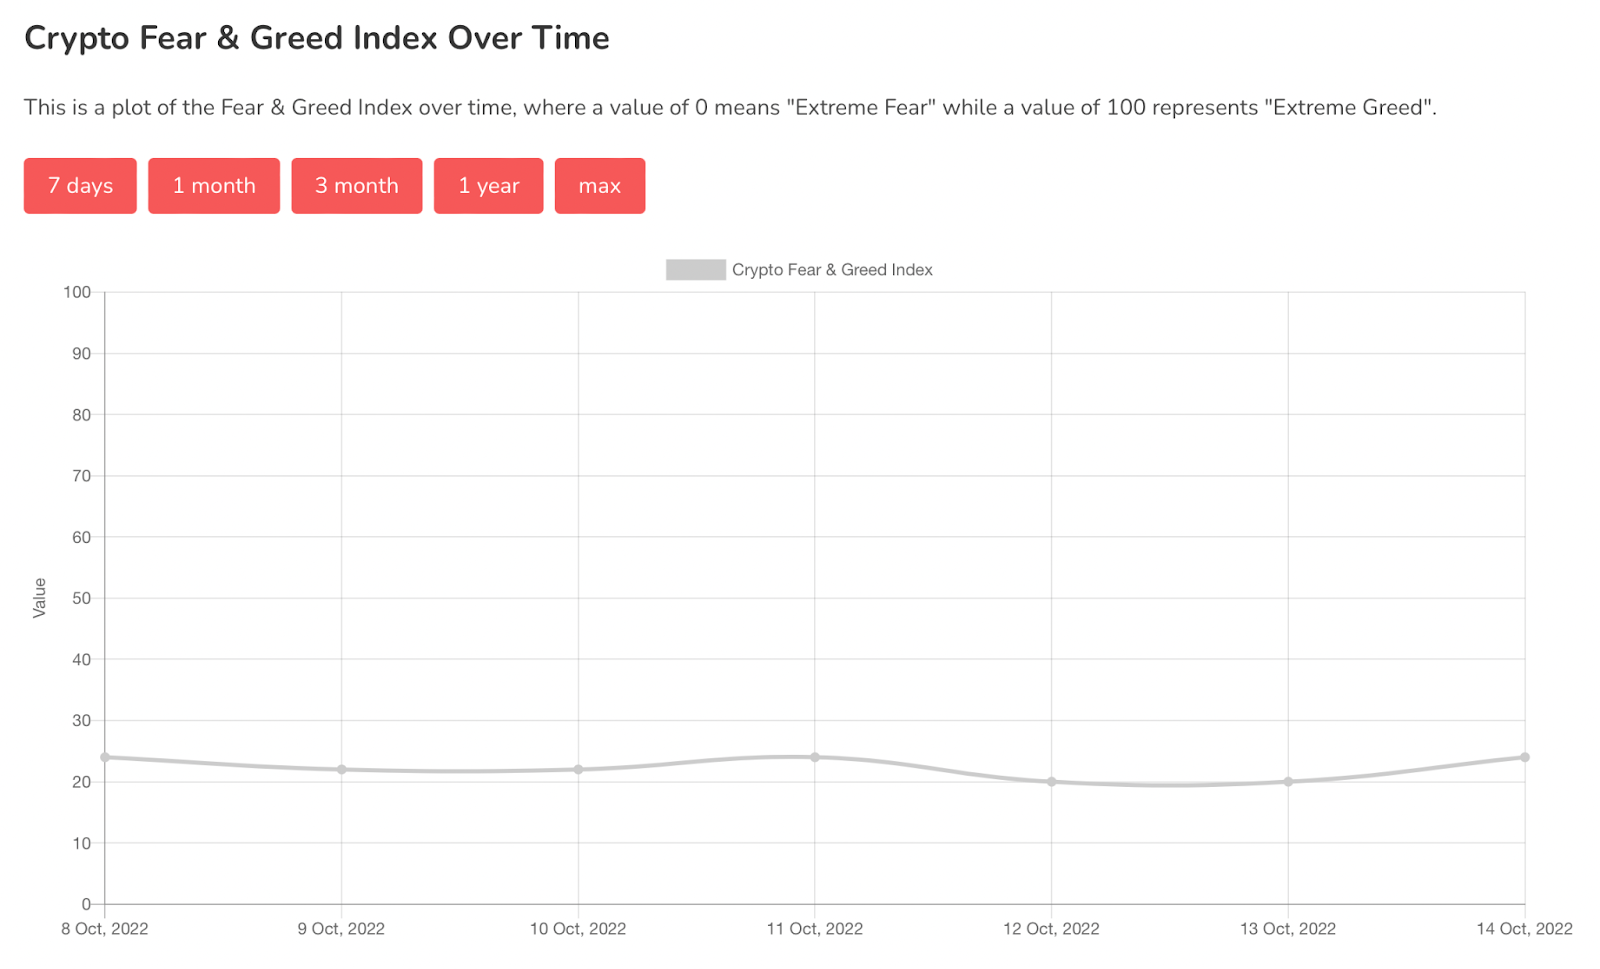
Chart #5 - Fear and Greed Index
Chart #1 - Cosmos (ATOMUSDT) Daily
Chartist: Sheldon
(For the chart screenshot, click here.)
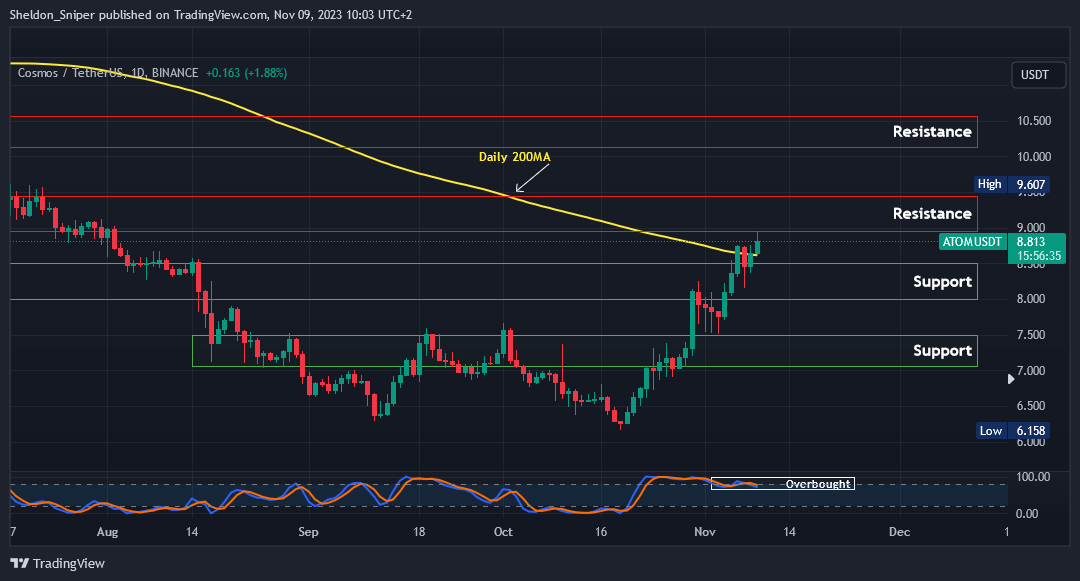
Many coins have started to reach their next areas of resistance, and that includes ATOM.
This morning, ATOM reached the $9.00 resistance level, where it faced rejection and retraced to its current trading price of around $8.80. I am monitoring ATOM to see if it can break through the $9.00 mark, turning that level into support. If that occurs, the price could rise to test the next resistance at the range high of $9.50.
Additionally, the price is currently overbought on the daily timeframe. If the price reverses from here, the next support level could be the daily 200 Moving Average at $8.60, or potentially the next support area between $8.00 and $8.50.
Sign-up and trade on Bybit today.
Exclusive $30,000 deposit rewards and bonuses up for grabs!
Chart #2 - Bitcoin (BTCUSD) Daily
Chartist: Kyle
(For the chart screenshot, click here.)
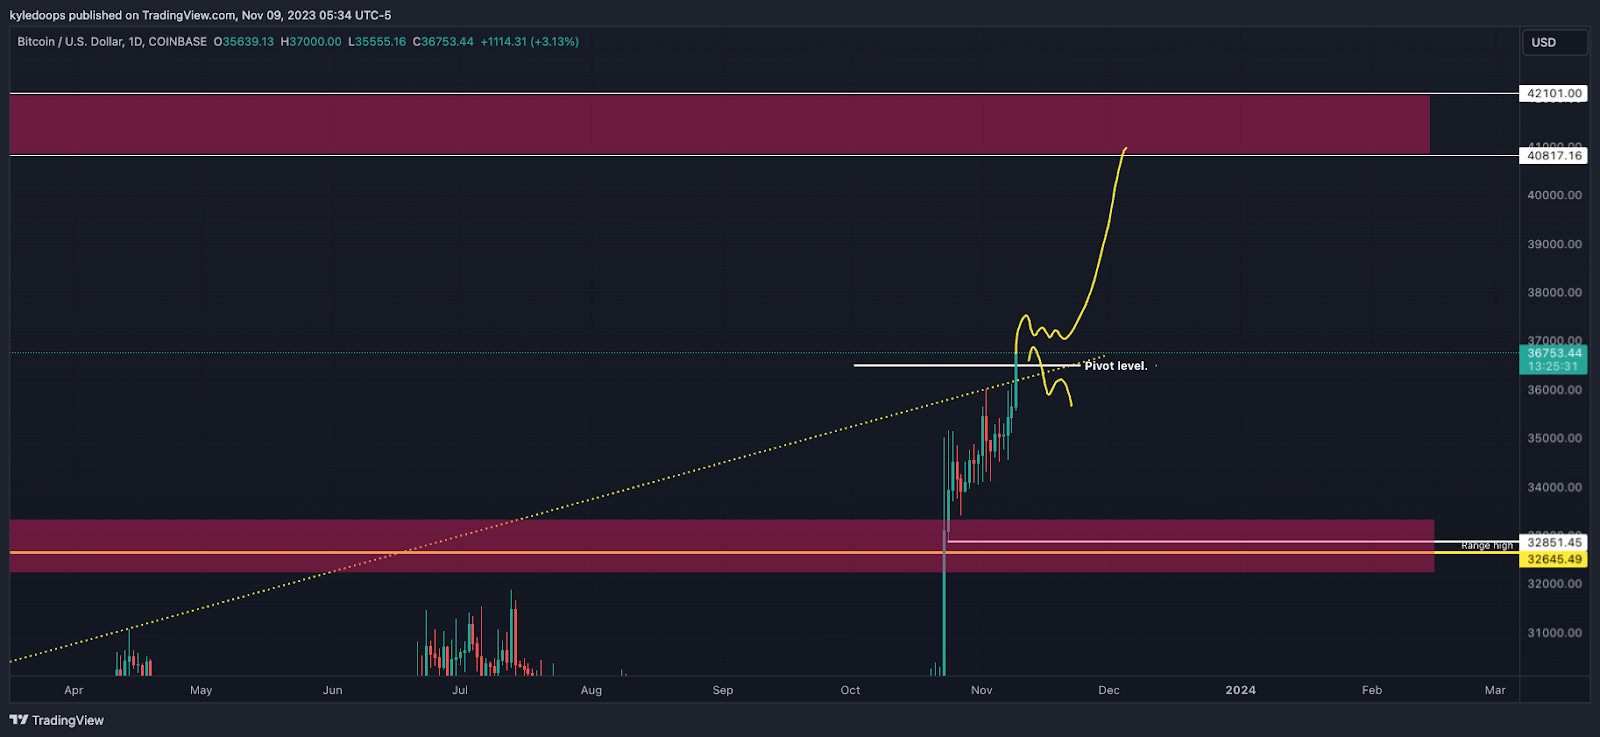
Bitcoin has reclaimed its pivot level and price could potentially open up a new range, that being between $32,600 and $42,000.
If bulls are to take control, they need to hold multiple candles above this level; if bears close a daily candle below $36,100, then we might have a swing failure pattern and lower prices could come next.
But even if those lower prices come, $32,000 should hold as support.
Claim your Bitget sign-up bonuses here (details below).

Outsmart 99% Of The Market!
Get full access into our Discord And Telegram group, where you'll find all of our premium content!
👉 Trade Signals!
👉 Trade Set-Ups!
👉 Trading Challenges!
👉 Education!
👉 SO MUCH MORE!
Chart #3 - Ethereum to Bitcoin Ratio (ETHBTC) Daily
Chartist: Kyle
(For the chart screenshot, click here.)
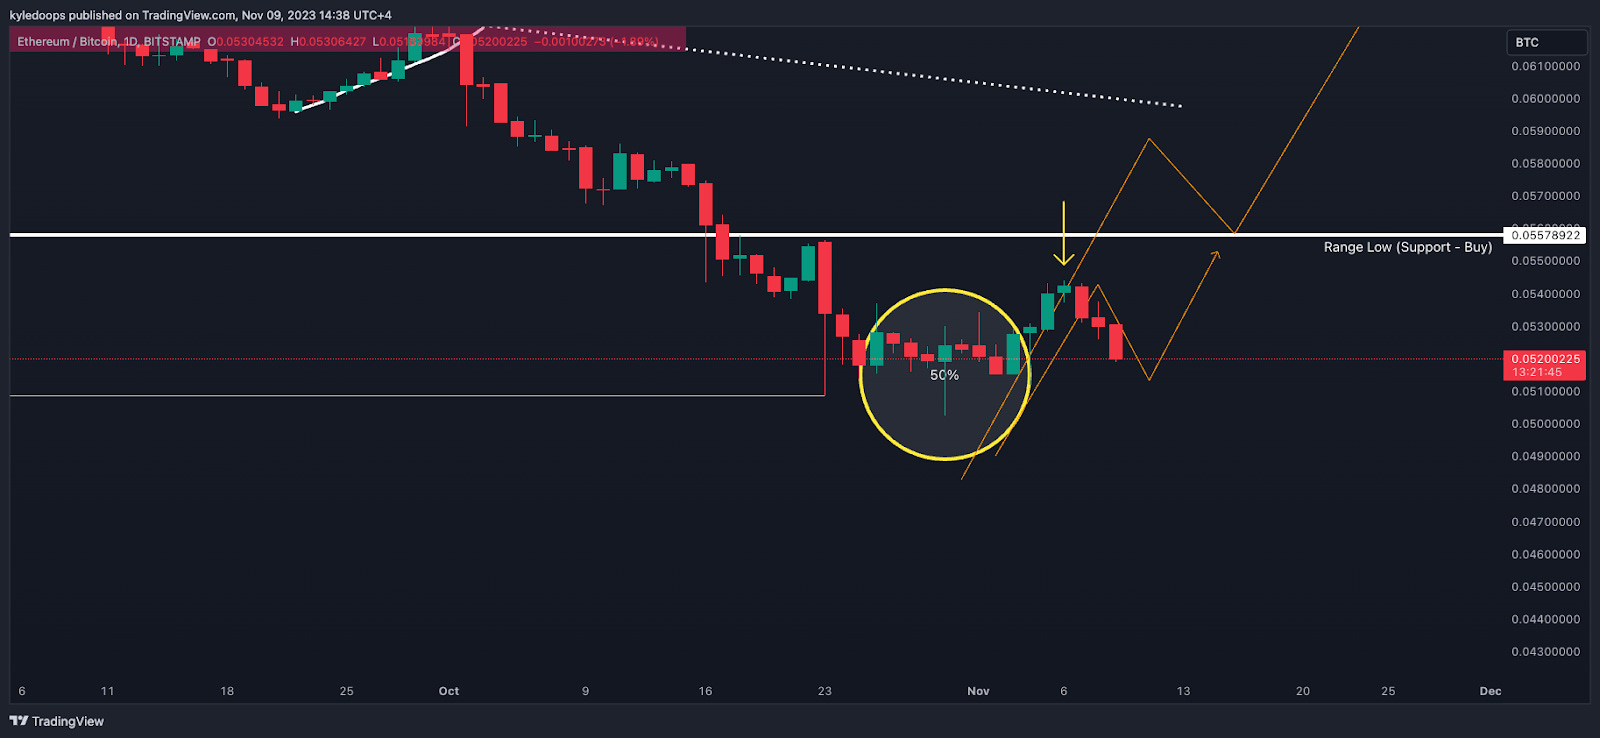
ETH/BTC has taken a turn and could be putting in its next lower high.
Bitcoin dominance is skyrocketing once again off the speculation of the Bitcoin ETFs arriving soon.
Be wary of a new swing low in ETH/BTC; if it makes a swing low, there is a chance that ETH cascades down further, which means a Wyckoff distribution could be in play.
Claim your Bitget sign-up bonuses here (details below).
Chart #4 - Crypto Total Market Cap (TOTAL) 3-Day
Chartist: Sheldon
(For the chart screenshot, click here.)
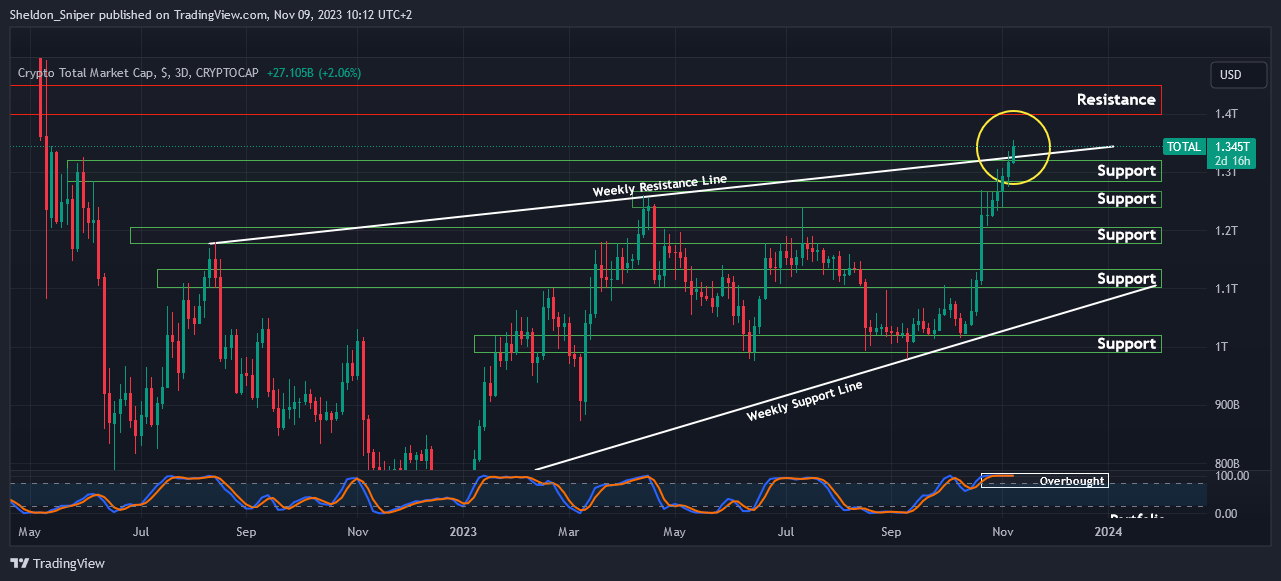
This morning, the TOTAL broke through the $1.325 trillion resistance level and the weekly resistance line that has been in place since August 2022.
If it continues its upward trend from here, the next significant resistance area is likely to be between $1.4 trillion and $1.5 trillion. Despite the market being overbought on higher timeframes, there's potential for further upside. This could be driven by a combination of traders who missed the initial move and are now entering, as well as short traders covering their stop losses, which further propels the market upward.
Claim your Bitget sign-up bonuses here (details below).

🚀 Sniper School's New Cohort Begins November 7th!
Sniper School is a free 3-week trading course led by Sheldon. Dive deep into his strategies and insights to master the art of trading. Equip yourself with the skills to capitalize on market shifts and maximize your gains.
Limited Seats! With only 3,000 seats available, our waitlist fills up rapidly! Secure Your Seat Today!
Chart #5 - Fear and Greed Index
The Fear and Greed Index is sitting at 69 today, indicating Greed.
The highest the index has been over the past seven days is 74, and the lowest is 65.
Banter’s Take
Although altcoins are pumping, we are still waiting for proper confirmation of a real TOTAL3 breakout, else it could still be a rotational game.
Stay safe my friends!
Go to our Crypto Banter Discord here where Sheldon and Kyle give updates on the charts and trades from The Daily Candle newsletter!