

Is Curve (CRV) A Buying Opportunity?
Is Curve (CRV) A Buying Opportunity?

Overview
Chart #1 - Crypto Total Market Cap (Total/USDT) Daily Chart
Chart #2 - Bitcoin (BTC/USDT) Hourly Chart
Chart #3 - Curve (CRV/USDT) Daily Chart
Chart #4 - US Dollar Index (DXY) Daily Chart
Chart #5 - Fear and Greed Index

Chart #1 - Crypto Total Market Cap (Total/USDT) Daily Chart
Chartist: Sheldon

Yesterday’s drop in the Crypto Market has resulted in the Total Market Cap dropping from $1.16T down to around $1.12T, where it has once again found support at the $1.10T - $1.13T area of support.
This area has held as support for the last six weeks. In that time, there have been several attempts by the Market to break through the next area of resistance at $1.18T - $1.2T, but it has been rejected on every occasion.
The Market is oversold on the Daily time frame, and there is a possibility of a “bounce” in this area, back to the upside, but if the current area of support does not hold, then the next major area of support is at $970B - $1T, which was last tested in the middle of June.
Sign-up and trade on Bybit today.
Exclusive $30,000 deposit rewards and bonuses up for grabs!
Chart #2 - Bitcoin (BTC/USDT) Hourly Chart
Chartist: Kyle
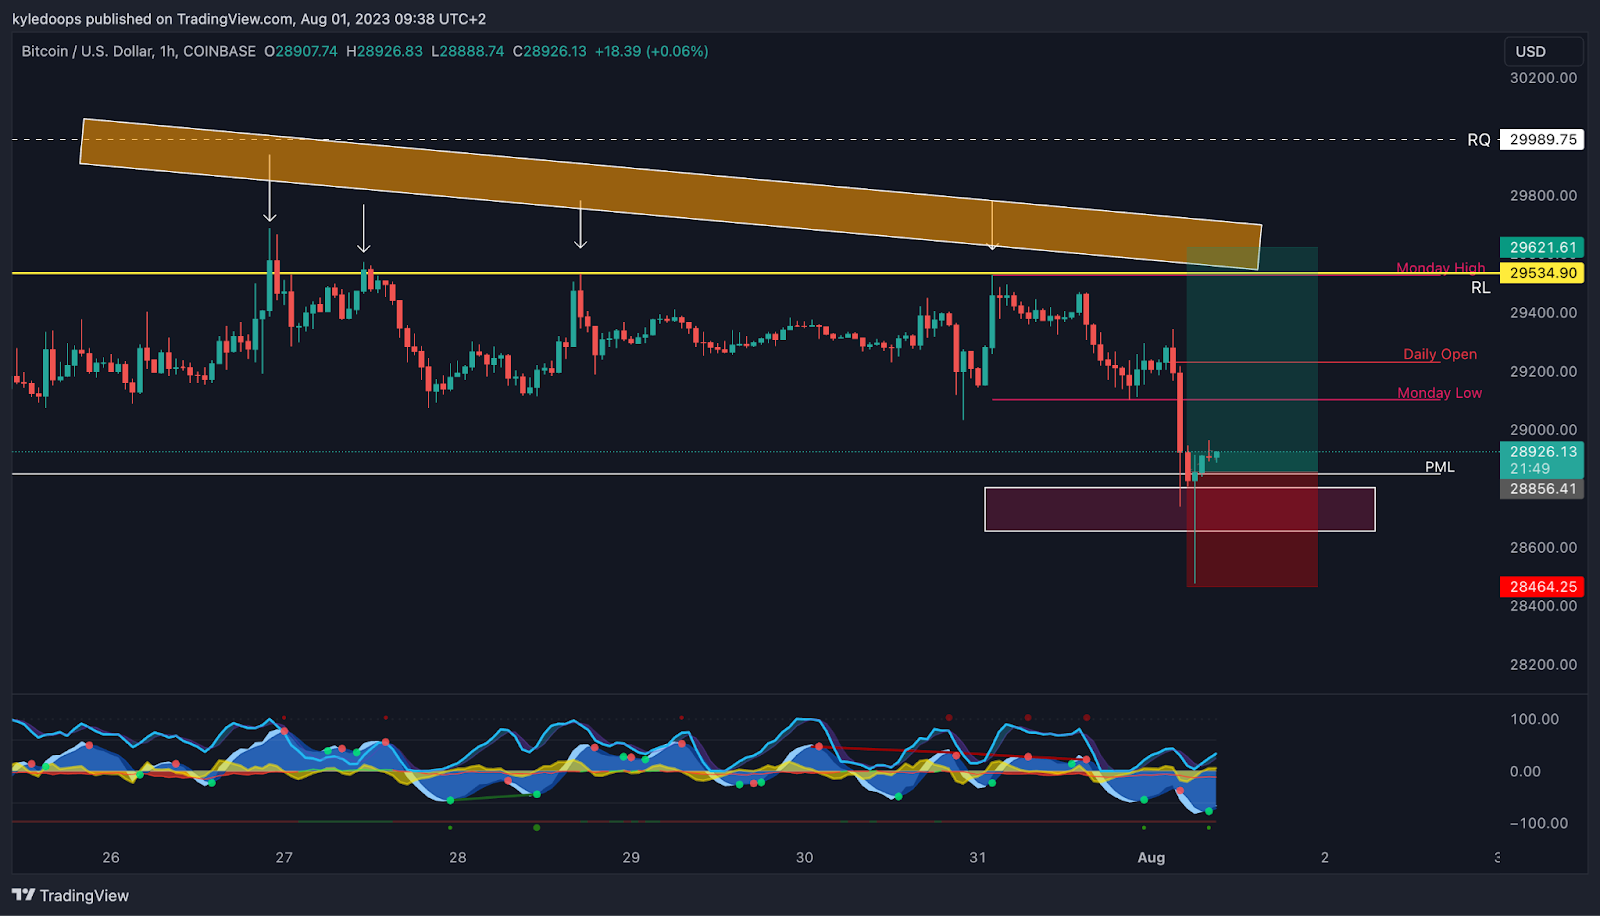
Bitcoin wicked below the previous month's low and has now reclaimed that level.
The lower liquidity was taken at $28,500 which has been a long time target.
Now that liquidity has been taken I would focus on the next liquidity zone, that being the $29,500 level.
That is the liquidity based off of the short sellers who got a very easy trade. Their invalidation would be price getting back above $30,000
𝗣𝗿𝗶𝗺𝗲 𝗫𝗕𝗧
Sign up for a new Trading Account on Prime XBT!
Receive a deposit bonus of up to $7,000 with promo code: KyleDoops

Sign up for a new Trading Account on Prime XBT!
Receive a deposit bonus of up to $7,000 with promo code: SheldonSniper
Chart #3 - Curve (CRV/USDT) Daily Chart
Chartist: Kyle
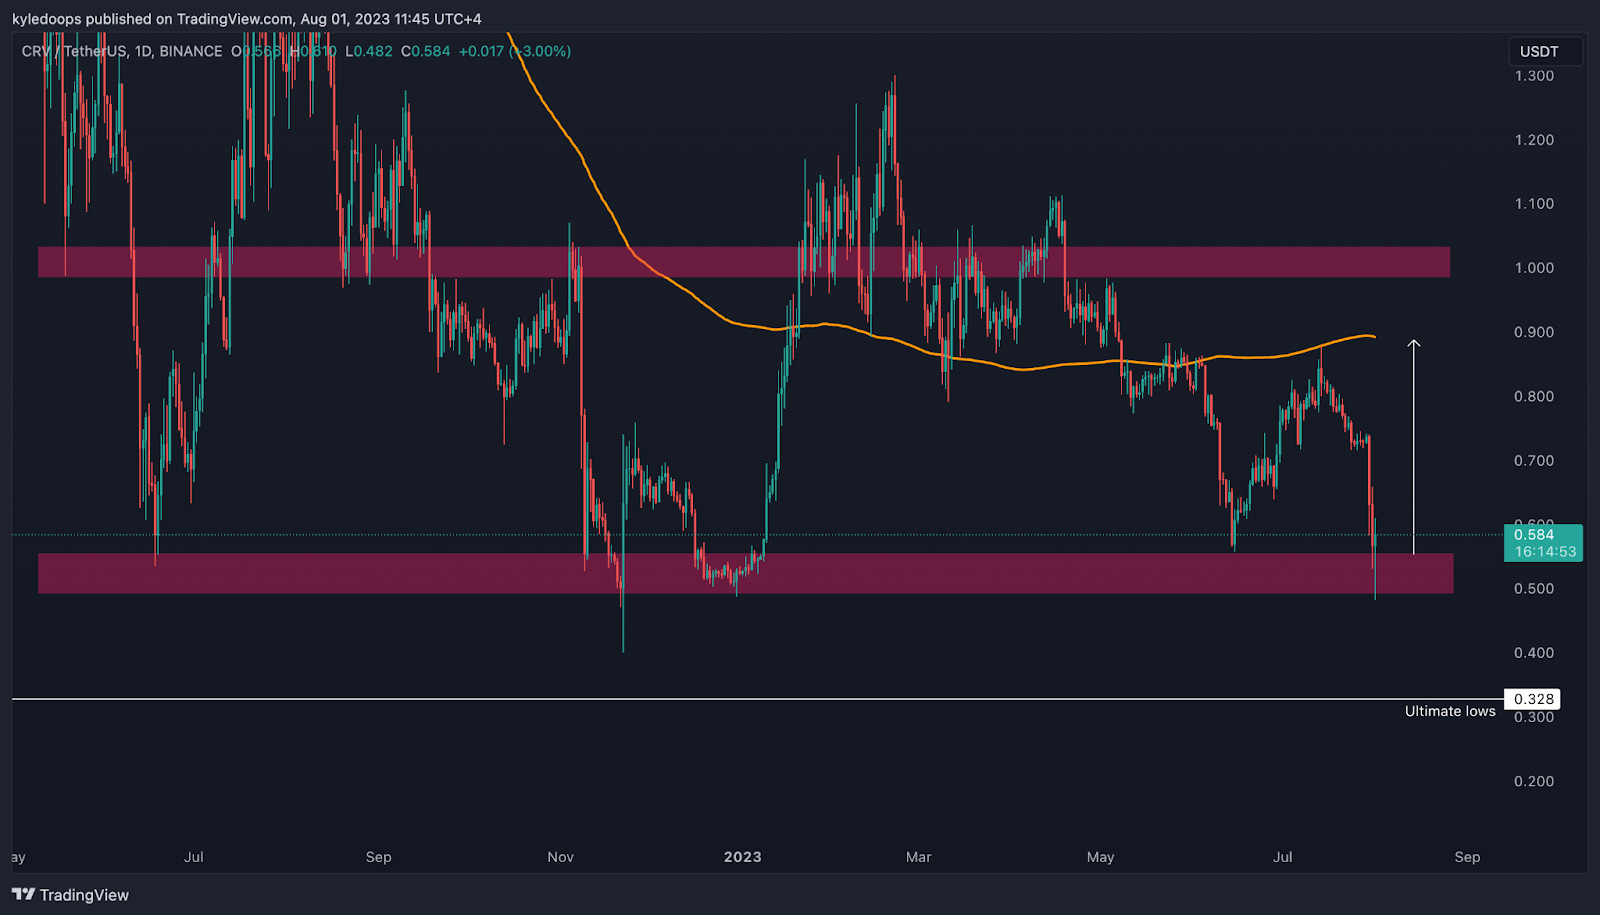
CRV has come into the range low yet again, the short trade has finally played out to the final target. Now I would be looking for price to bounce from this level.
If it does it could push up to $0.90.
A loss of the key level at $0.50 would mean that price will push down to ultimate lows at $0.32.
Claim your Bitget sign-up bonuses here (details below).
Chart #4 - US Dollar Index (DXY) Daily Chart
Chartist: Sheldon
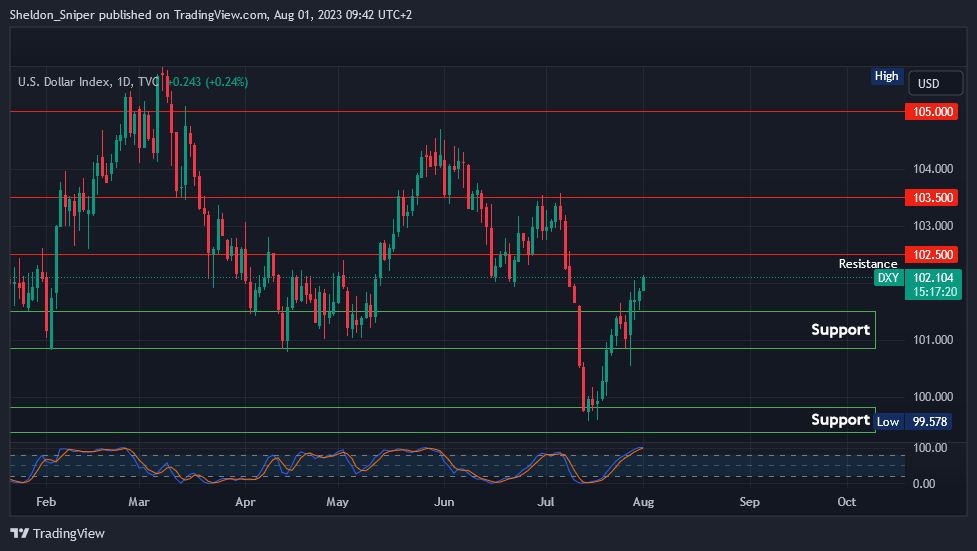
After hitting a 12 month low in the middle of July, the DXY has made a massive move to the upside over the last two weeks and this has put some pressure on the markets.
The DXY hit a low of 99.57 in July, and now two weeks later is currently trading at just over 102. The next resistance level of 102.50 is not too far off and traders are looking for a rejection at that level which could possibly provide some relief to the Crypto Market.
A trend reversal in the next couple of days could take the DXY down to the next area of support at 101.00 – 101.50 which could give the much needed relief to the markets. A continuation of the trend, with a break of the 102.50 resistance, could take the DXY to the next area of resistance at 103.50, and if that happens we could expect further downside in the Market, over the next couple of weeks.
Claim your Bitget sign-up bonuses here (details below).
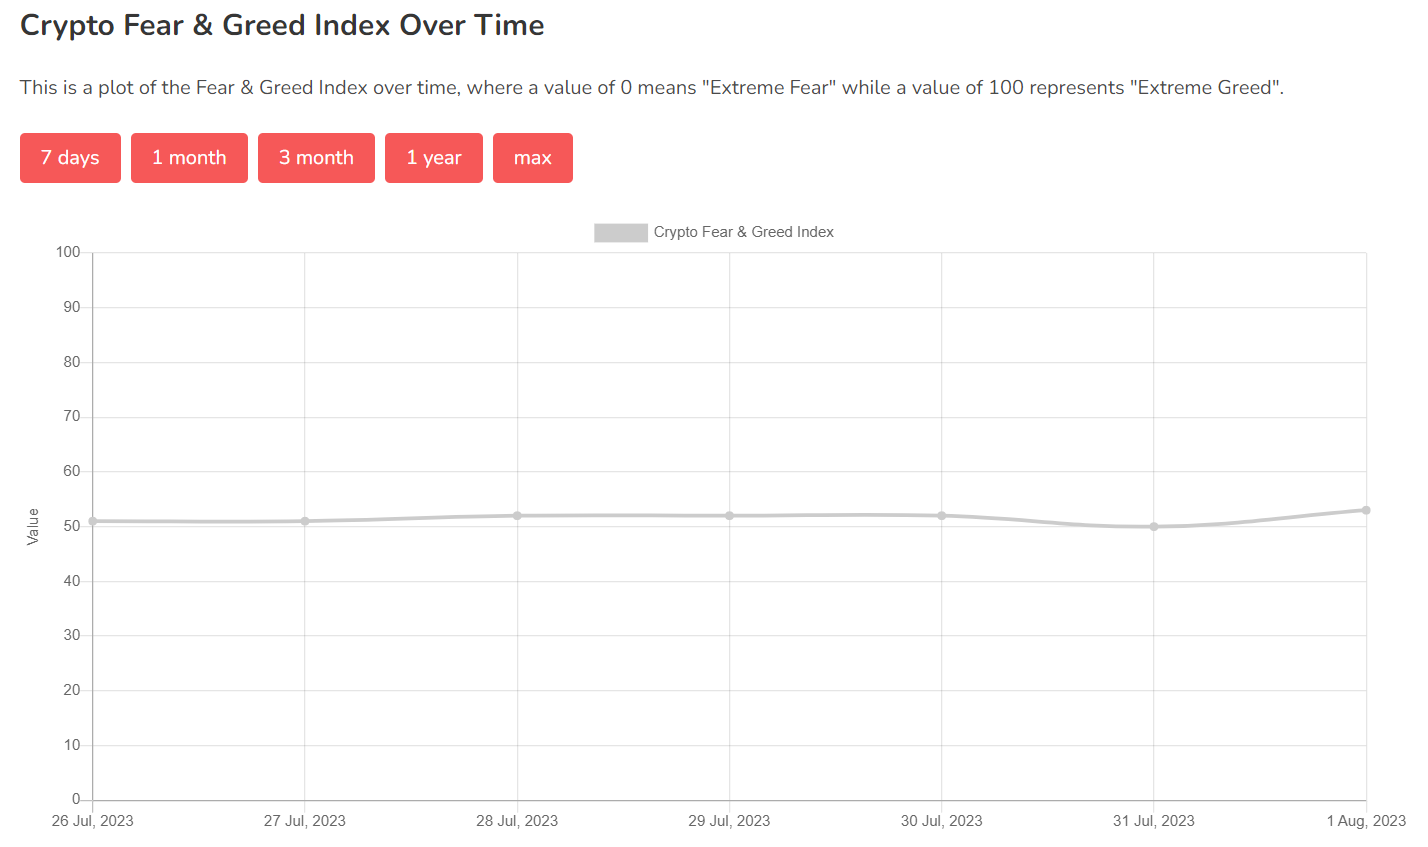
Chart #5 - Fear and Greed Index
The Fear and Greed Index is sitting at 53 today, Neutral.
The highest the index has been over the past seven days is 53, and the lowest is 50.
Banter’s Take
The DXY continues to push up, adding pressure to the Bitcoin and crypto markets.
If bulls don't step in soon then a deeper correction is possible for Altcoins. As for Bitcoin there is major major support at $27,000 which should elicit a big bounce.
Stay safe my friends!