

📈📉 Is ETH/BTC About to CRASH?
📈📉 Is ETH/BTC About to CRASH?
PLUS: LATE? Second Chance to LONG THIS Alt!
Overview
Chart #1 - Theta Network (THETAUSDT) 8-Hour
Chart #2 - Chainlink (LINKUSD) 12-Hour
Chart #3 - Ethereum / Bitcoin (ETHBTC) Daily
Chart #4 - Aave (AAVEUSDT) 8-Hour
Chart #5 - Fear and Greed Index
Chart #1 - Theta Network (THETAUSDT) 8-Hour
Chartist: Sheldon
(For the chart screenshot, click here.)
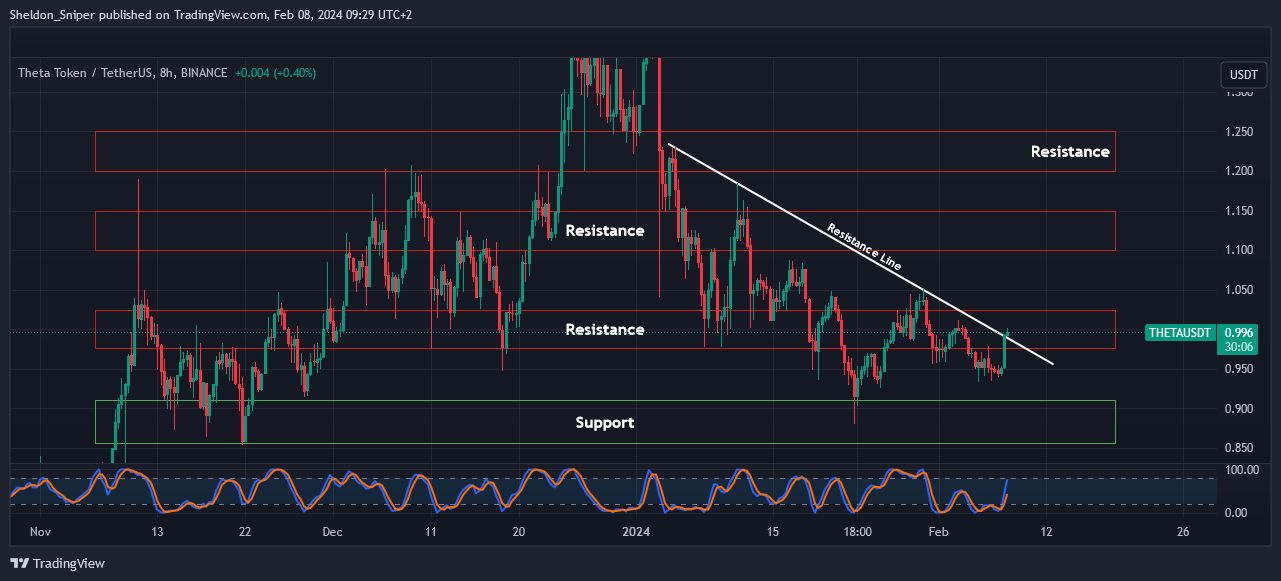
Bitcoin broke through its $43,700 resistance level yesterday, and the rest of the market followed!
THETA has risen from $0.95 to $1.00, where it’s encountering resistance, so a potential consolidation might occur before another move up.
This presents an opportunity for late buyers to enter a trade at the current level, with the plan of taking profit at the $1.10 - $1.15 and $1.20 - $1.25 resistance areas.
My stop loss would be set around $0.93.
Sign-up and trade on Bybit today.
Exclusive $30,000 deposit rewards and bonuses up for grabs!
Chart #2 - Chainlink (LINKUSD) 12-Hour
Chartist: Kyle
(For the chart screenshot, click here.)
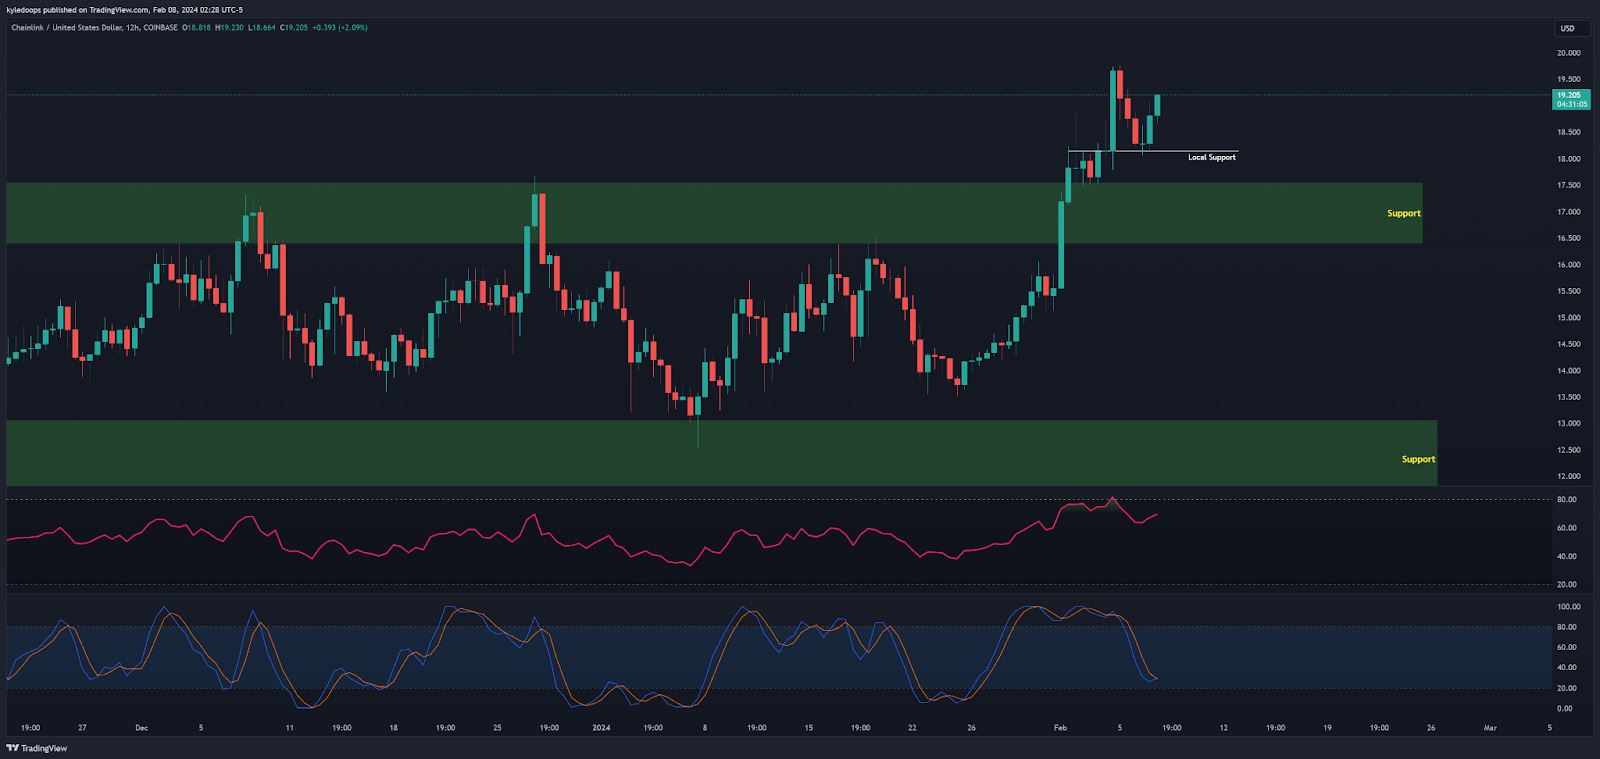
It seems like LINK is gearing up for another upward move.
It has found local support at $18 and is capitalizing on Bitcoin's movement from yesterday. For a clear indication of breaking structure and continuing its path to $27, LINK needs to pass and hold above $19.80.
Additionally, the Stochastic RSI is indicating a possible cross up, preparing for another upward wave.
Claim your Bitget sign-up bonuses here (details below).

Outsmart 99% Of The Market!
Get full access into our Discord And Telegram group, where you'll find all of our premium content!
👉 Trade Signals!
👉 Trade Set-Ups!
👉 Trading Challenges!
👉 Education!
👉 SO MUCH MORE!
Chart #3 - Ethereum / Bitcoin (ETHBTC) Daily
Chartist: Kyle
(For the chart screenshot, click here.)
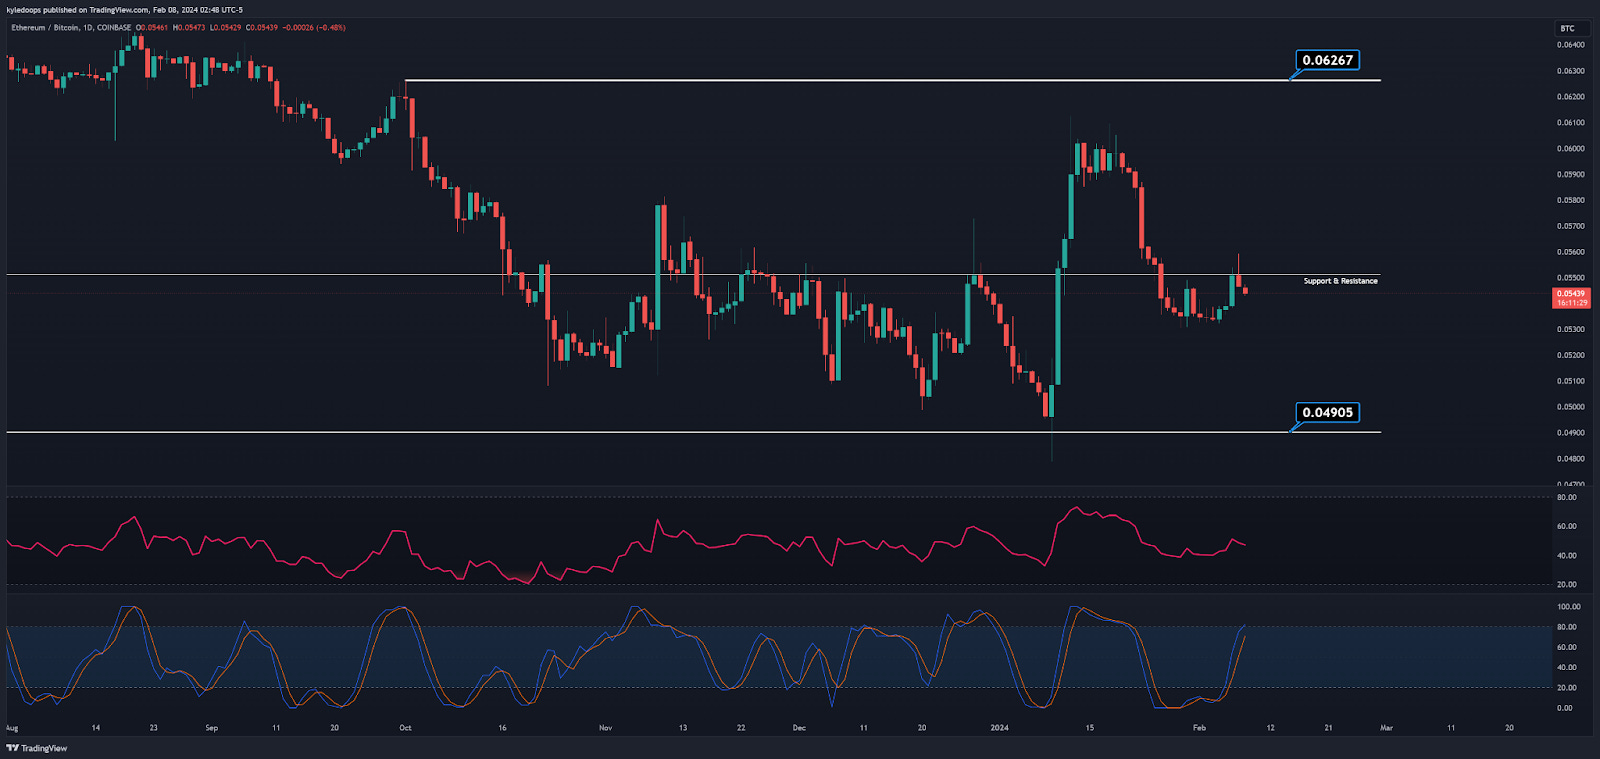
It's not necessarily over for ETH yet!
According to this chart, it appears to have run into resistance again. The next possible target could be at the next local support at Ξ0.0533, where we might see a new consolidation area before its next move.
If ETH succeeds in holding and bouncing from this level, the target remains at Ξ0.0626. However, if it fails to do so, we could see a move towards the bottom of the range at Ξ0.0490.
Claim your Bitget sign-up bonuses here (details below).
Chart #4 - Aave (AAVEUSDT) 8-Hour
Chartist: Sheldon
(For the chart screenshot, click here.)
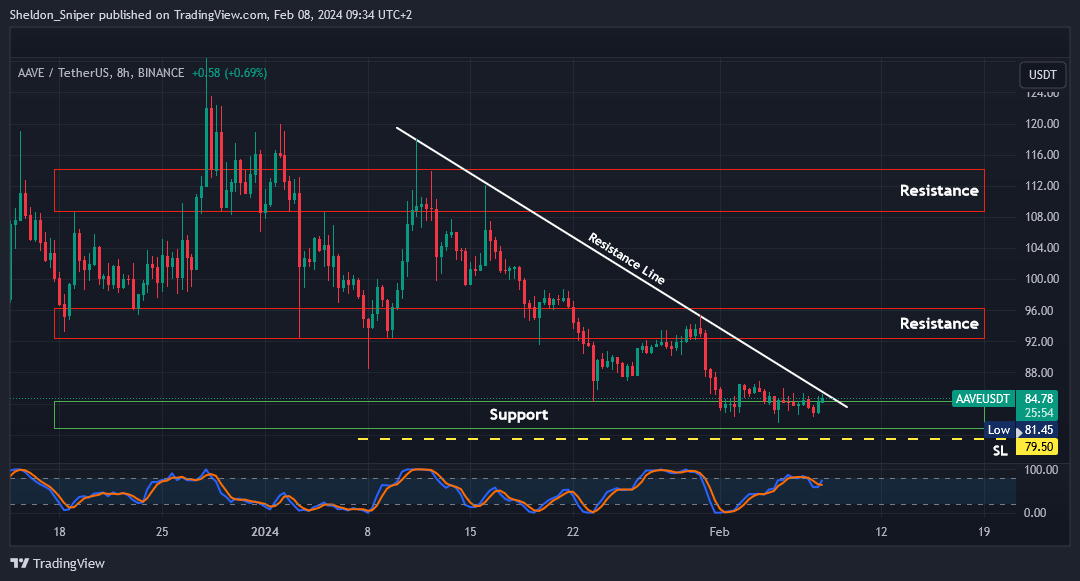
AAVE is trading around $85 and is still holding support.
It's also close to breaking through the descending resistance line dating back to the beginning of January.
I'm considering entering a long trade at this support level, allocating 30% of my intended funds initially, with an additional 30% upon the break of the resistance line, and the remaining 40% after a retest of the breakout.
Take profit areas: $92 - $96 and $108.50 - $114.
Stop loss: $79.50.
Claim your Bitget sign-up bonuses here (details below).
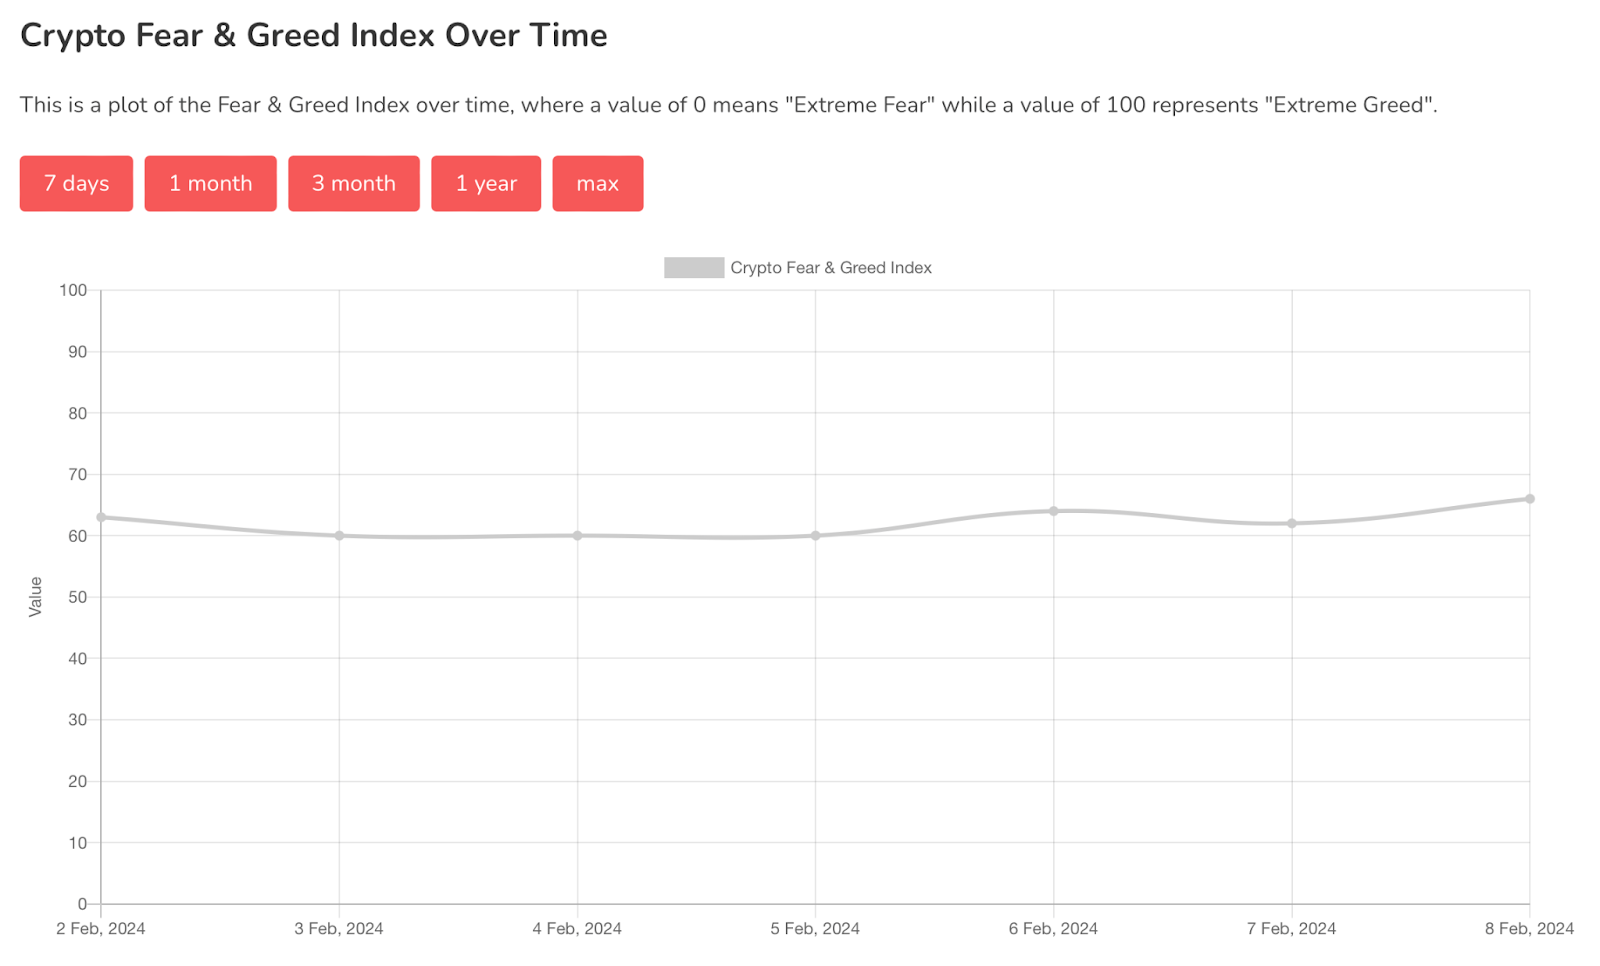
Chart #5 - Fear and Greed Index
The Fear and Greed Index is sitting at 66 today, indicating Greed.
The highest the index has been over the past seven days is 66, and the lowest is 60.
Banter’s Take
The bulls seem to be testing the waters as the price continues to rise without much resistance from the bears.
The target is set at $45,000 and possibly $45,500, where we anticipate encountering some resistance. If the bears intervene at that price level, we expect a dip back to $42,800.
Altcoins are likely to benefit from this price action, so it's essential to seize the momentum!
Stay safe my friends!
Go to our Crypto Banter Discord here where Sheldon and Kyle give updates on the charts and trades from The Daily Candle newsletter!