

📈📉 Is FTM going to hit $0.40 soon? This would send ETH down to $1,200!
📈📉 Is FTM going to hit $0.40 soon? This would send ETH down to $1,200!

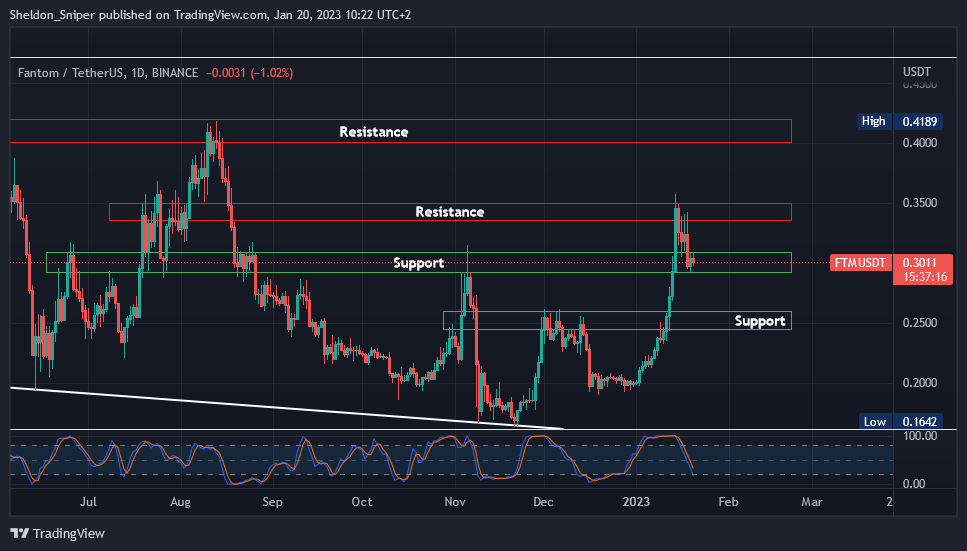
Chart #1 - Fantom (FTMUSDT) 1-Day Chart
Chartist: Sheldon
(For the chart screenshot, click here.)
Over the past three weeks, FTM has had a massive run of over 75%, increasing from under $0.20 (at the end of December) to over $0.35.
However, the price has retraced since, and FTM is now trading in an area of support at around $0.30. If that support holds, the price could go up to test $0.35 (resistance) and possibly even reach the next resistance level at $0.40. On the other hand, if the market continues to retrace and the support at $0.30 is broken, the next support level is between $0.25 and $0.26.
FTM is a popular choice among traders and is considered to be a strong Layer-1 coin. I believe that it will recover quickly once the bull market returns.
Check our Crypto Banter Discord here for updates!
Follow me on Twitter for urgent updates on my trading progress!
Claim your Bitget sign-up bonuses here (details below).
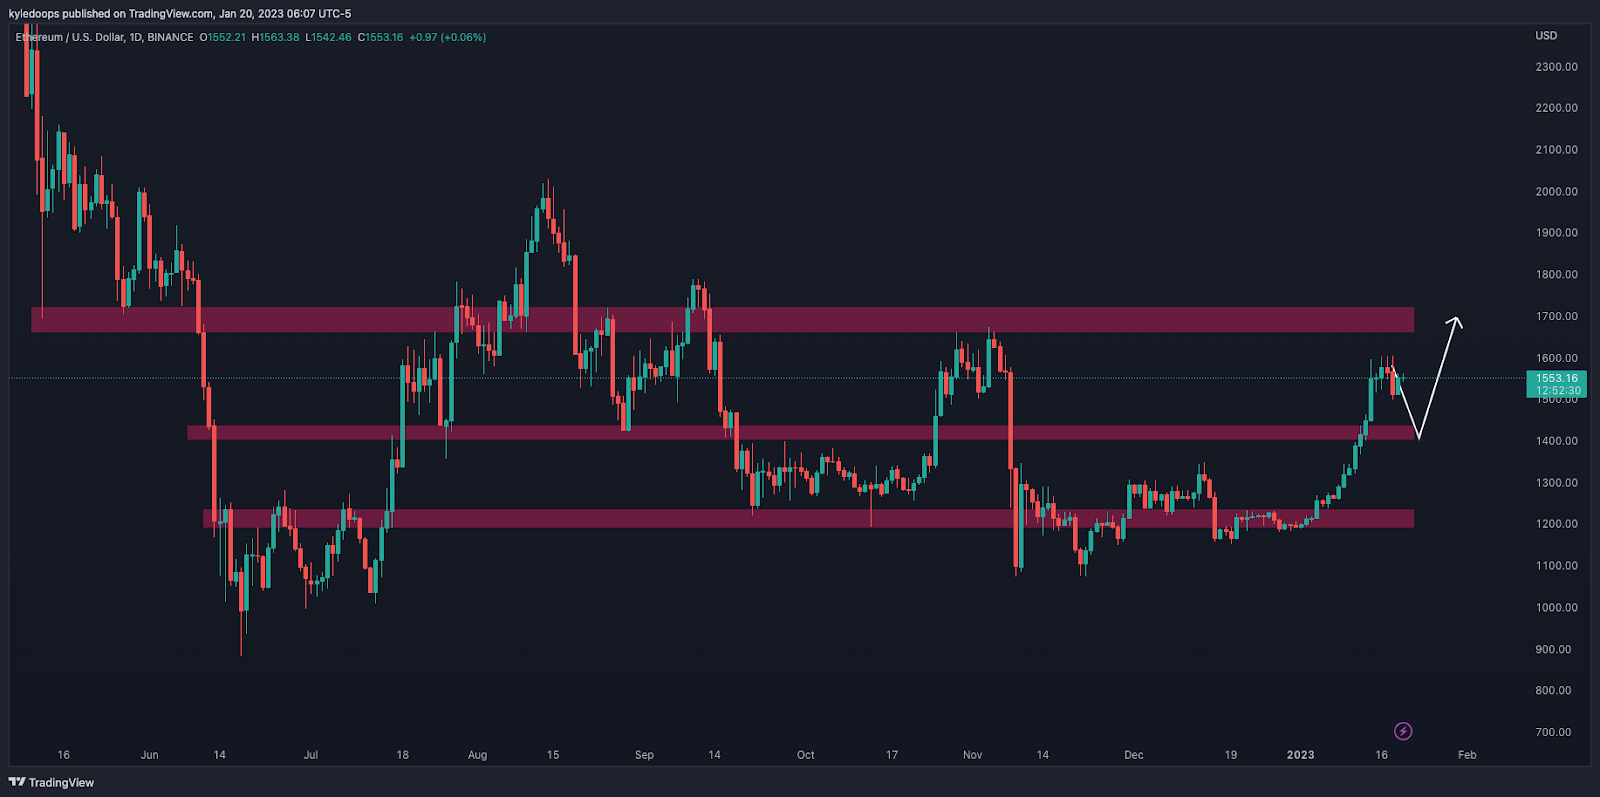
Chart #2 - Ethereum (ETHUSD) 1-Day Chart
Chartist: Kyle
(For the chart screenshot, click here.)
ETH had a sharp move up off of the lows with little to no real pull-back.
If it pulls back into the $1,400 level, I will treat it as a buying opportunity, with the invalidation being a fall below the mid-range. Should it bounce from there, our next target is $1,700 - the range-high and next major resistance level.
A deviation below $1,400, whereby the price starts closing below the mid-range level, would be incredibly bearish, and would mean that coming all the way back down to $1,200 is highly likely.
Check our Crypto Banter Discord here for updates!
Make sure to follow me on Twitter, where I will post updates on my trades as they unfold!
Claim your Bitget sign-up bonuses here (details below).

Options trading in cryptocurrency is a way of investing in digital currencies like Bitcoin or Ethereum by buying and selling options contracts. An options contract is a type of agreement that gives the buyer the choice, but not the obligation, to buy or sell an asset (in this case, a cryptocurrency) at a specific price, called the strike price, on a specific date.
When you buy an options contract, you have the ability to make a decision based on the current market conditions. For example, if you buy a "call option" (the right to buy an asset), and the market price of the underlying cryptocurrency goes up, you can choose to buy it at the strike price and then sell it for a profit. Similarly, if you buy a "put option" (the right to sell an asset) and the market price goes down, you can choose to sell at the strike price and make a profit.
Options trading can be used for different reasons, like protecting other investments, earning money, or guessing what the price of the underlying cryptocurrency will be in the future. It's important to remember that options trading is a complex and high-risk investment and you should have a good understanding of the market and the underlying cryptocurrency before getting started.
Deribit is the leading Bitcoin and Ethereum Options Exchange for crypto traders.
Deribit offers a robust, reliable, and lighting-fast options platform for high-performance trading.
Sign up for a Deribit account here. Follow Ran’s daily YouTube show, and check The Daily Candle newsletter every Friday to learn more about options trading with Deribit.
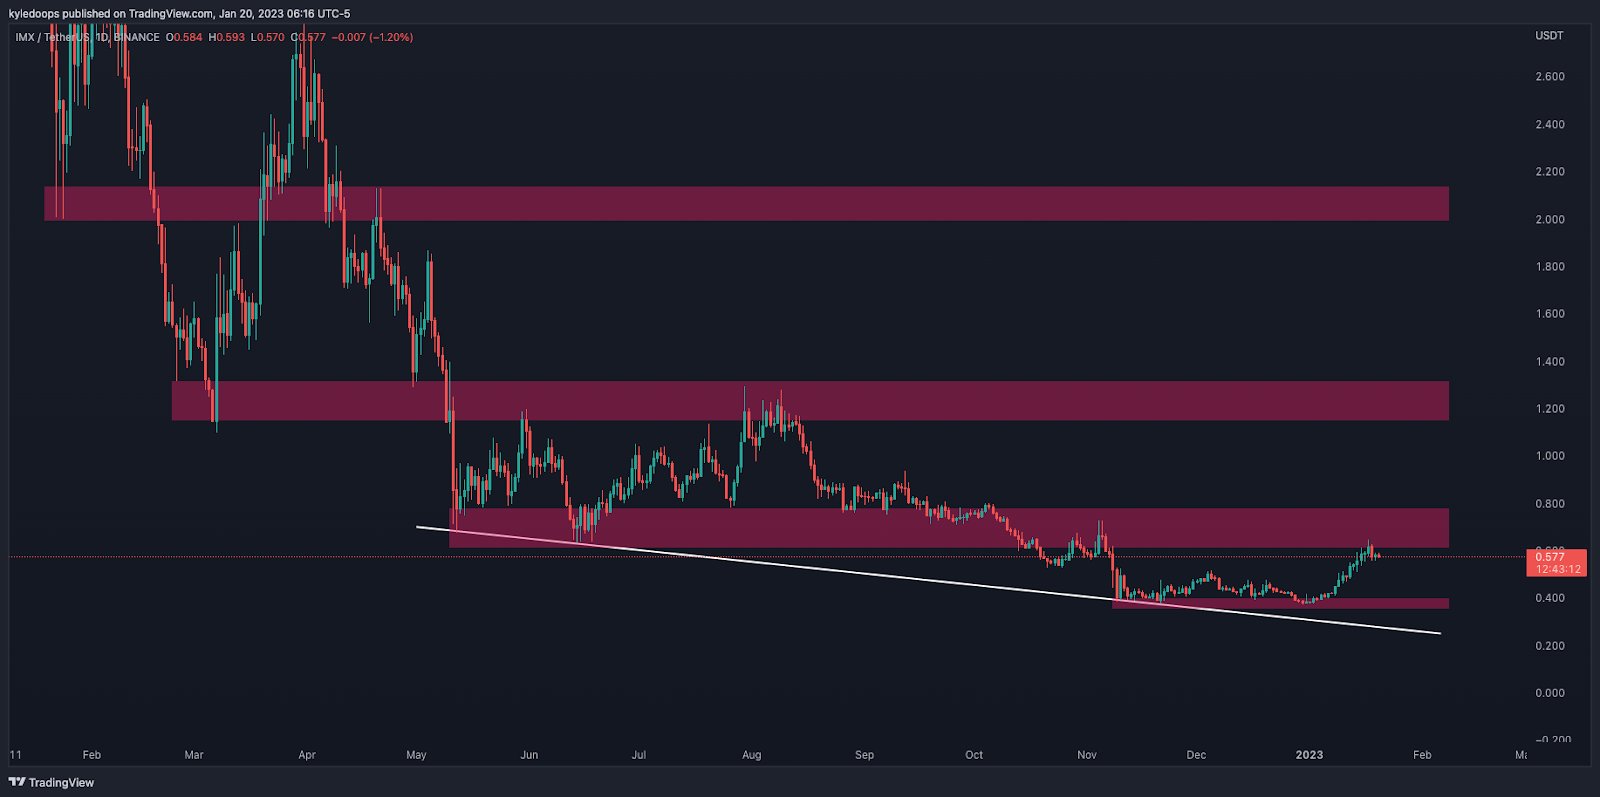
Chart #3 - ImmutableX (IMXUSDT) 1-Day Chart
Chartist: Kyle
(For the chart screenshot, click here.)
IMX is near resistance at $0.60, and it looks like it's rejecting from that level.
If it fails to get through the pink box, my next level of interest becomes $0.40, where it may form a tighter range.
If it can hold that $0.40 level for a couple more weeks, it could be a decent accumulation zone.
Check our Crypto Banter Discord here for updates!
Make sure to follow me on Twitter, where I will post updates on my trades as they unfold!
Claim your Bitget sign-up bonuses here (details below).
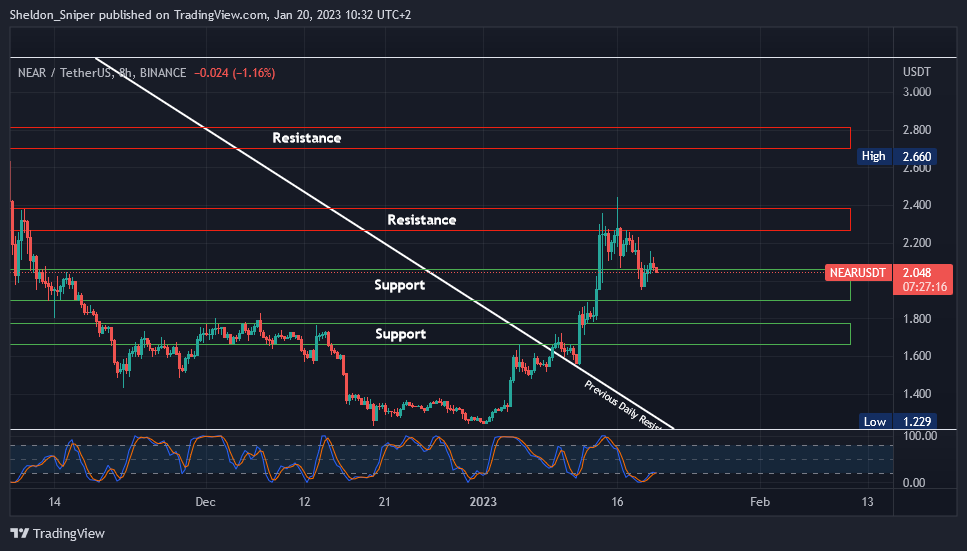
Chart #4 - NEAR Protocol (NEARUSDT) 8-Hour Chart
Chartist: Sheldon
(For the chart screenshot, click here.)
NEAR doubled over the last three weeks, going from $1.22 to the resistance level of $2.44.
Price has retraced since, falling to around $2 (support).
If NEAR can hold support here, it could be setting itself up to test the $2.40 level again, or possibly even the next resistance level at $2.80. If the market drops further and the current support does not hold, the next support is around $1.70.
Like FTM above, NEAR is also a favorite token among traders, and I believe there is a lot more upside to come if BTC carries on trending higher.
Check our Crypto Banter Discord here for updates!
Follow me on Twitter to get all the updates on my personal trading progress!
Claim your Bitget sign-up bonuses here (details below).
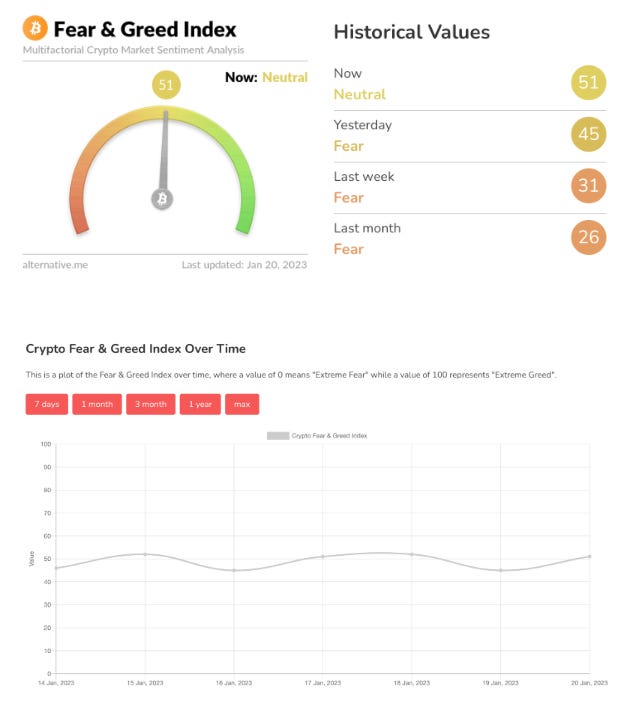
Chart #5 - Bitcoin Fear and Greed Index
The Bitcoin Fear and Greed Index is sitting at 51 today, in Neutral territory.
The highest the index has been over the past seven days is 52, and the lowest is 45.
Overall Market Sentiment (Banter’s Take)
The market is still due for a pullback, and time is running out.
If the pullback doesn't come soon, bitcoin will likely move aggressively through all resistance, and the next leg up should occur.
Stay safe my friends!