

📈📉 Is PEPE About To Crash Further? Fantom Loses Crucial Support!
📈📉 Is PEPE About To Crash Further? Fantom Loses Crucial Support!

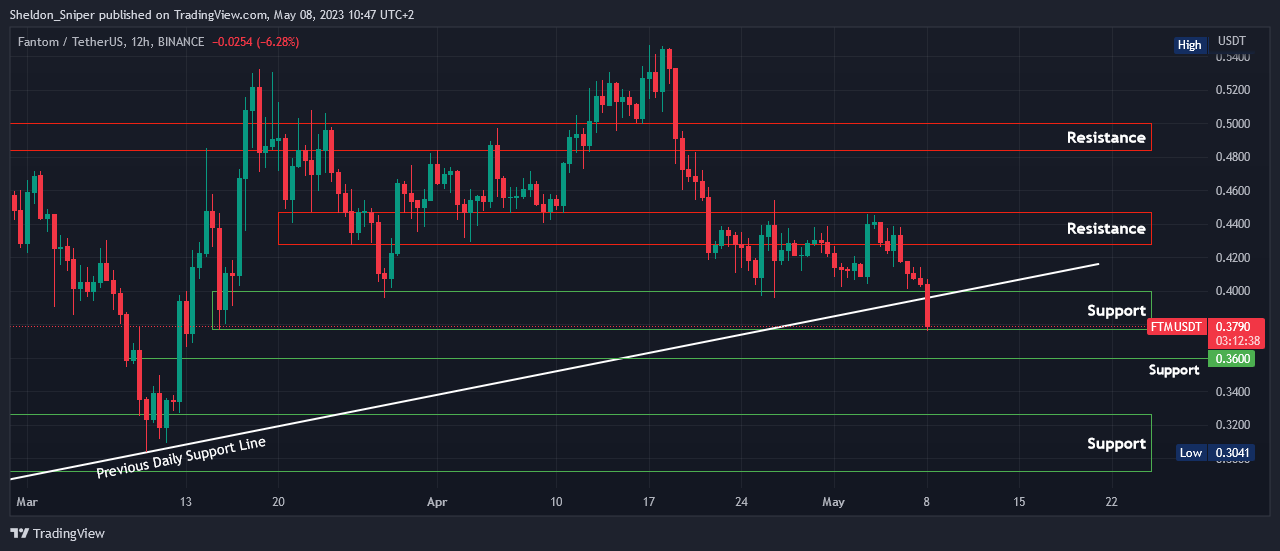
Chart #1 - Fantom (FTMUSDT) 12-Hour Chart
Chartist: Sheldon
(For the chart screenshot, click here.)
Last night, FTM lost its crucial $0.40 support level and also broke the daily support line that began in January.
Currently trading around $0.38, FTM is at the lower end of the $0.38 - $0.40 support range. If the price stabilizes and reverses, it could rise to test the previous daily support line, now acting as resistance, at around $0.40.
However, if the price goes up and gets rejected there, further downside can be expected for FTM, possibly testing $0.36.
The major support area below that lies between $0.2950 - $0.3300.
𝗣𝗿𝗶𝗺𝗲 𝗫𝗕𝗧
Sign up for a new Trading Account on Prime XBT!
Receive a deposit bonus of up to $7,000 with promo code: SheldonSniper
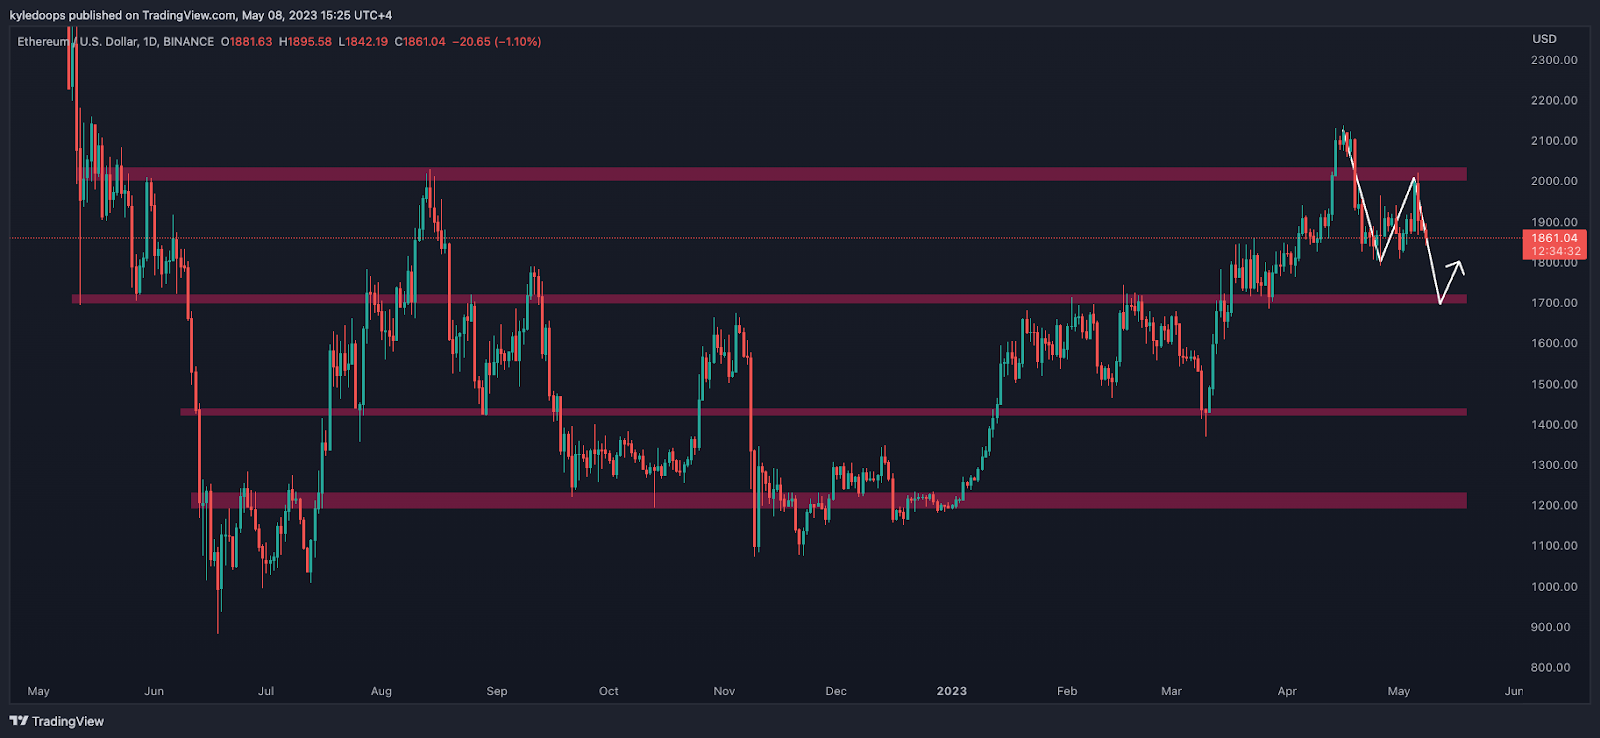
Chart #2 - Ethereum (ETHUSD) 1-Day Chart
Chartist: Kyle
(For the chart screenshot, click here.)
Anything under $2,000 for ETH is a risk to the downside. So, it looks like the price will continue to trend down towards the $1,700 mark.
A tag of $1,700 will likely lead to a bounce, but it's what happens after that bounce that matters the most. If you see a higher low off of the bounce, it's likely going to break $1,700.
The most likely scenario, though, would be that ETH continues to range between $1,700 and $2,000.
𝗣𝗿𝗶𝗺𝗲 𝗫𝗕𝗧
Sign up for a new Trading Account on Prime XBT!
Receive a deposit bonus of up to $7,000 with promo code: KyleDoops

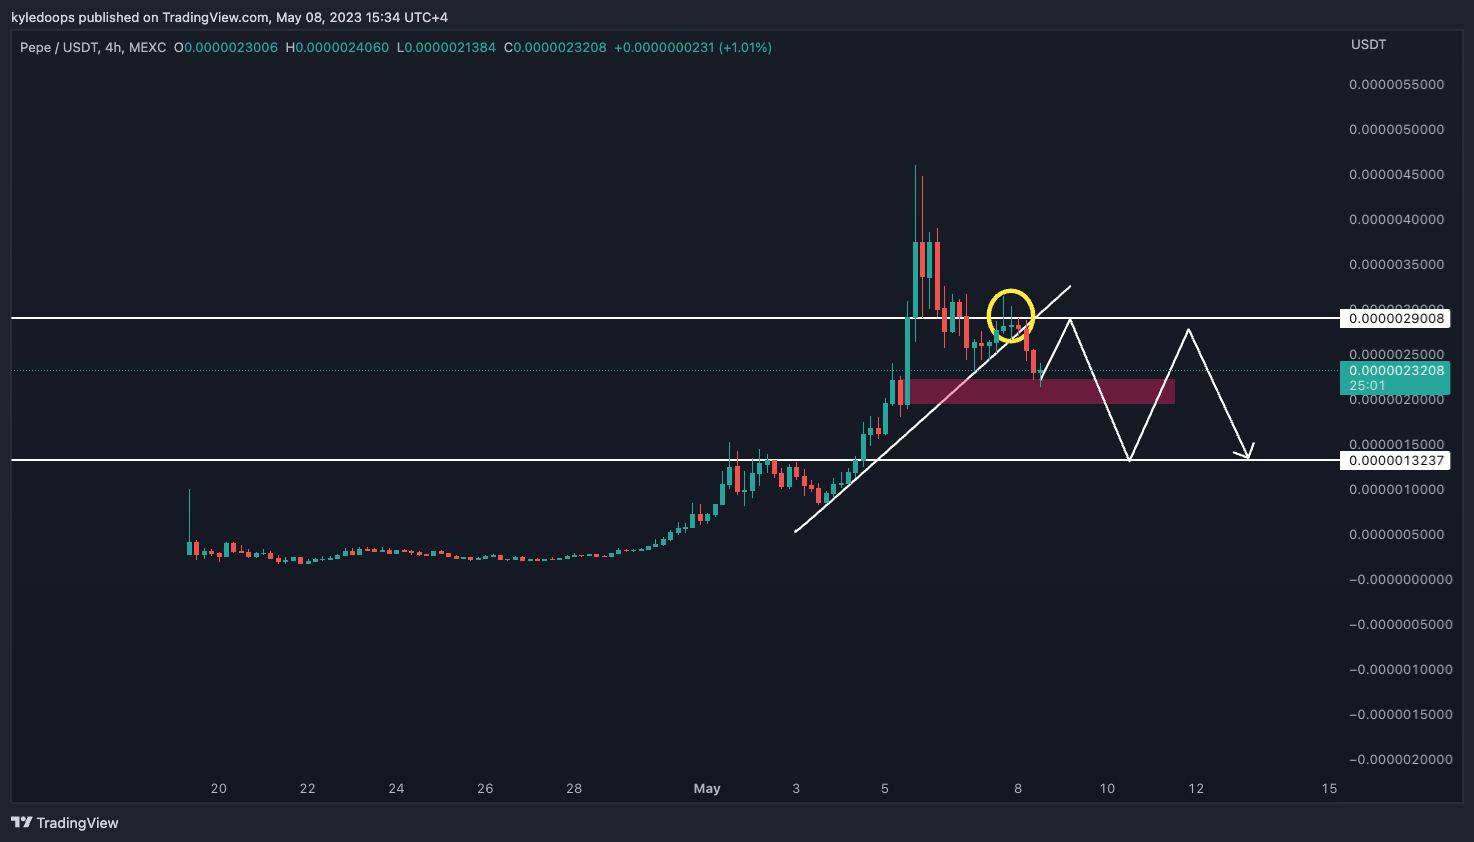
Chart #3 - Pepe (PEPEUSDT) 4-Hour Chart
Chartist: Kyle
(For the chart screenshot, click here.)
PEPE has come into a supply zone and could potentially bounce from here.
However, it's important to outline that the bounce could very easily lead to a continuation lower. Also, as depicted by the line drawings, be open to the idea that PEPE could form a massive range.
Bulls' biggest concern should be the recent high (yellow circle), which could be a complacency bounce that ultimately leads to much lower prices over time.
Claim your Bitget sign-up bonuses here (details below).
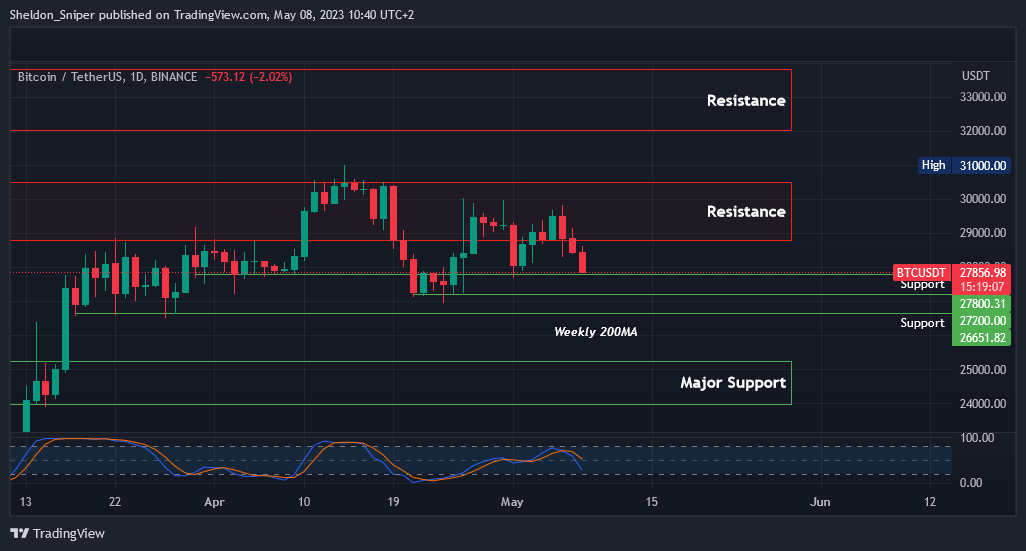
Chart #4 - Bitcoin (BTCUSDT) 1-Day Chart
Chartist: Sheldon
(For the chart screenshot, click here.)
Over the past three days, BTC experienced a $2,500 drop, falling from a high of just under $30,000 on Saturday to a low of around $27,600 this morning.
Currently, BTC has found support near $27,800, and there is a chance it may reverse and climb to test $28,650. However, the last month has seen lower highs on BTC's daily chart. If it doesn't surpass $30,500, further declines could follow.
If the $27,800 support breaks, the price may drop to the next support levels at $27,200 or $26,650, potentially even reaching the major support zone between $24,000 - $25,200. Additionally, the 200-week moving average is found at roughly $26,100, which will serve as additional support if the price gets there.
Claim your Bitget sign-up bonuses here (details below).
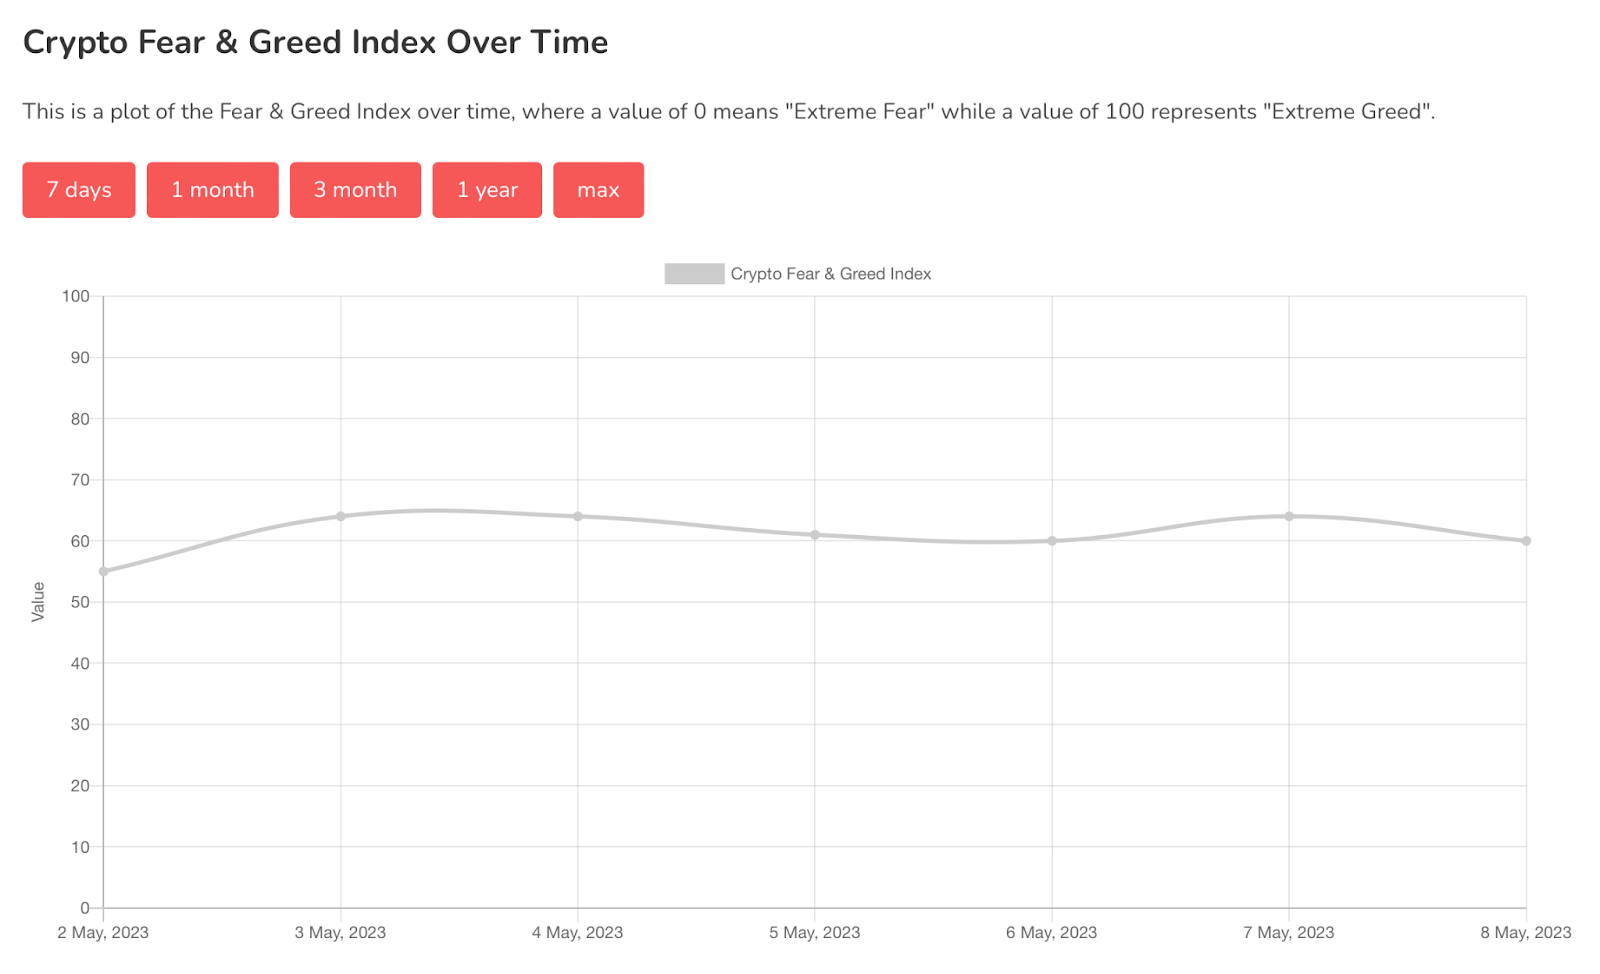
Chart #5 - Bitcoin Fear and Greed Index
The Bitcoin Fear and Greed Index is sitting at 60 today, indicating Greed.
The highest the index has been over the past seven days is 64, and the lowest is 55.
Banter’s Take
Despite the recent sell-off, prices are more likely to bounce from here than to continue downwards since bitcoin and ETH have now entered key liquidity zones. Many altcoins are also finding support.
A catalyst event to watch out for this week would be the CPI inflation data. It will indicate whether there is a tick up in inflation and whether or not inflation is becoming increasingly sticky. Once that data is out of the way, the market will have guidance as to what may occur at the next interest rate hike. Consequently, the market will price that in, leading to either an expansive move up or down.
Stay safe my friends!
Go to our Crypto Banter Discord here where Sheldon and Kyle give updates on the charts and trades from The Daily Candle newsletter!
Today’s winning UIDs:
Bybit winner - 26876650
Bitget winner - 3276413659