

📈📉 Is This a Bear Trap? + Crucial BTC Levels!
📈📉 Is This a Bear Trap? + Crucial BTC Levels!

Overview
Chart #1 - Bitcoin (BTCUSD) Weekly Chart
Chart #2 - Bitcoin (BTCUSD) Daily Chart
Chart #3 - Total Crypto Market Cap (TOTAL) 3-Day Chart
Chart #4 - S&P 500 (SPX) Daily Chart
Chart #5 - Fear and Greed Index

Chart #1 - Bitcoin (BTCUSD) Weekly Chart
Chartist: Sheldon
(For the chart screenshot, click here.)
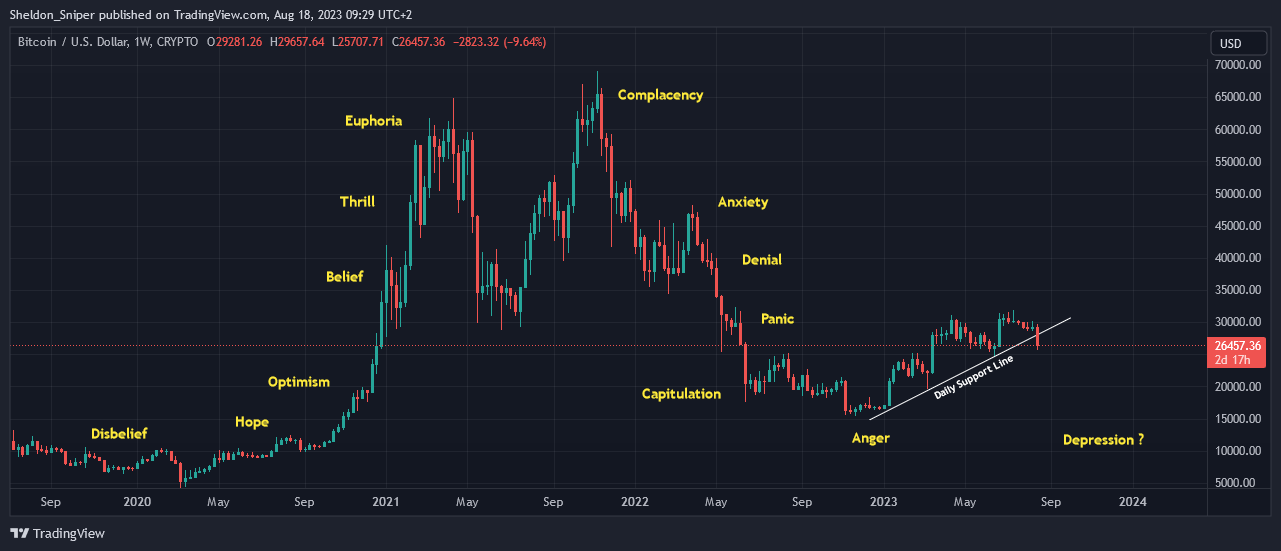
Yesterday, BTC's price plunged by a significant $3,600 and, of greater consequence, it broke through the daily ascending support line that originated at the start of the year. If BTC doesn't regain this line within the next day or two, we might see more downside in the coming weeks.
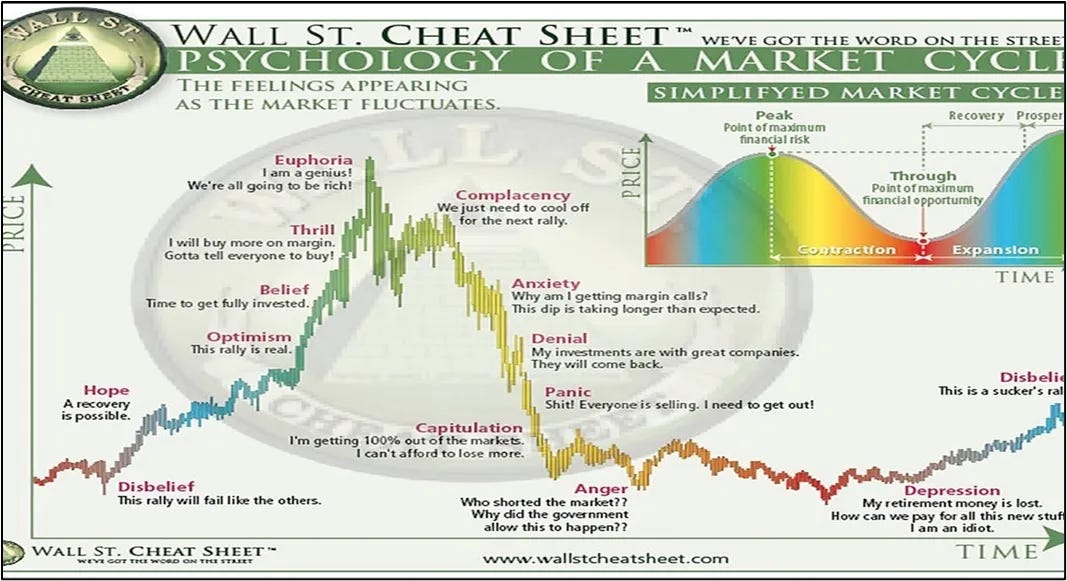
When examining the "Wall Street Cheat Sheet" which represents the emotional cycle, there's now a chance on a macro level that Bitcoin could enter a depression phase. This could mean a gradual price decline over several months. The depression phase is notoriously challenging to navigate, often leading to heightened frustration in the market, especially among swing traders attempting to pinpoint the market's bottom.
Historical patterns show that during this macro depression phase, BTC doesn't always fall below the Anger phase low. In our current context, this is the December 2022 low, slightly above $15,000. However, there have been instances where the price dipped even further. Predicting BTC's bottom is speculative at best, but given the levels BTC surrendered in its recent drop, it's wise to brace for potentially lower values.
Sign-up and trade on Bybit today.
Exclusive $30,000 deposit rewards and bonuses up for grabs!
Chart #2 - Bitcoin (BTCUSD) Daily Chart
Chartist: Kyle
(For the chart screenshot, click here.)
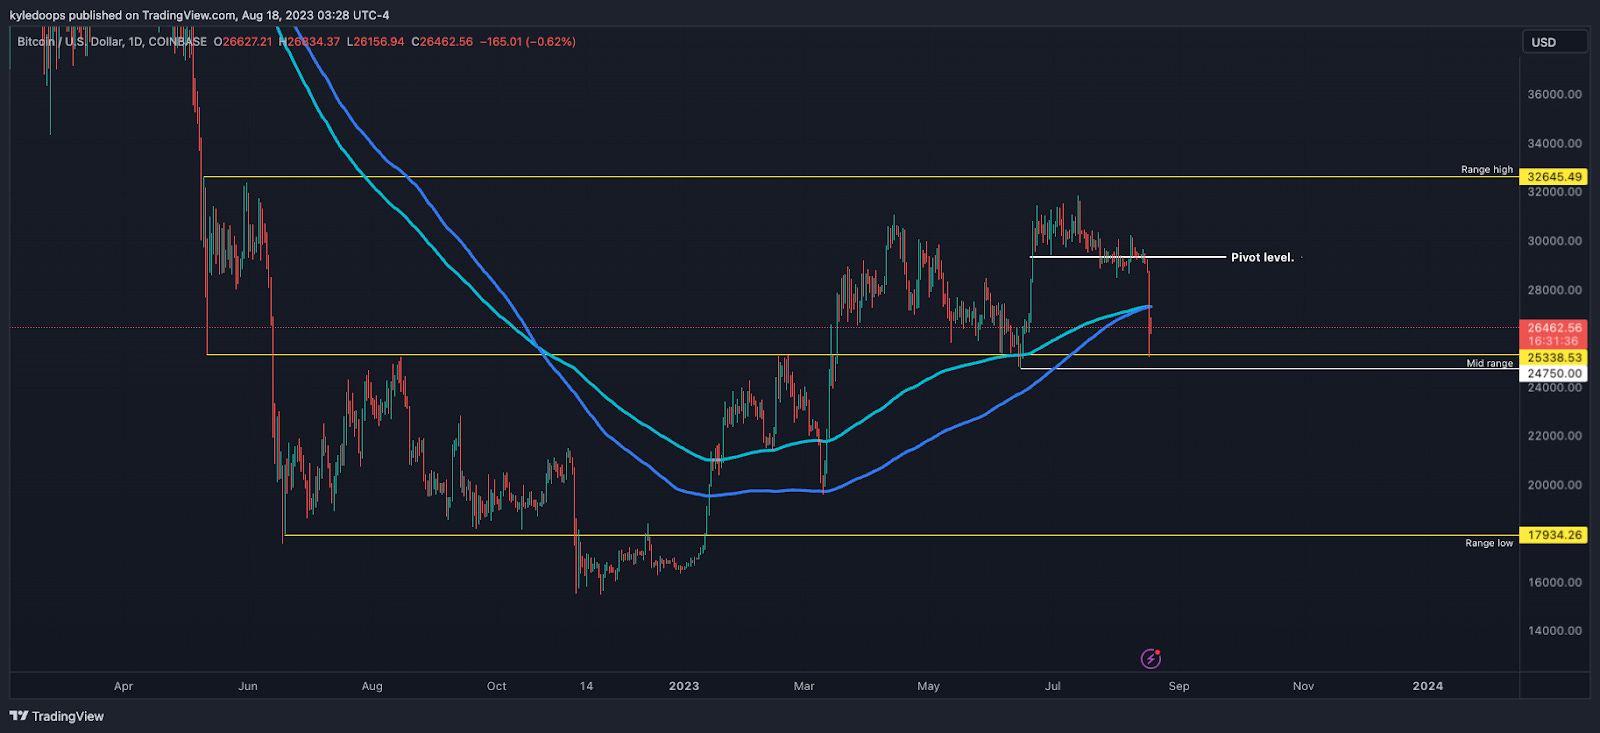
Bitcoin has touched the mid-range level at $25,338, but also simultaneously lost its 200 MA and EMA support.
As a trader, all you can do now is observe and wait for price action to decide where it will head next.
The higher highs and higher lows on the high timeframe persist, with $24,750 being the next significant higher low.
𝗣𝗿𝗶𝗺𝗲 𝗫𝗕𝗧
Sign up for a new Trading Account on Prime XBT!
Receive a deposit bonus of up to $7,000 with promo code: KyleDoops
Chart #3 - Total Crypto Market Cap (TOTAL) 3-Day Chart
Chartist: Kyle
(For the chart screenshot, click here.)
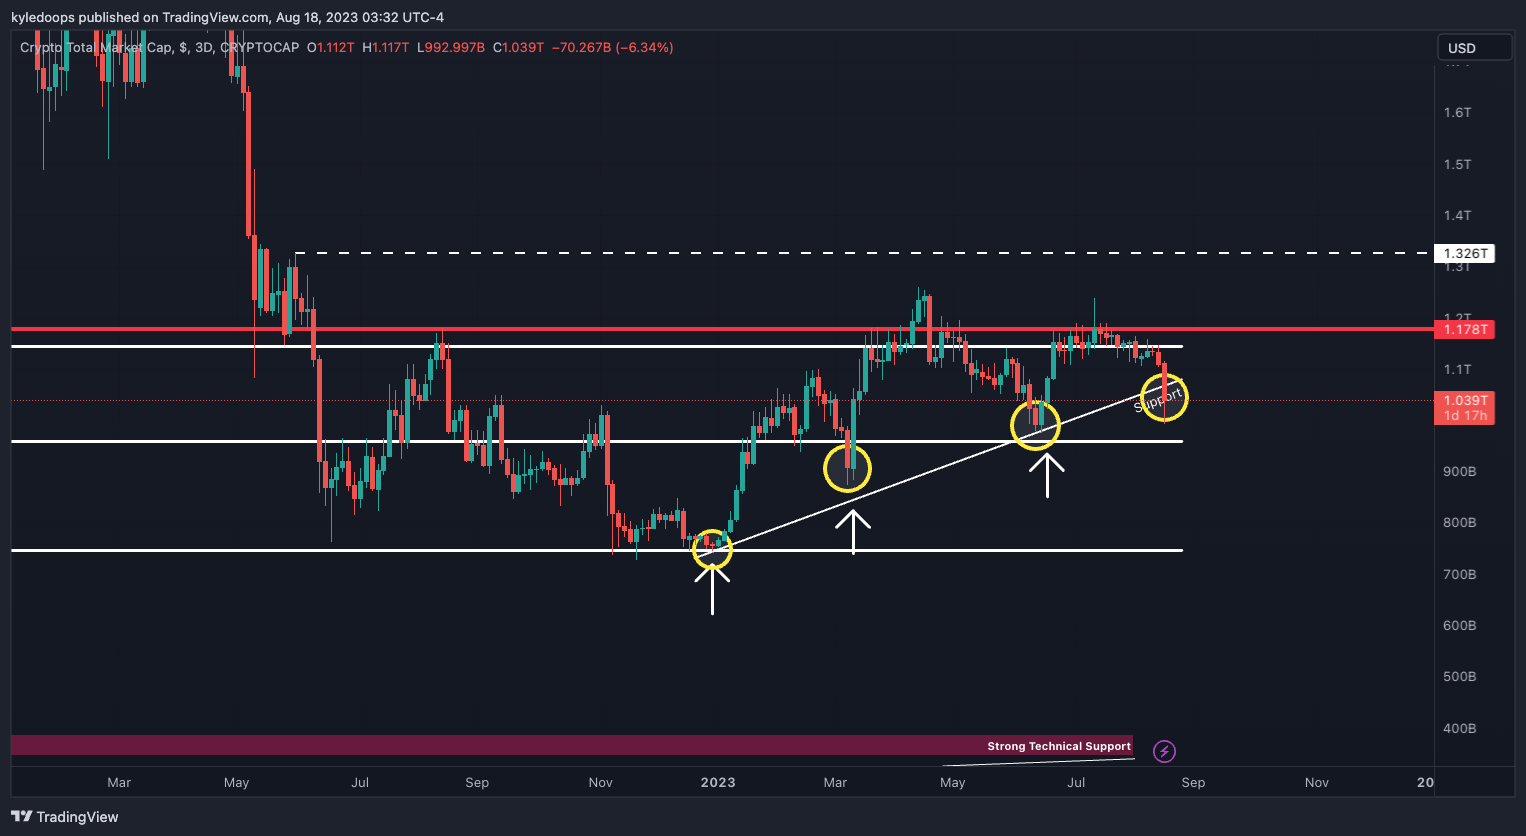
The TOTAL is holding at $1.039T, but the trend is still intact due to consistent higher lows.
If the price breaches the previous higher low of $988B, then the next substantial support is at the mid-range level of $961B.
The closing value is crucial; if the price closes above the supporting trend line, this could potentially be a bear trap.
Claim your Bitget sign-up bonuses here (details below).
Chart #4 - S&P 500 (SPX) Daily Chart
Chartist: Sheldon
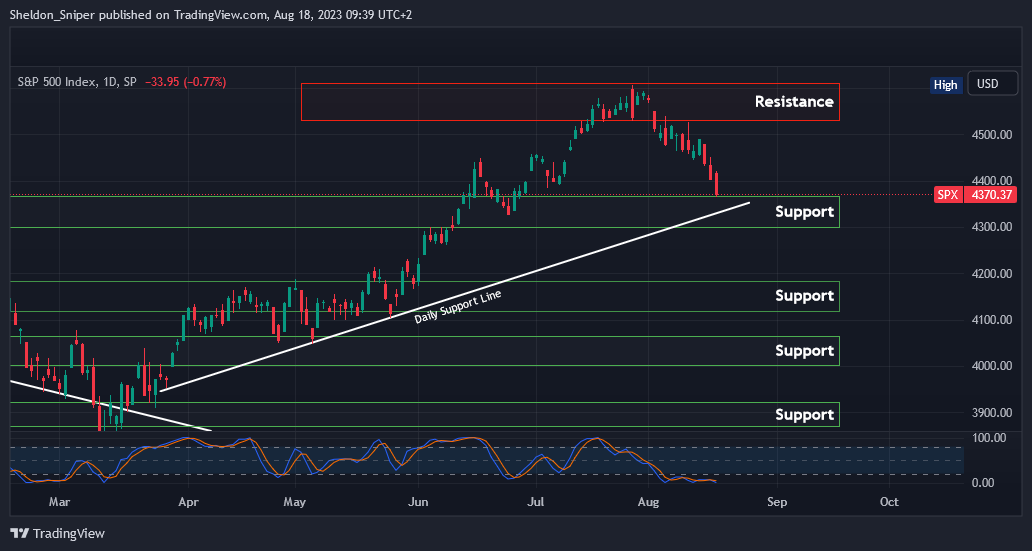
(For the chart screenshot, click here.)
The SPX has been trending downward since early August, facing rejection in the 4,600 - 4,900 resistance zone at the month's outset.
It now stands at 4,370, approaching the significant support range of 4,300 - 4,370, where I anticipate the price might find stability. The daily ascending support line from late March intersects in this zone, potentially offering added reinforcement.
If the trend reverses, the SPX could rise to test the 4,450 - 4,500 resistance levels. However, if it breaks through both the 4,300 mark and the daily support line, we could see it descend to the 4,120 - 4,200 support range.
Though it's early days, it's worth monitoring the US stock markets, like the SPX, for potential cues on BTC's price direction, like the patterns observed from January to September of the previous year.
Claim your Bitget sign-up bonuses here (details below).
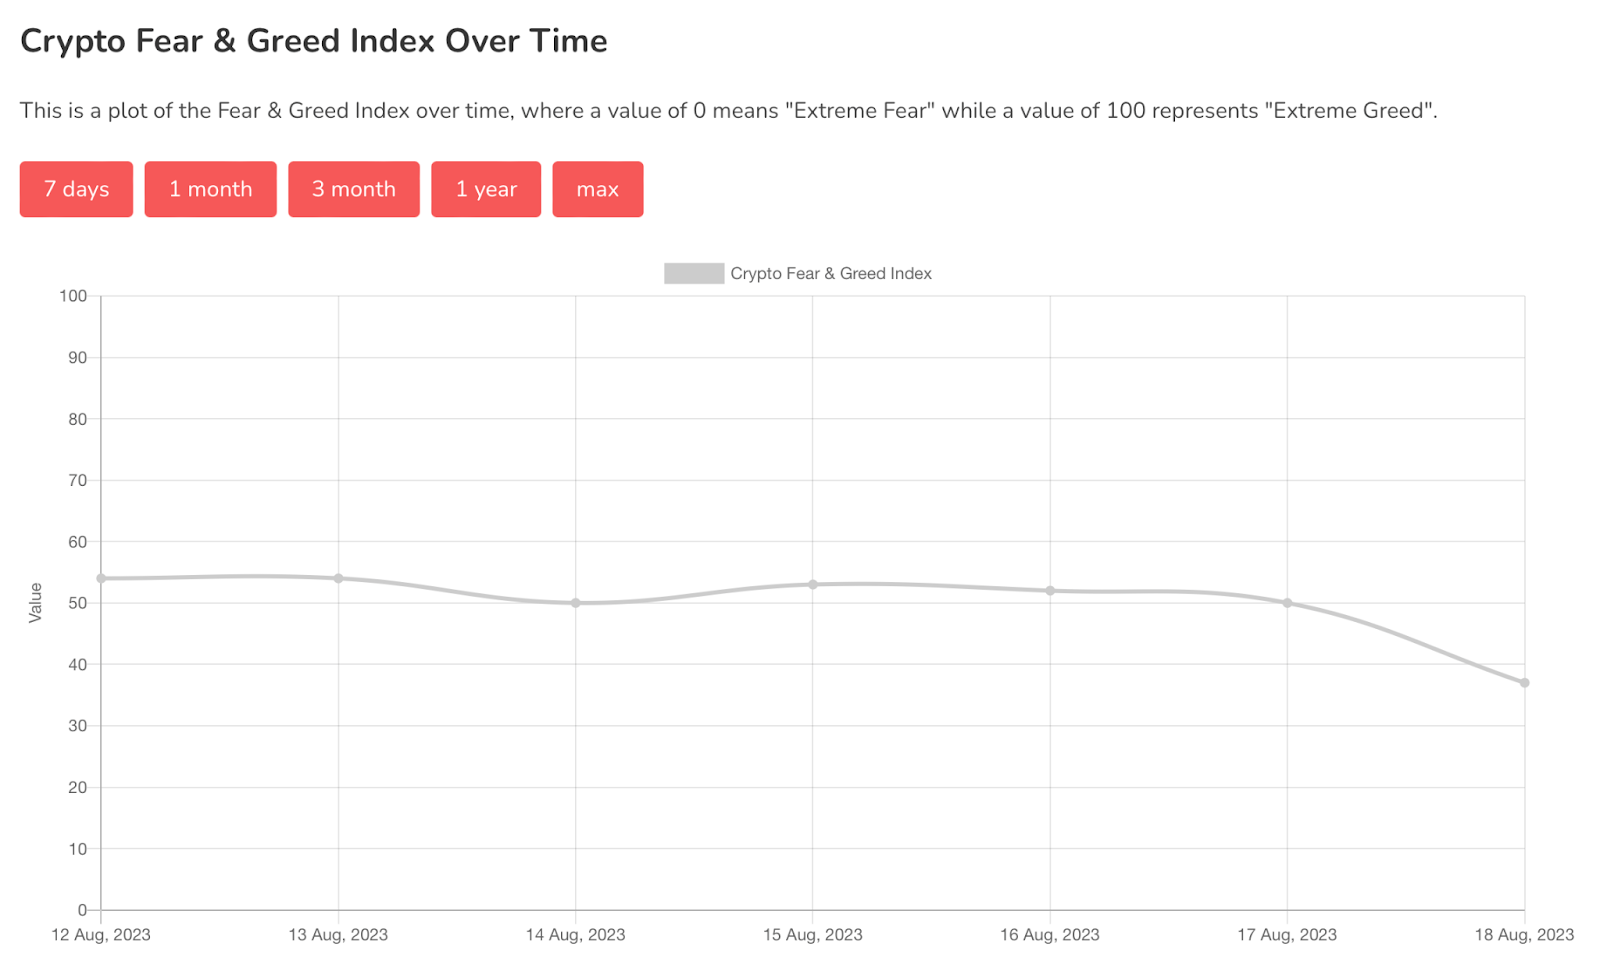
Chart #5 - Fear and Greed Index
The Fear and Greed Index is sitting at 37 today, indicating Fear.
The highest the index has been over the past seven days is 54, and the lowest is 37.
Banter’s Take
BTC lost significant levels overnight. If it doesn't regain these levels in the upcoming days, I anticipate further declines in BTC's price and the broader market in the coming months. The critical levels I'm watching for a potential rebound include the Daily 200MA and the Weekly 20MA.
Stay safe my friends!
Go to our Crypto Banter Discord here where Sheldon and Kyle give updates on the charts and trades from The Daily Candle newsletter!