

📈📉 Is this a BULL TRAP? Alts just lost THIS critical level!
📈📉 Is this a BULL TRAP? Alts just lost THIS critical level!

Bitget winner - 3766053197
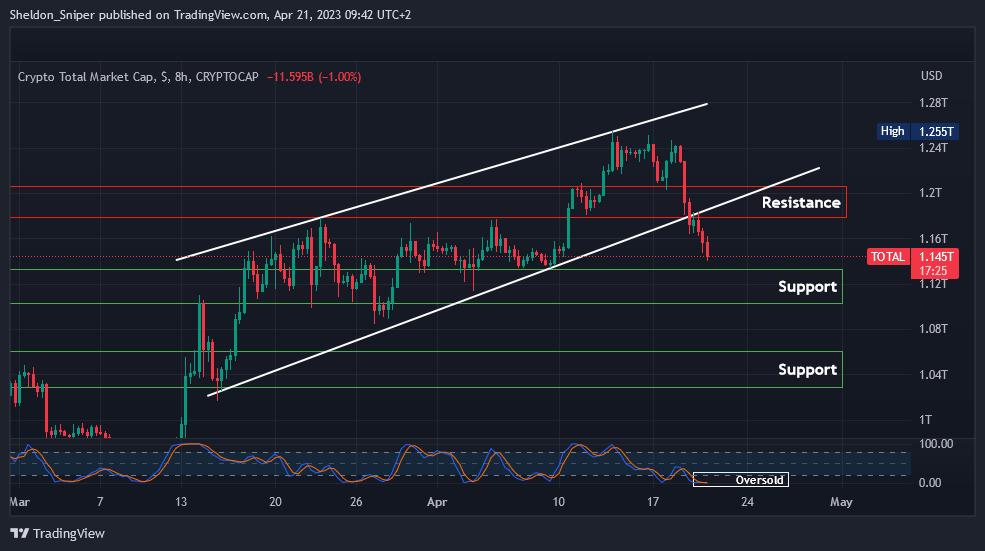
Chart #1 - TOTAL 8-Hour Chart
Chartist: Sheldon
(For the chart screenshot, click here.)
The TOTAL has dropped from $1.24T to $1.14T after $1.2T didn't hold as support and the daily ascending support line from last month broke.
The STOCH RSI on medium time frames is oversold, so the TOTAL may find support here, before retesting $1.18T. Rejection at $1.18T could bring the TOTAL down to test much lower levels in the next week or two.
If $1.12T doesn't hold, the next critical support is around $1.04T - the level the market was at in the middle of last month.
𝗣𝗿𝗶𝗺𝗲 𝗫𝗕𝗧
Sign up for a new Trading Account on Prime XBT!
Receive a deposit bonus of up to $7,000 with promo code: SheldonSniper
🔥 HUGE BYBIT TRADING COMPETITION!!! 🔥
Join The EXCLUSIVE Crypto Banter & Gareth Soloway ByBit Trading Competition!
Trade to win the biggest prizes in crypto, such as a TESLA, a ROLEX, and $10,000 CASH Prizes!
Register RIGHT NOW by clicking here. Don’t miss out!
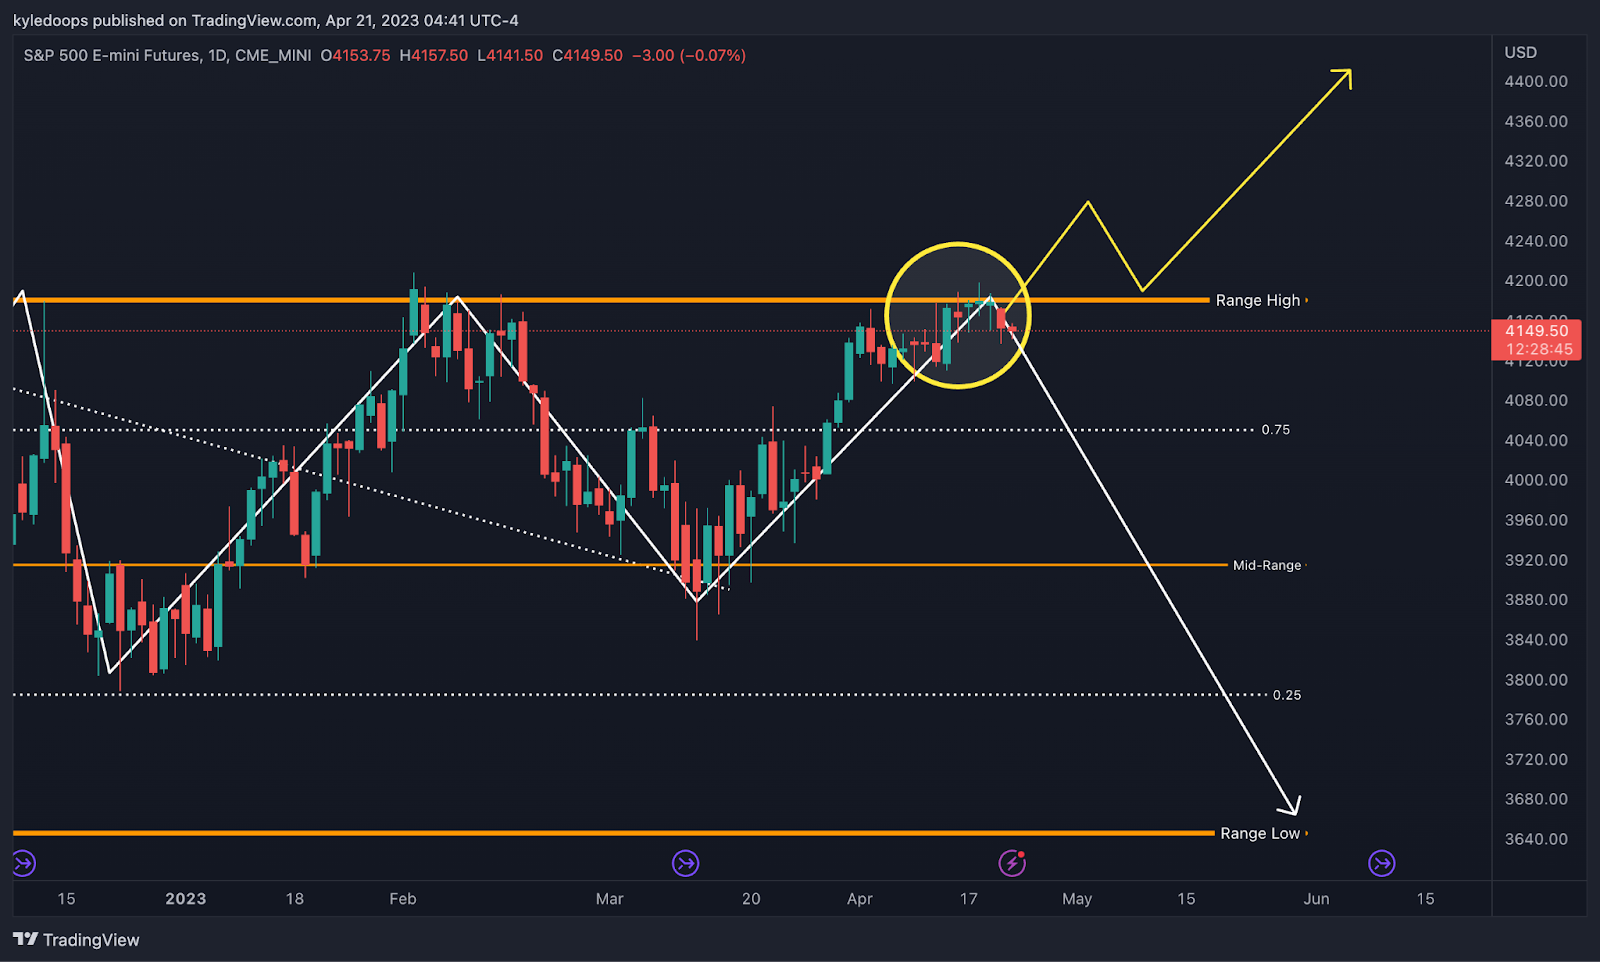
Chart #2 - S&P 500 Futures (ES1!) 1-Day Chart
Chartist: Kyle
(For the chart screenshot, click here.)
The ES1! (S&P 500 futures) has been rejected from the range high for the sixth time in the past few months.
That is creating additional downside pressure for risk-on assets, which could bring lower prices across the board. My next downside target is 4,051. If we lose that level I will look toward 3,914.
We need to correlate all that with what bitcoin is doing to time the dip correctly.
𝗣𝗿𝗶𝗺𝗲 𝗫𝗕𝗧
Sign up for a new Trading Account on Prime XBT!
Receive a deposit bonus of up to $7,000 with promo code: KyleDoops

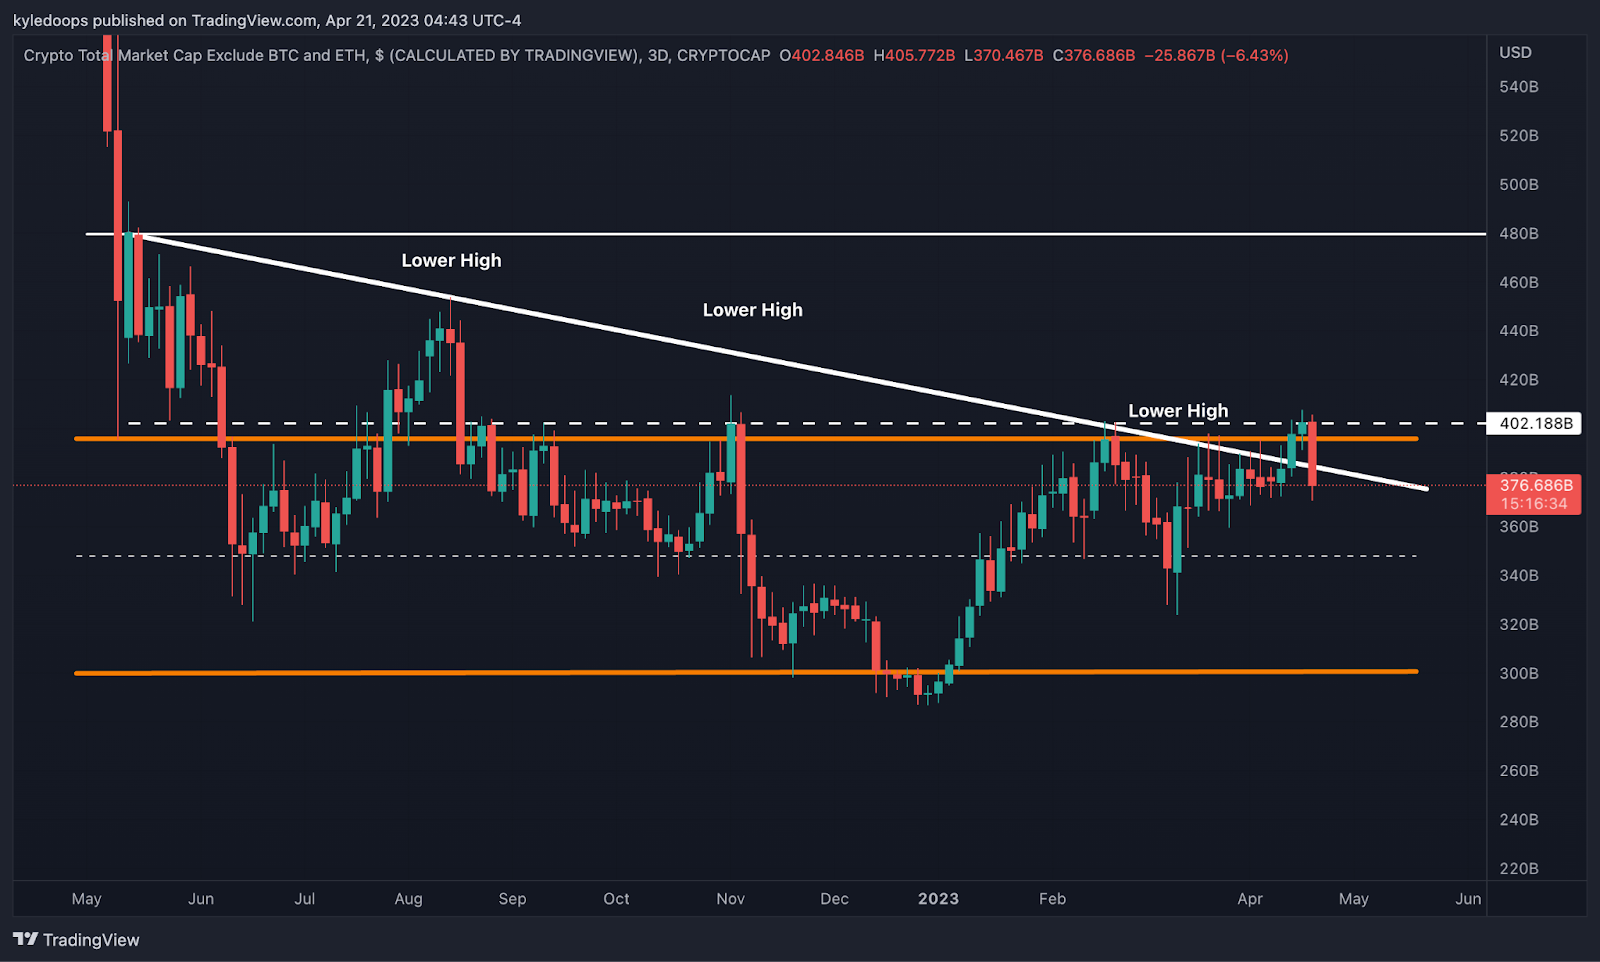
Chart #3 - TOTAL3 3-Day Chart
Chartist: Kyle
(For the chart screenshot, click here.)
The TOTAL3 has broken back below the $396B level, which was the prior range high - that is the zone where participants were looking for prices to flip resistance back into support.
Failure to reclaim that level soon will probably mean this was a bull trap for the altcoin market. For those who are new here, a bull trap means bulls bought a false breakout and are now trapped in long positions.
Claim your Bitget sign-up bonuses here (details below).
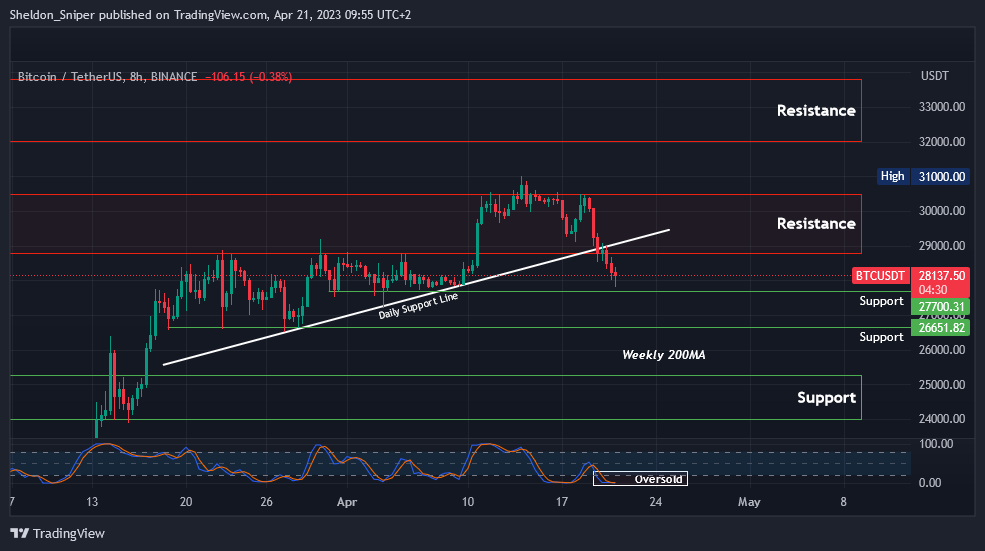
Chart #4 - Bitcoin (BTCUSDT) 8-Hour Chart
Chartist: Sheldon
(For the chart screenshot, click here.)
Bitcoin has dropped over $2,500 in the last two days, from around $30,500, to $28,000.
The STOCH RSIs on medium time frames are oversold and the price is getting very close to areas that could hold as support. So we may see a trend reversal and re-test of $28,800 soon.
Areas of support to look out for are $27,700, $26,650, and the 200 weekly Moving Average at just below $26,000. The most important area of support is lower, between $24,000 - $25,300 - an area last tested in the middle of last month.
Claim your Bitget sign-up bonuses here (details below).
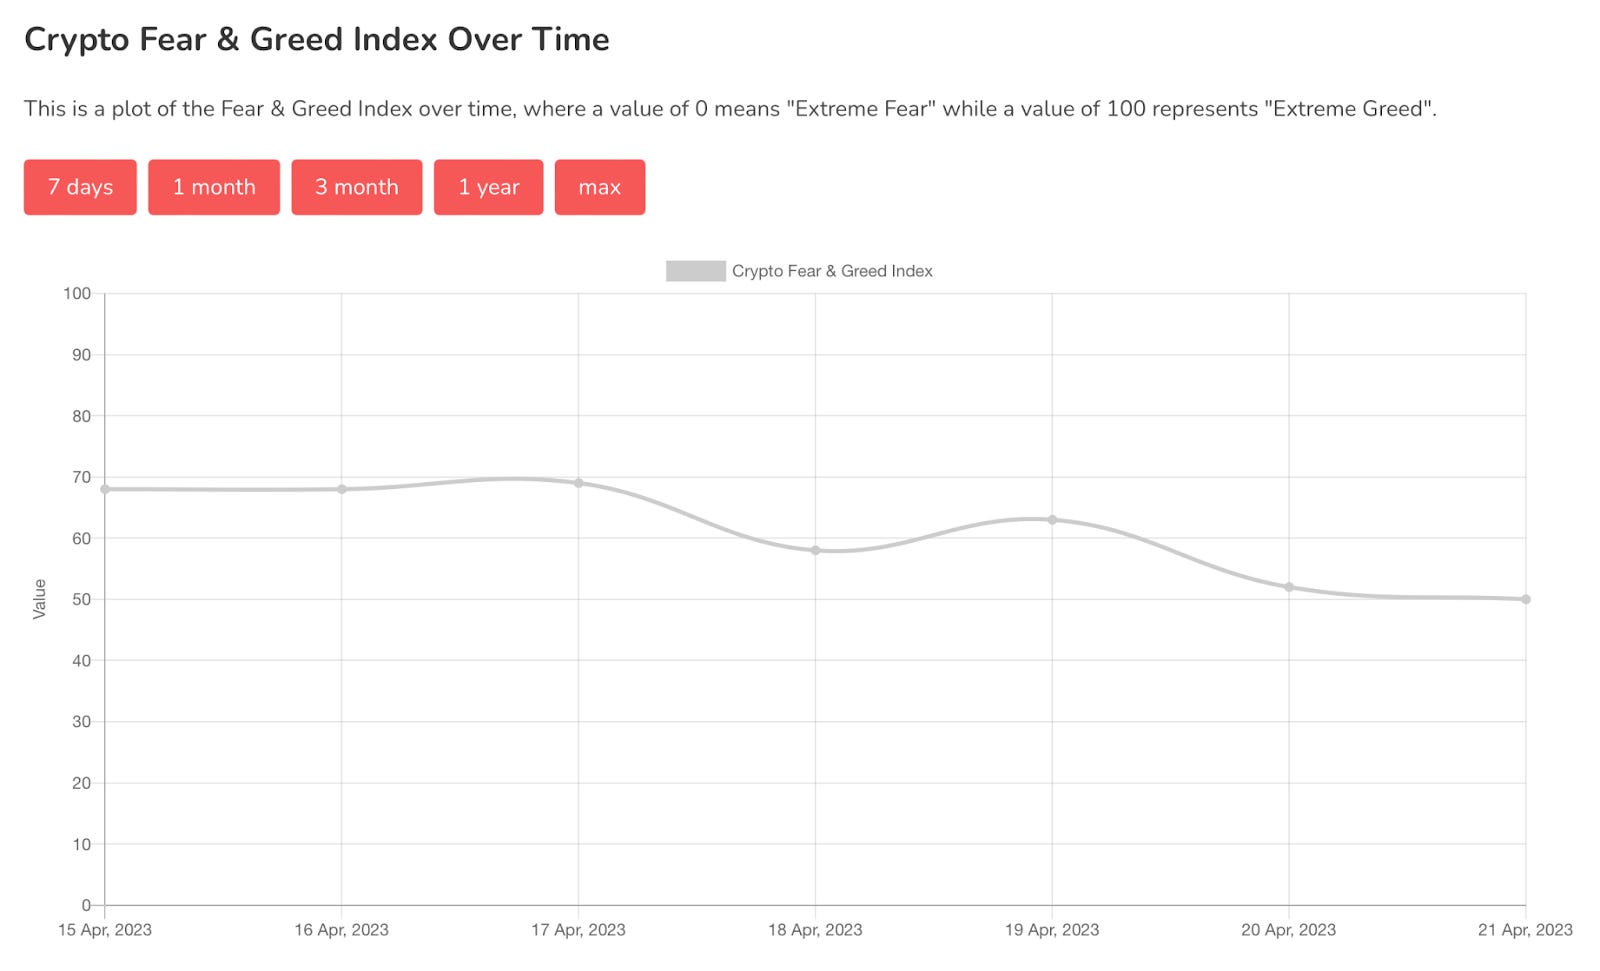
Chart #5 - Bitcoin Fear and Greed Index
The Bitcoin Fear and Greed Index is sitting at 50 today, Neutral.
The highest the index has been over the past seven days is 69, and the lowest is 50.
Banter’s Take
There is a lot of pressure to the downside since volume is low and buyers are failing to step into the market. Bulls are better off waiting for key levels to be reclaimed, as opposed to attempting to catch a falling knife.
The weekly close will be important in confirming whether this is a bull trap or not.
Stay safe my friends!
Go to our Crypto Banter Discord here where Sheldon and Kyle give updates on the charts and trades from The Daily Candle newsletter!
Bybit winner - 53338176