

📈📉 Is THIS Alt About To 2x?
📈📉 Is THIS Alt About To 2x?
PLUS: BTC as LOW as $52K?
Overview
Chart #1 - Theta Network (THETAUSDT) Daily
Chart #2 - Pyth Network (PYTHUSD) 12-Hour
Chart #3 - THORChain (RUNEUSDT) Daily
Chart #4 - Crypto Total Market Cap (TOTAL) Weekly
Chart #5 - Fear and Greed Index
Chart #1 - Theta Network (THETAUSDT) Daily
Chartist: Sheldon
(For the chart screenshot, click here.)
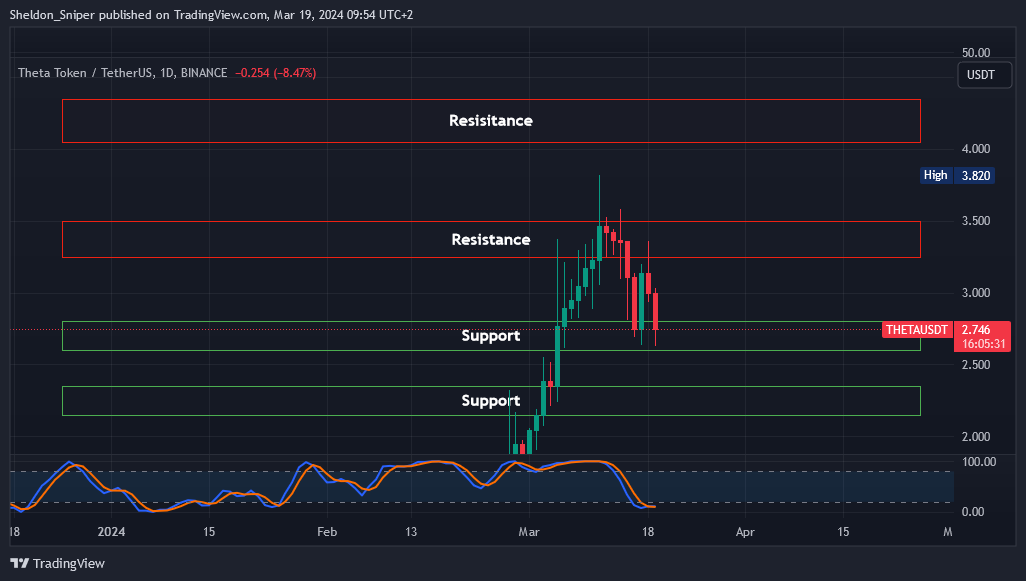
THETA has been doing great!
Once it finds support, it could bounce hard! And that means we will trade it on Bybit!
Entry: Theta is currently trading in the $2.60 - $2.80 area of support, but I think there is a chance of getting a lower entry at the next area of support at $2.15 - $2.35.
Take Profit (TP): At the next areas of resistance,
TP1: $3.25 - $3.50 (50% - 63%)
TP2: $4.05 - $4.35 (88% - 102%)
Stop Loss: Just below $1.90
An entry at $2.15 with a TP at $4.35 is over a 2x!
Chart #2 - Pyth Network (PYTHUSD) 12-Hour
Chartist: Kyle
(For the chart screenshot, click here.)
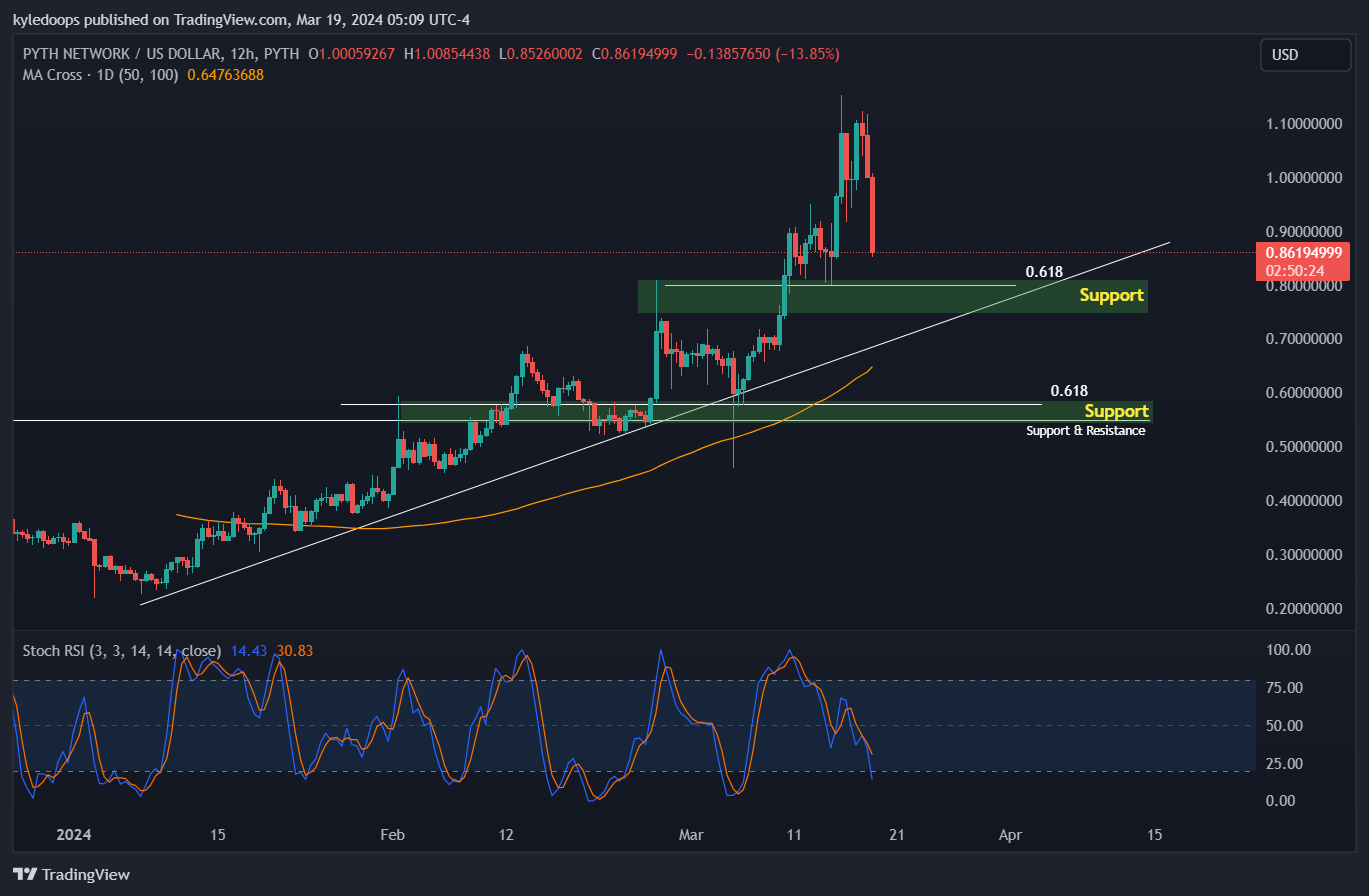
PYTH is moving towards an area of interest.
What was resistance can turn into support with the 0.618 Fib there. We’ll DCA and look for a change in structure as price enters into the 2 support zones above.
We’ll look to DCA for a longer-term hold in both areas of interest.
Buy Zones: $0.55 and $0.8
TP1: $1
TP2: $1.8
TP3: Price discovery
Stop Loss: Daily close below $0.50
Claim your Bitget sign-up bonuses here (details below).

Outsmart 99% Of The Market!
Get full access into our Discord And Telegram group, where you'll find all of our premium content!
👉 Trade Signals!
👉 Trade Set-Ups!
👉 Trading Challenges!
👉 Education!
👉 SO MUCH MORE!
Chart #3 - THORChain (RUNEUSDT) Daily
Chartist: Kyle
(For the chart screenshot, click here.)
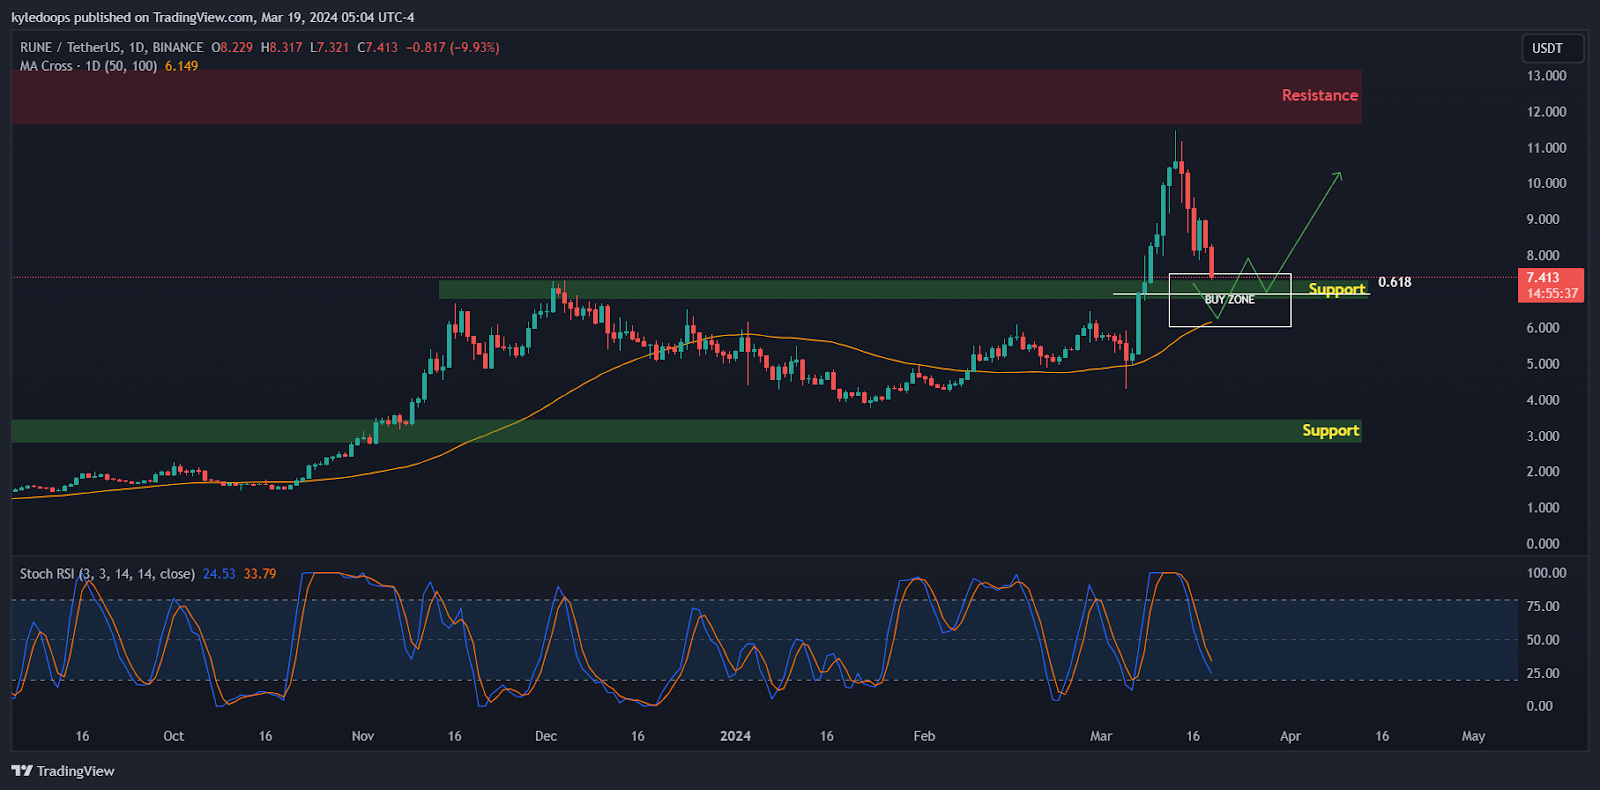
Like PYTH, RUNE’s resistance could turn into support.
We will DCA in this zone and keep dry powder for lower levels (like $4) in case we do get a major sell-off.
Buy Zone 1: $6 to $7.5
Buy Zone 2: $4.2 to $5.2
TP1: $13
TP2: $20
TP3: Price discovery
Soft Stops: Daily close below $5
Hard Stop: Daily close below $3
Claim your Bitget sign-up bonuses here (details below).
Chart #4 - Crypto Total Market Cap (TOTAL) Weekly
Chartist: Sheldon

(For the chart screenshot, click here.)
Last week the TOTAL got rejected at $2.70T and has now retraced to test lower levels of support.
With the next major support at $2.05T - $2.20T, it could go lower!
I believe the alts will bounce hard once the market finds support. We will prepare our trades on Bitget before that happens.
Chart #5 - Fear and Greed Index
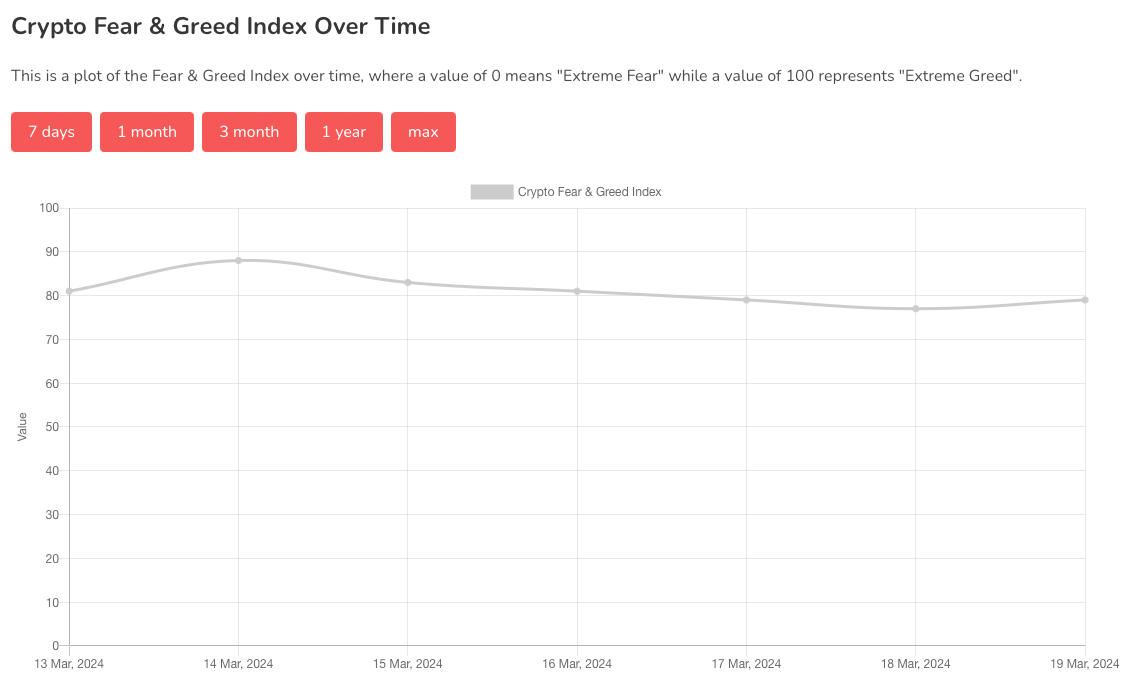
The Fear and Greed Index is sitting at 79 today, indicating Extreme Greed.
The highest the index has been over the past seven days is 88, and the lowest is 77.
Banter’s Take
On yesterday's show, I outlined that the price of BTC needs to reclaim the pivot level of $69K for the bulls to remain in control. We failed to reclaim this level, and the liquidations continue. We have been calling for a healthy pullback in the markets, and we are subsequently getting that now.
We’ll check to see if a local top is confirmed by a potential pullback breaking below $60,000, deviating downwards to a 50% retracement level at $56,000. Alternatively, consider the previous order block outlined at the $52,000 zone. On a higher time frame (HTF), these could be excellent areas to consider for adding positions during the bull run.
Stay safe my friends!
Go to our Crypto Banter Discord here where Sheldon and Kyle give updates on the charts and trades from The Daily Candle newsletter!