

📈📉 Is THIS the START of a 60-Day Pullback?
📈📉 Is THIS the START of a 60-Day Pullback?
PLUS: THIS Coin Can't Stop RISING!
Overview
Chart #1 - U.S. Dollar (DXY) Daily
Chart #2 - Kaspa (KASUSDT) 4-Hour
Chart #3 - Bitcoin (BTCUSD) Daily
Chart #4 - Ethereum (ETHUSDT) Daily
Chart #5 - Fear and Greed Index
Chart #1 - U.S. Dollar (DXY) Daily
Chartist: Sheldon
(For the chart screenshot, click here.)
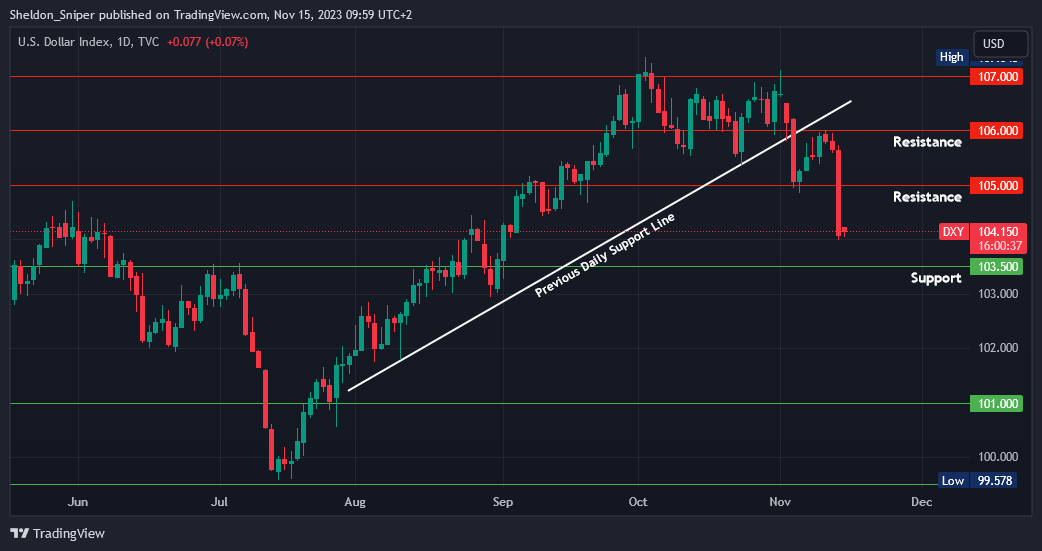
Yesterday, following the release of the US CPI news, the DXY experienced a significant drop, falling from around 105.80 down to 104.00, as capital shifted from the US Dollar to risk-on assets.
The DXY is still currently at 104.00. The next major support level is at 103.50.
If the DXY reverses and moves upwards, the next resistance is at 105.00. A continued downward trend for the DXY will be very bullish for the markets.
Sign-up and trade on Bybit today.
Exclusive $30,000 deposit rewards and bonuses up for grabs!
Chart #2 - Kaspa (KASUSDT) 4-Hour
Chartist: Kyle
(For the chart screenshot, click here.)
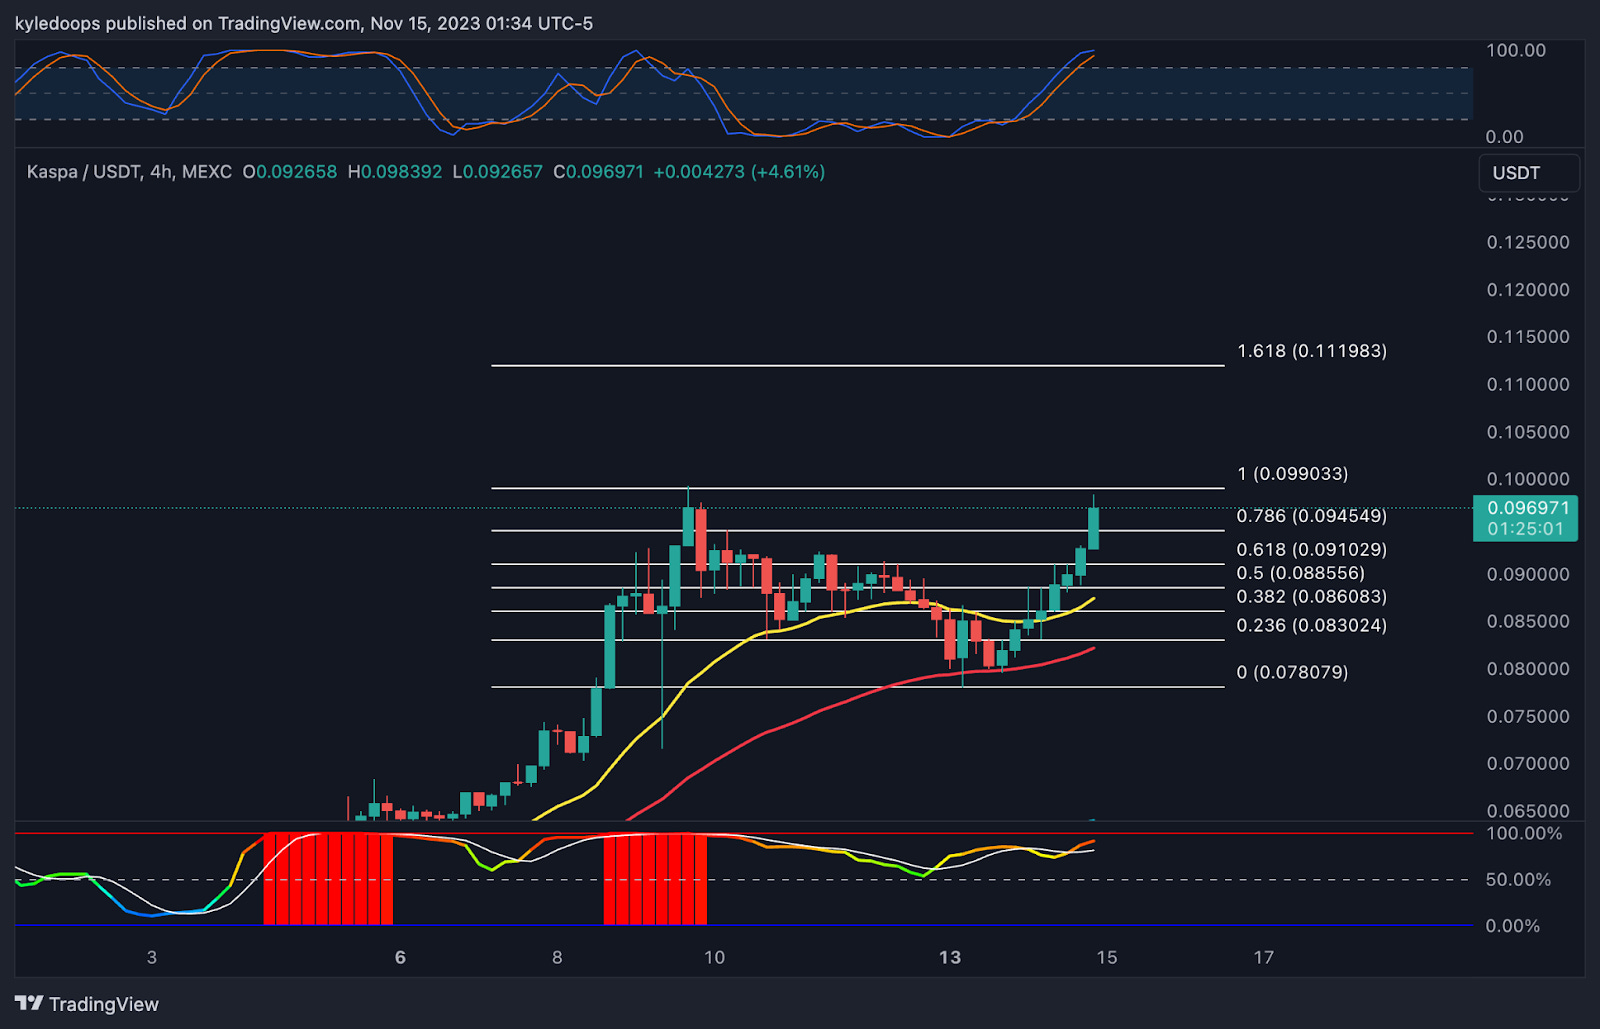
KAS continues to climb with its next target in sight at the 1.618 Fibonacci level, which is a price target of $0.11.
Definitely a market leader and a coin operating in its own world, this one continues to soar to new highs week after week.
Claim your Bitget sign-up bonuses here (details below).

Outsmart 99% Of The Market!
Get full access into our Discord And Telegram group, where you'll find all of our premium content!
👉 Trade Signals!
👉 Trade Set-Ups!
👉 Trading Challenges!
👉 Education!
👉 SO MUCH MORE!
Chart #3 - Bitcoin (BTCUSD) Daily
Chartist: Kyle
(For the chart screenshot, click here.)
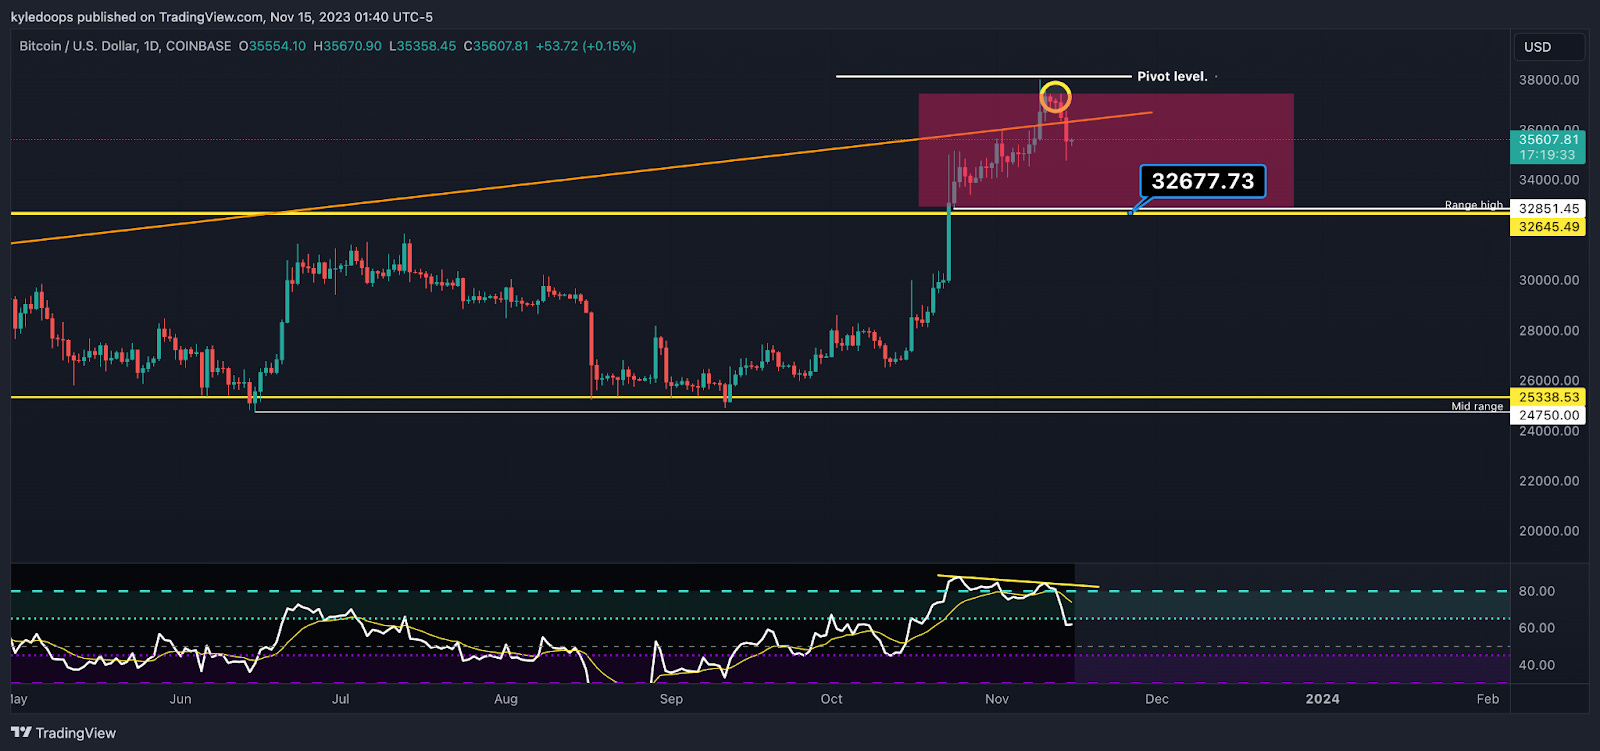
Risk is shifting back towards the downside for Bitcoin, with its bearish divergence having sent prices lower.
Next support is at $32,000, which is a critical level that needs to hold. Failure to hold $32,000 would put higher timeframe risk towards the downside too and confirm a deviation back into the range.
It would make a lot of sense for Bitcoin to come and test that $32,000 at some point, so plan accordingly.
All of this year's pullbacks were over a 60-day period once putting in a local top.
Therefore, be prepared for that.
Claim your Bitget sign-up bonuses here (details below).
Chart #4 - Ethereum (ETHUSDT) Daily
Chartist: Sheldon
(For the chart screenshot, click here.)
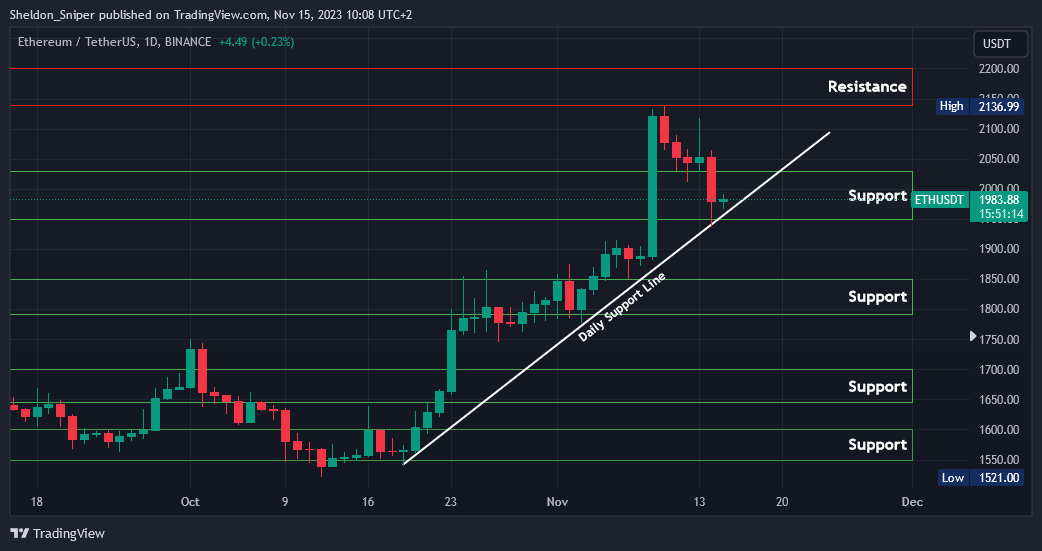
On Friday, ETH was rejected at $2,130 and has since retraced to the bottom of the range support at $1,950, as well as its daily ascending support line.
The price is currently trading at $1,980 and could consolidate in the $1,950 - $2,030 range for the next few days before possibly testing the next resistance area at $2,130 - $2,200.
Claim your Bitget sign-up bonuses here (details below).
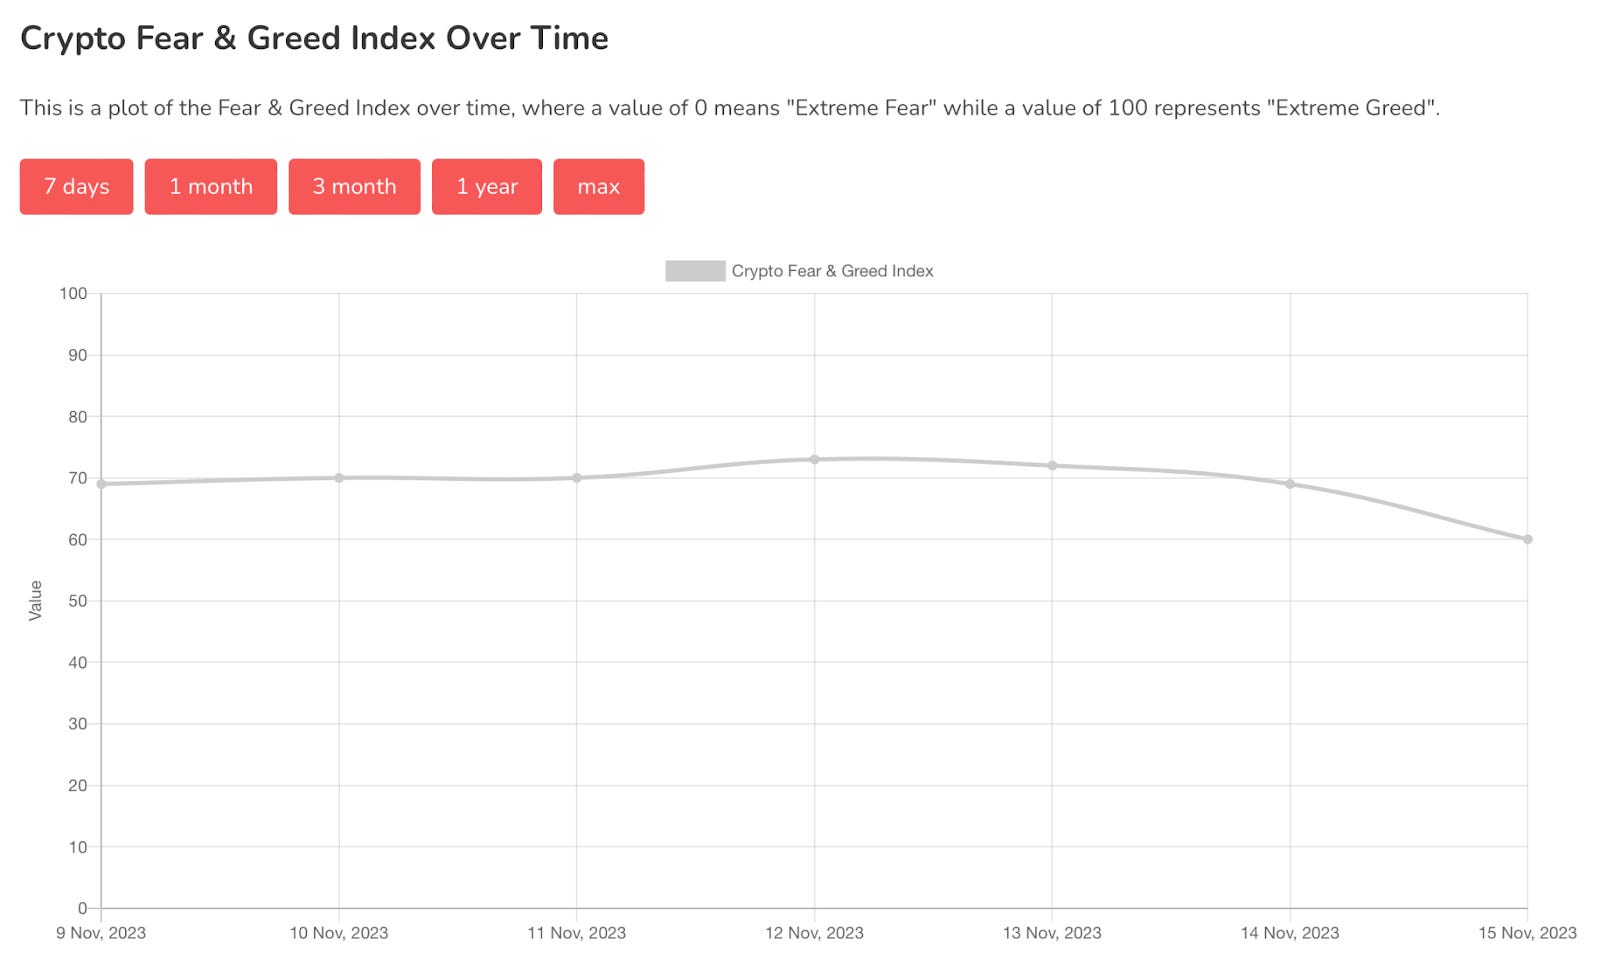
Chart #5 - Fear and Greed Index
The Fear and Greed Index is sitting at 60 today, indicating Greed.
The highest the index has been over the past seven days is 73, and the lowest is 60.
Banter’s Take
The stock market is experiencing a significant upswing, approaching All-Time-High levels, while the crypto market is undergoing a pullback.
Throughout this year, crypto and the stock market have shown a lack of correlation, maintaining their independent trajectories on a short-term basis.
Stay safe my friends!
Go to our Crypto Banter Discord here where Sheldon and Kyle give updates on the charts and trades from The Daily Candle newsletter!