

📈📉 Is this the start of a major pullback? Solana at crucial level of support!
📈📉 Is this the start of a major pullback? Solana at crucial level of support!

Bitget winner - 3493084994
Wondering what that 👆 is and how you can win? Then check out our daily shows on YouTube!
Are you using Bybit instead? Then look for the winning Bybit account below. But if you want to double your chances of winning, sign up today to both exchanges with the links found in the description of our YouTube videos!
Good luck to all!
Chart #1 - Solana (SOLUSDT) 12-Hour Chart
Chartist: Sheldon

(For the chart screenshot, click here.)
The last four weeks have been kind to SOL, as it has moved from below $10 to yesterday’s high of $26.80. But this morning brought a minor pullback, and it could be the start of a greater one.
Over the last ten days, SOL has been ranging between $24 - $26, with it currently sitting on the ascending daily support line ($24). If that level breaks, the next support is around $17.50 - $19. If that level subsequently breaks, we are looking at SOL reaching between $13 - $15.
Those levels of support could very well be great places to take long trades, but that also depends on bitcoin and the stock market cooperating.
On the other hand, if SOL moves higher from here, the next area of resistance is roughly $27 - $29.
Check our Crypto Banter Discord here for updates!
Follow me on Twitter for urgent updates on my trading progress!
Claim your Bitget sign-up bonuses here (details below).
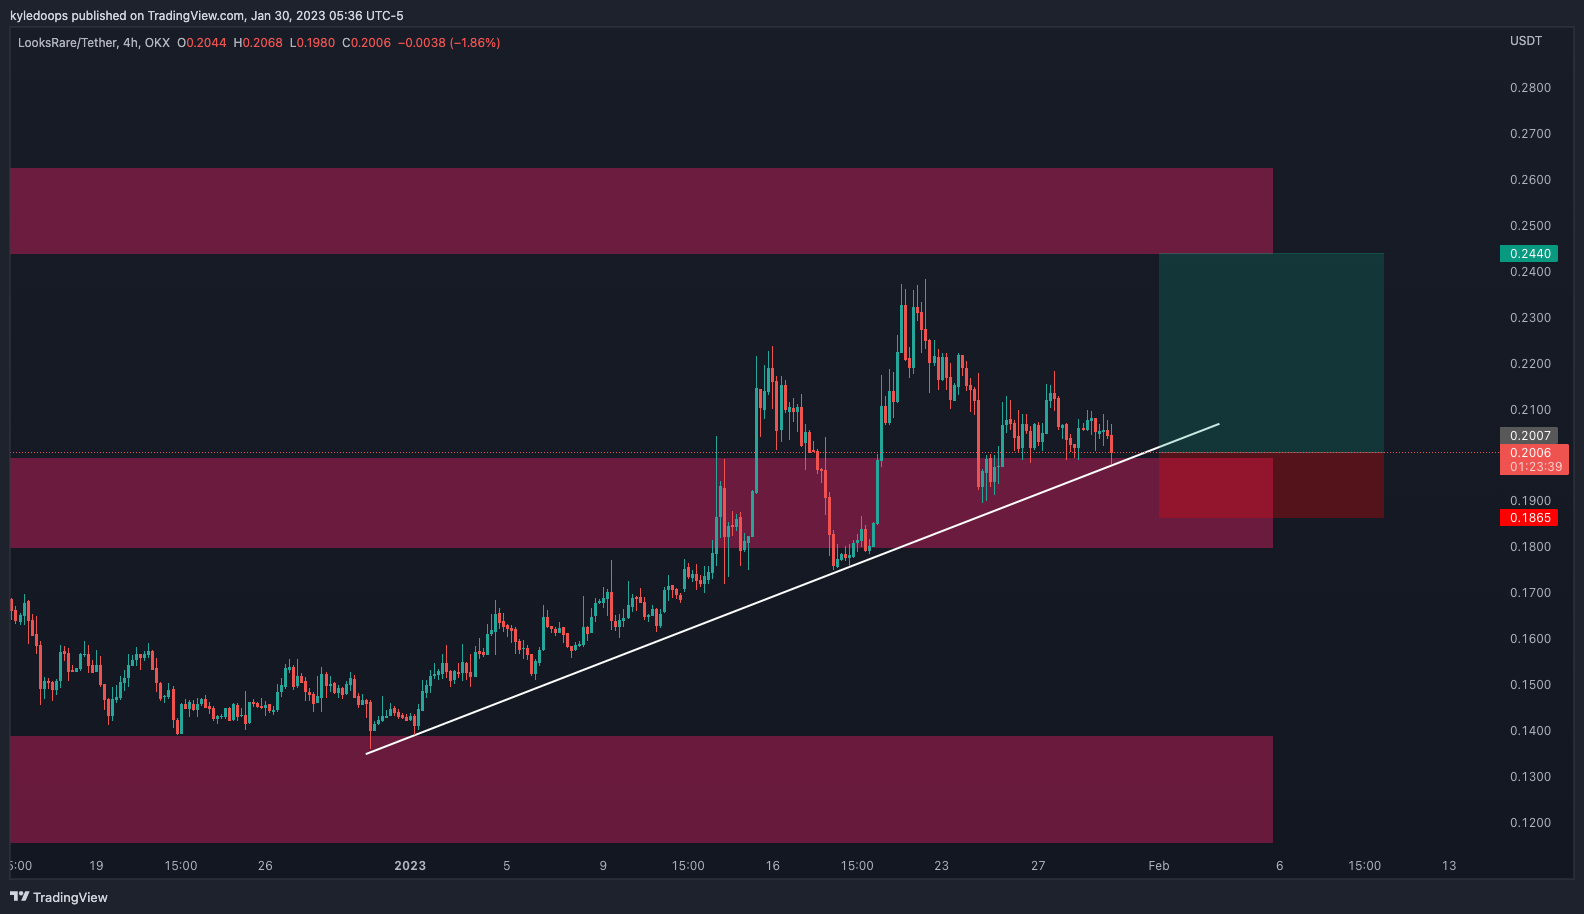
Chart #2 - LooksRare (LOOKSUSDT) 4-Hour Chart
Chartist: Kyle
(For the chart screenshot, click here.)
LOOKS seems to be holding relative strength. If the market rebounds from this sell-off, a long trade may be in play - so long as LOOKS holds above the diagonal trend line (the white one).
The trade would provide a 1:3 risk-to-reward ratio, and I would place my stop loss below the prior higher-low.
Bitcoin is pulling back right now, but if it bounces, this trade will more than likely play out. And if bitcoin makes it to $25,000 before the FOMC, then it is a pretty clear trade setup.
Check our Crypto Banter Discord here for updates!
Make sure to follow me on Twitter, where I will post updates on my trades as they unfold!
Claim your Bitget sign-up bonuses here (details below).
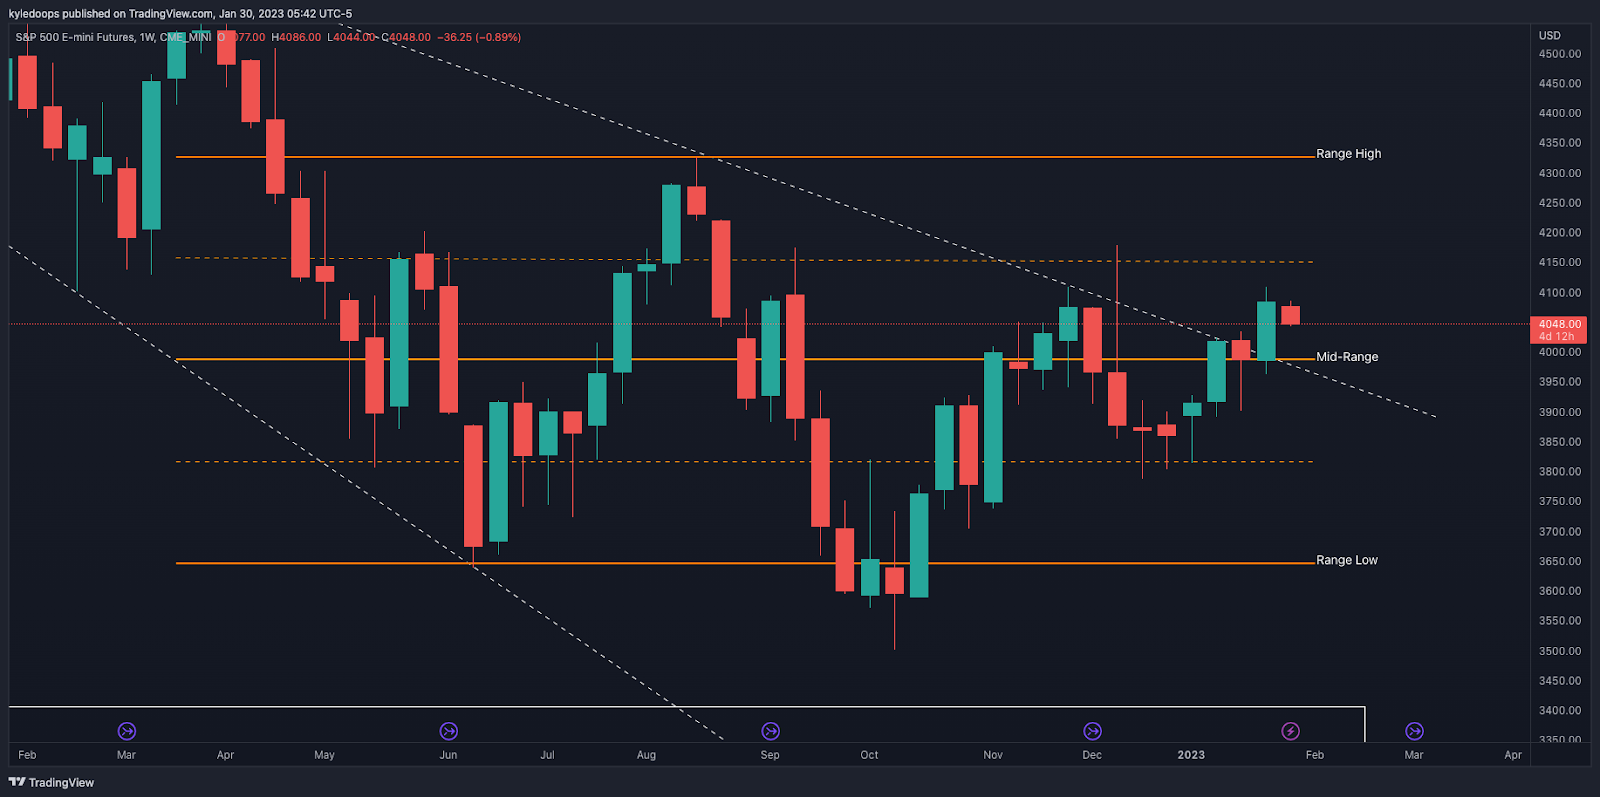
Chart #3 - S&P 500 E-mini Futures (ES1!) 1-Week Chart
Chartist: Kyle
(For the chart screenshot, click here.)
The stock market had a convincing break above its diagonal trend line (marked by the upper dashed line).
Bulls will now be looking for the price to hold above the mid-range, which would confirm the breakout above that trend line.
A loss of the mid-range may be perceived as a deviation and, therefore, a bull-trap.
Check our Crypto Banter Discord here for updates!
Make sure to follow me on Twitter, where I will post updates on my trades as they unfold!
Claim your Bitget sign-up bonuses here (details below).
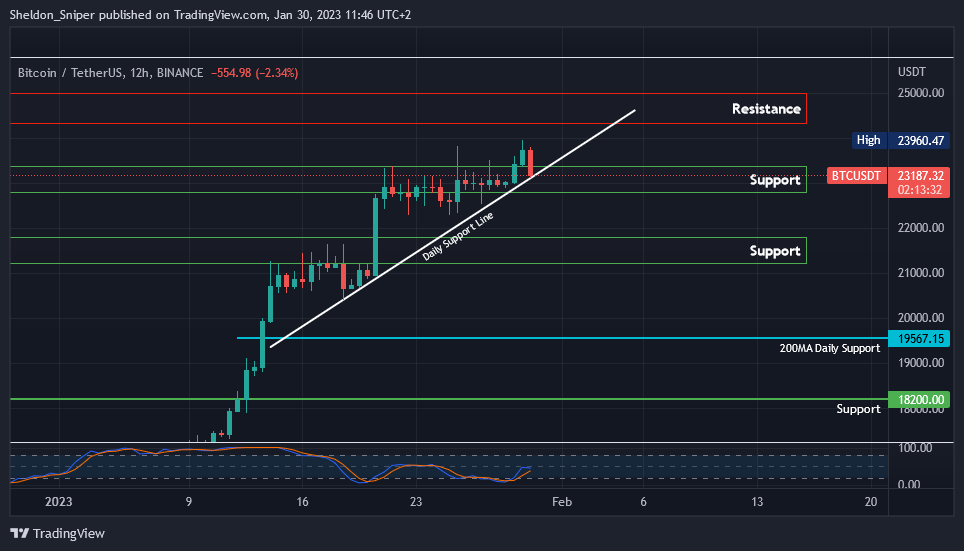
Chart #4 - Bitcoin (BTCUSDT) 12-Hour Chart
Chartist: Sheldon
(For the chart screenshot, click here.)
Bitcoin had a significant run over the last month, with no real pullback to retest lower support levels. However, this morning brought that pullback, and it could be the start of a much bigger one.
The price is currently at $23,000 (support). That is also where its daily ascending support line is. If $23,000 breaks, the next levels of support are at $21,300 - $21,800, followed by the daily 200MA at around $19,500, and then $18,200. If BTC recovers from here and attempts to move higher, the next resistance is around $24,600 - $25,000.
I expect some volatility in the markets going into Wednesday’s FOMC meeting, so many pro traders might decide to stay on the sidelines until the latter part of the week brings more clarity.
Check our Crypto Banter Discord here for updates!
Follow me on Twitter to get all the updates on my personal trading progress!
Claim your Bitget sign-up bonuses here (details below).
Chart #5 - Bitcoin Fear and Greed Index
The Bitcoin Fear and Greed Index is sitting at 61 today, indicating Greed.
The highest the index has been over the past seven days is 61, and the lowest is 51.

Bybit winner - 28492250
Overall Market Sentiment (Banter’s Take)
It is arguably the biggest economic week markets have had in a very long time.
We have technical levels across multiple assets at key levels, with huge earnings reports coming out throughout the week. But most importantly, we have the FOMC meeting on Wednesday.
Professional traders are likely to sit on the sidelines until the market digests all the new info and, thereafter, look for the next major trade set-up.
Stay safe my friends!