

📈📉 Join the Elite: Prove Your Skills in the Ultimate Crypto Trading Challenge!
📈📉 Join the Elite: Prove Your Skills in the Ultimate Crypto Trading Challenge!

🔥 Trade to Triumph 🔥
Win a Tesla, Rolex & $10,000 Cash!
Don't miss this extraordinary ByBit trading competition by Crypto Banter & Gareth Soloway which begins tomorrow! Unleash your trading skills for a chance to win a Tesla, Rolex, and $10,000 cash prizes. Secure your spot in this unrivaled contest now and elevate your crypto trading journey.
Register here to join the elite trader's league!
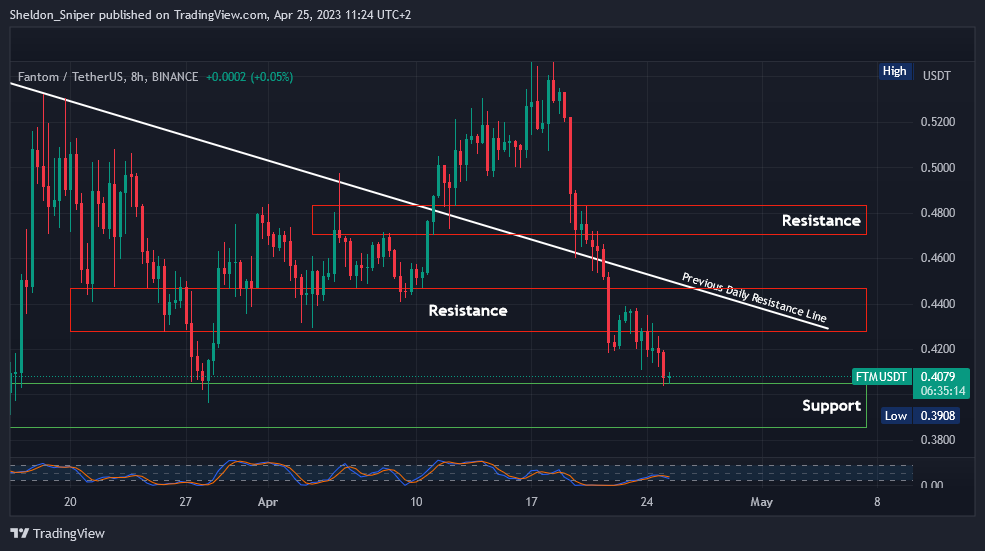
Chart #1 - Fantom (FTMUSDT) 8-Hour Chart
Chartist: Sheldon
(For the chart screenshot, click here.)
FTM retraced with the rest of the market and is now testing the all-important $0.3800 - $0.4050 zone.
If it can stabilize in this area and find support, we may see a trend reversal, sending FTM up to test $0.4300 - $0.4450 (daily descending resistance line). If that level breaks, FTM will head to $0.4700 - $0.4850.
However, if FTM loses the current $0.3800 - $0.4050 area of support, the next crucial one is between $0.3500 - $0.3600.
𝗣𝗿𝗶𝗺𝗲 𝗫𝗕𝗧
Sign up for a new Trading Account on Prime XBT!
Receive a deposit bonus of up to $7,000 with promo code: SheldonSniper
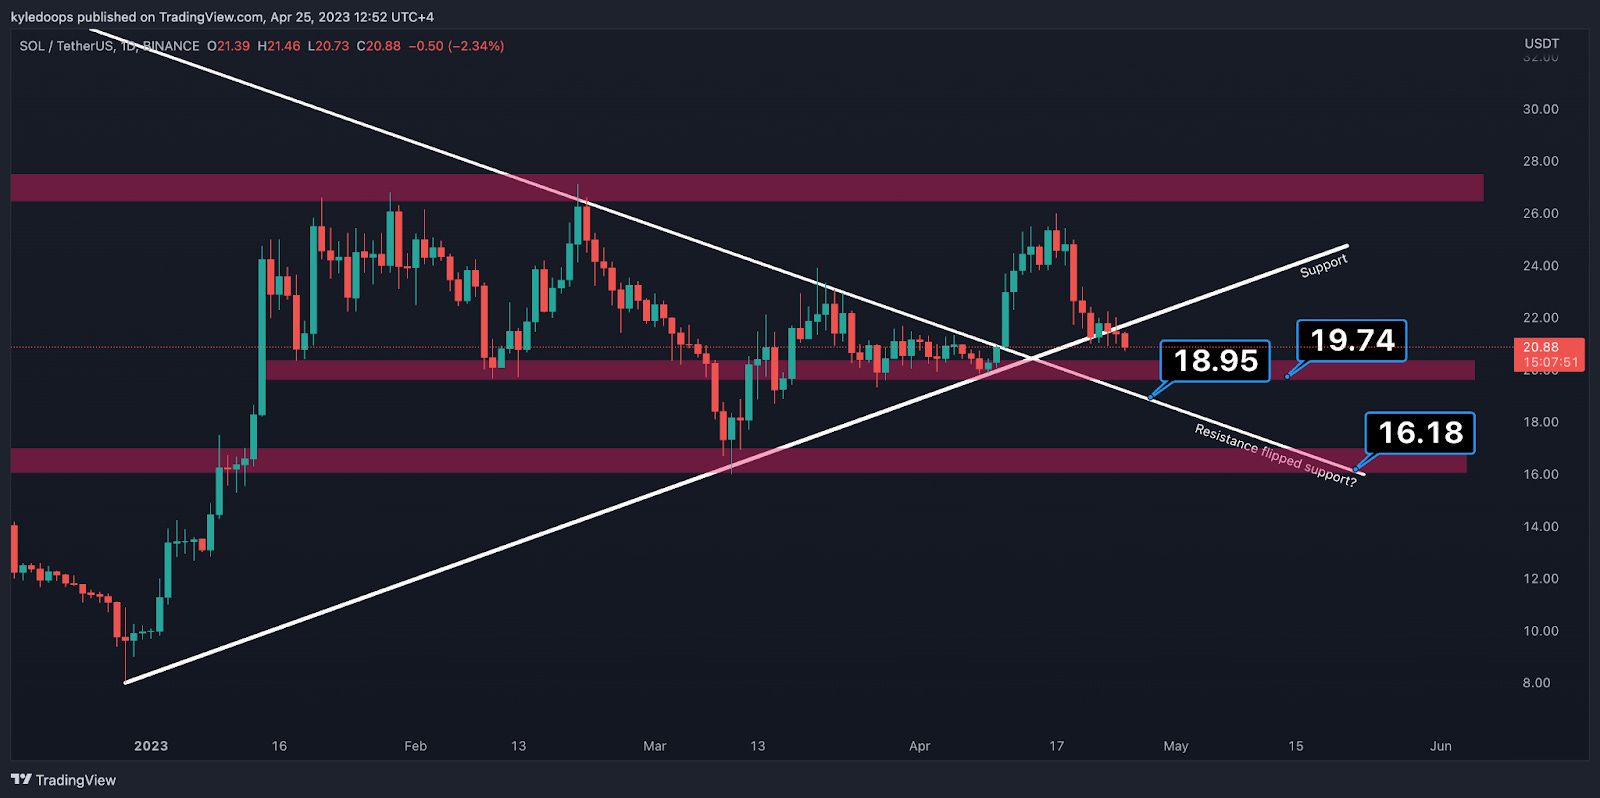
Chart #2 - Solana (SOLUSDT) 1-Day Chart
Chartist: Kyle
(For the chart screenshot, click here.)
SOL has started to lose its diagonal supporting trend line, which means that it's now time to start looking toward the next levels of support as areas of interest.
The $19.70 horizontal support level is a potential bounce area, followed by $18.95. And then if things get really ugly for bulls, we would be looking at $16.18. One of these regions should provide a small bounce though.
If they don’t, and the $16.00 horizontal support level is lost, SOL could revisit its lows again.
𝗣𝗿𝗶𝗺𝗲 𝗫𝗕𝗧
Sign up for a new Trading Account on Prime XBT!
Receive a deposit bonus of up to $7,000 with promo code: KyleDoops

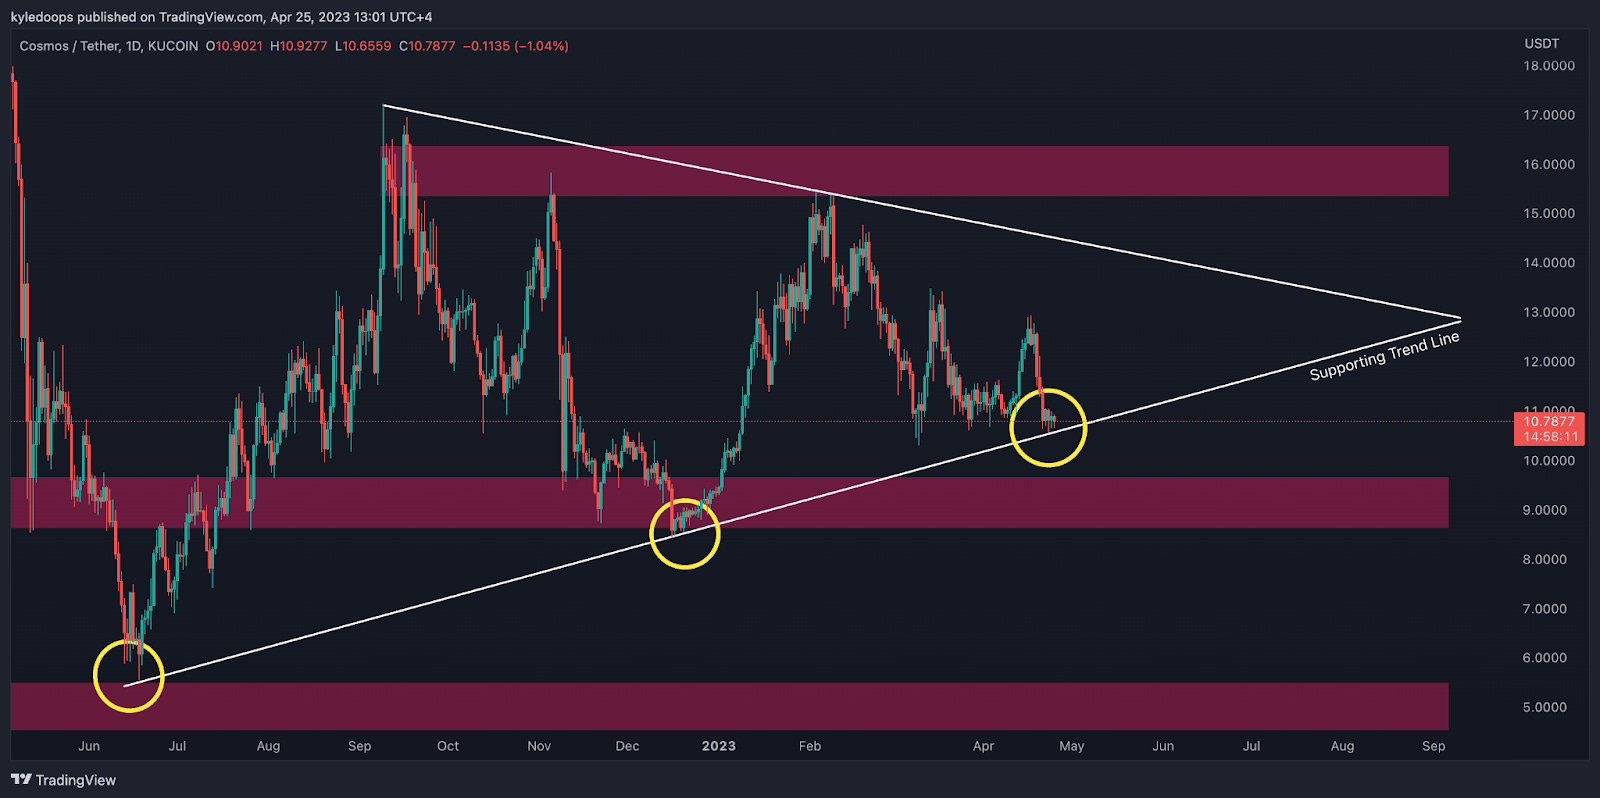
Chart #3 - Cosmos Hub (ATOMUSDT) 1-Day Chart
Chartist: Kyle
(For the chart screenshot, click here.)
ATOM is coming directly into diagonal support based on a trend line that was established in June.
This will be the third touch of that line, and it takes three touches to properly establish a trend line. A bounce from this area is probable.
Should the level break, expect a move back down to $8.70. ATOM will likely bounce off of there.
Claim your Bitget sign-up bonuses here (details below).
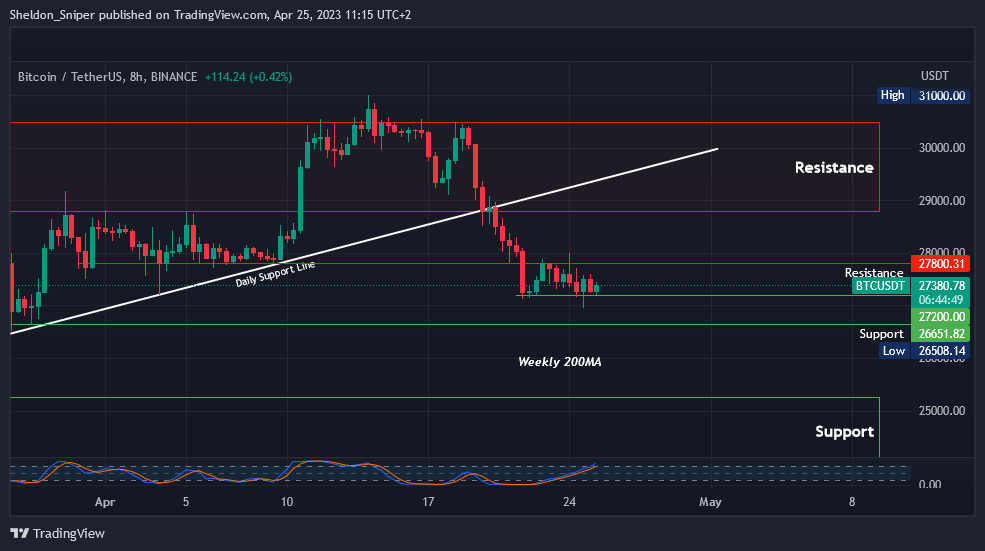
Chart #4 - Bitcoin (BTCUSDT) 8-Hour Chart
Chartist: Sheldon
(For the chart screenshot, click here.)
On Friday, bitcoin found support at $27,200, and since then it has been consolidating in a tight range between $27,200 and $27,800 (resistance).
Currently, there is no clear path for BTC, but if $27,200 breaks, the next support is at $26,650, followed by the weekly 200 MA at roughly $26,000. But critical support is sitting at around $24,800 - $25,250, where a lot of side-lined buyers will be waiting patiently.
If the price breaches $27,800, it will test the next resistance between $28,800 - $30,500 (support flipped to resistance).
Claim your Bitget sign-up bonuses here (details below).
Chart #5 - Bitcoin Fear and Greed Index
The Bitcoin Fear and Greed Index is sitting at 53 today, Neutral.
The highest the index has been over the past seven days is 63, and the lowest is 50.

Overall Market Sentiment (Banter’s Take)
As long as bitcoin can close some daily candles above $26,500, it's likely it will have a substantial bounce in the days to come. We would also not rule out a wick down to the $25,000 region. If that happens, bitcoin would need to rally back up quickly and close above $26,500 to keep hope alive for the bulls.
Sideways movement would allow momentum oscillators to reset, giving bulls another chance.
Stay safe my friends!
Go to our Crypto Banter Discord here where Sheldon and Kyle give updates on the charts and trades from The Daily Candle newsletter!