

📈📉 Kyle's GFAL and KAS Trade Setups!
📈📉 Kyle's GFAL and KAS Trade Setups!
The Market Is Showing Signs Of Pulling Back!
Overview
Chart #1 - Theta Token (THETAUSDT) Daily
Chart #2 - Games for a Living (GFALUSDT) Daily
Chart #3 - Kaspa (KASUSDT) Daily
Chart #4 - USDT Dominance (USDT.D) 3-Day
Chart #5 - Fear and Greed Index
Chart #1 - Theta Token (THETAUSDT) Daily
Chartist: Sheldon
(For the chart screenshot, click here.)
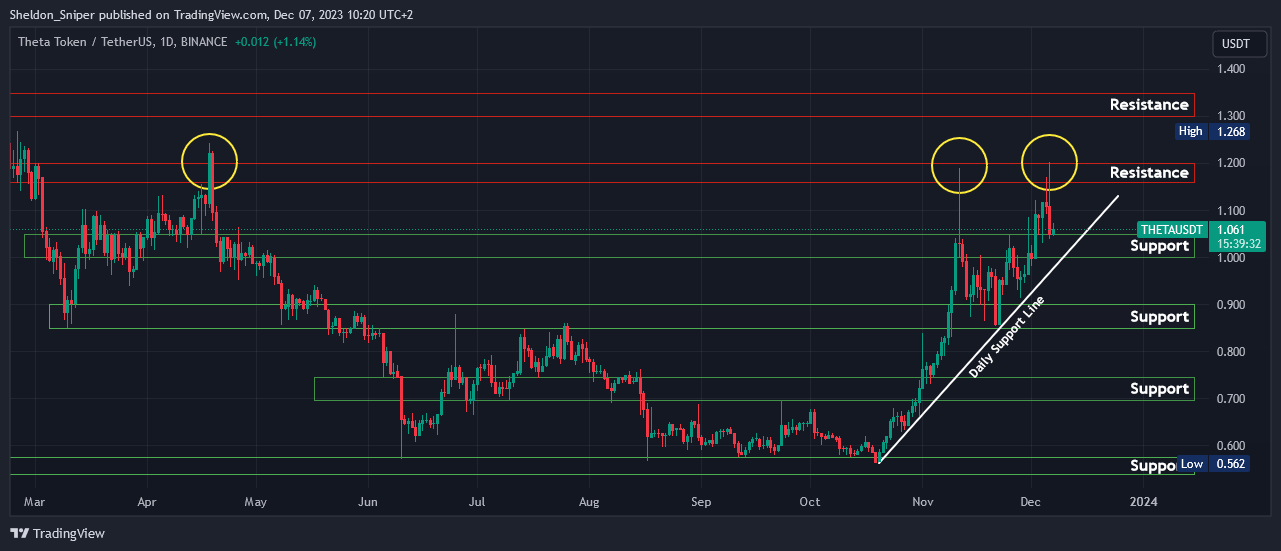
Yesterday, THETA got rejected at the $1.20 level of resistance, and overnight it has retraced all the way down to the $1.05 level of support.
The $1.20 level of resistance has been tested on two other occasions this year, where on both occasions the price has been rejected.
If it can hold support in the current $1.00 - $1.05 area, then there is a good chance for the price to once again rally to the upside to test the $1.20 resistance, or even the next area of resistance at $1.30 - $1.35.
Sign-up and trade on Bybit today.
Exclusive $30,000 deposit rewards and bonuses up for grabs!
Chart #2 - Games for a Living (GFALUSDT) Daily
Chartist: Kyle
(For the chart screenshot, click here.)
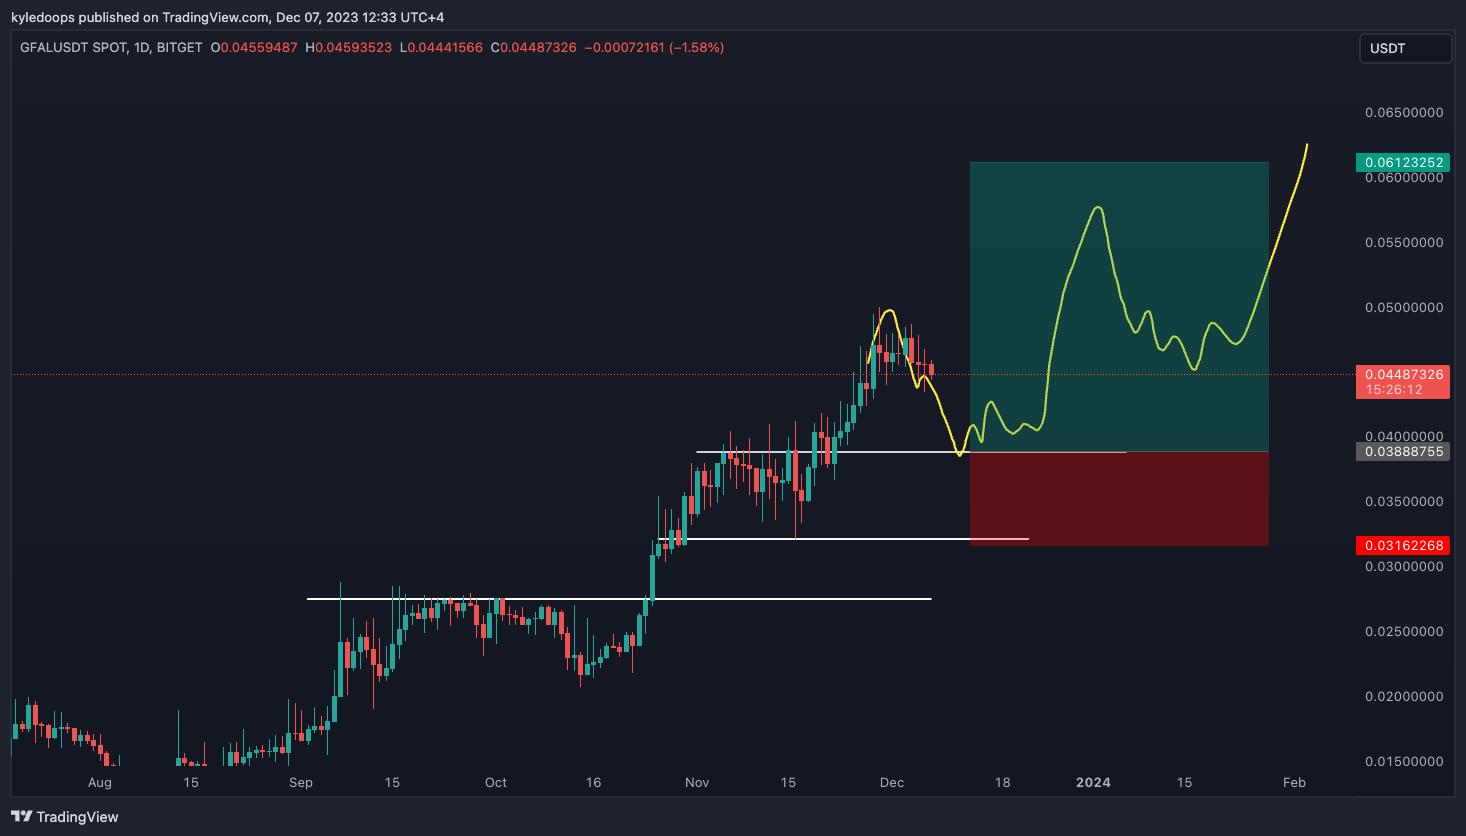
GFAL is pulling back slightly. I would look to buy the dip at $0.0388 with a hard stop loss at $0.0316.
Take profit has been set to $0.06123.
If you’re conservative and want to take on less risk, then zoom in and observe the price as it approaches the $0.0388 level.
Claim your Bitget sign-up bonuses here (details below).

Outsmart 99% Of The Market!
Get full access into our Discord And Telegram group, where you'll find all of our premium content!
👉 Trade Signals!
👉 Trade Set-Ups!
👉 Trading Challenges!
👉 Education!
👉 SO MUCH MORE!
Chart #3 - Kaspa (KASUSDT) Daily
Chartist: Kyle
(For the chart screenshot, click here.)
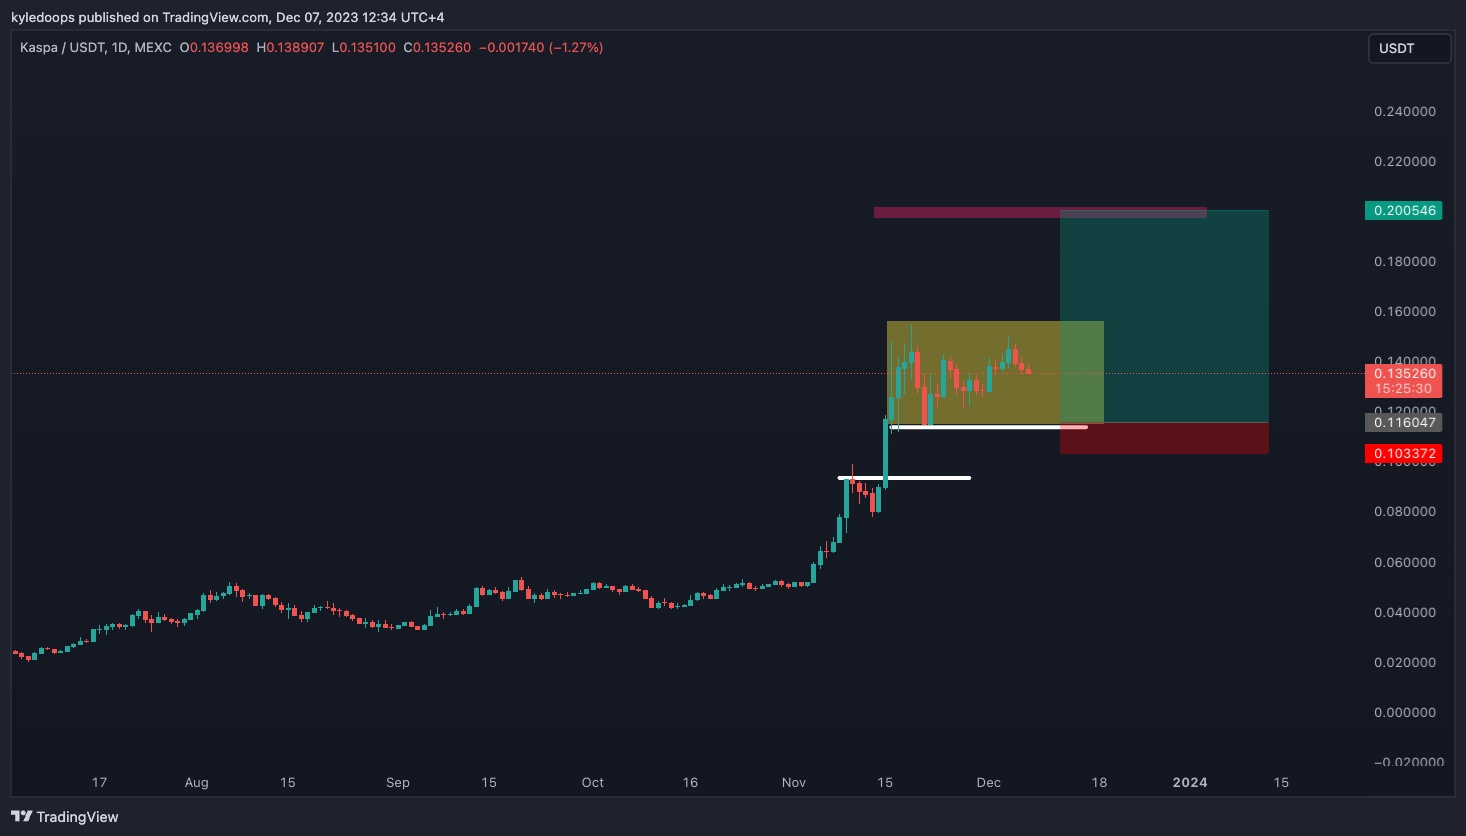
KAS is holding a tight range.
I would be looking to get long on a retest of the $0.11 region, with a tight stop slightly below at $0.103.
The bounce from this level could take the price up to the 1.618 Fibonacci extension at $0.20. That would be a profit-taking zone where a pullback is likely.
If you’re looking for a long-term hold, you can just keep riding the momentum and hold for higher returns in the months to come.
Claim your Bitget sign-up bonuses here (details below).
Chart #4 - USDT Dominance (USDT.D) 3-Day
Chartist: Sheldon
(For the chart screenshot, click here.)
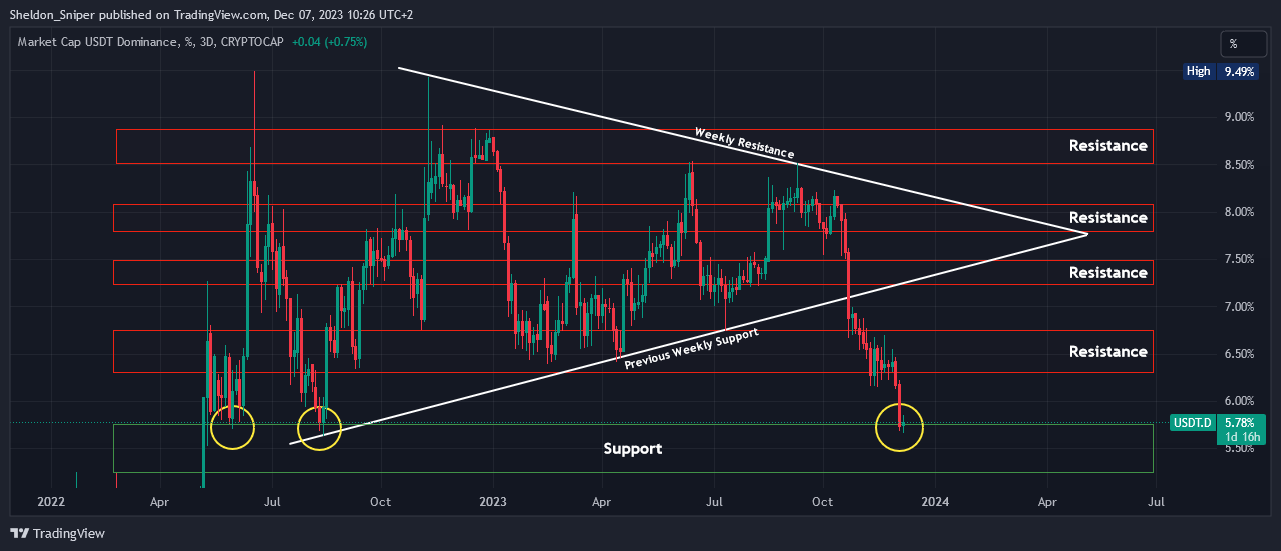
This week, USDT Dominance has retraced significantly.
This occurred as Bitcoin rallied by over 7%, resulting in many of the altcoins following suit. The move of cash out of USDT has resulted in the dominance dropping to the next major area of support, at 5.25% - 5.75%. The 5.75% level has been tested twice this year and seems to be a very strong level of support.
I am expecting a correction in the market at some stage, so I will be watching this current support area very closely, as a move up in the USDT Dominance will be bearish for the trading market.
To the upside, the next area of resistance is at 6.30% - 6.75%.
Claim your Bitget sign-up bonuses here (details below).
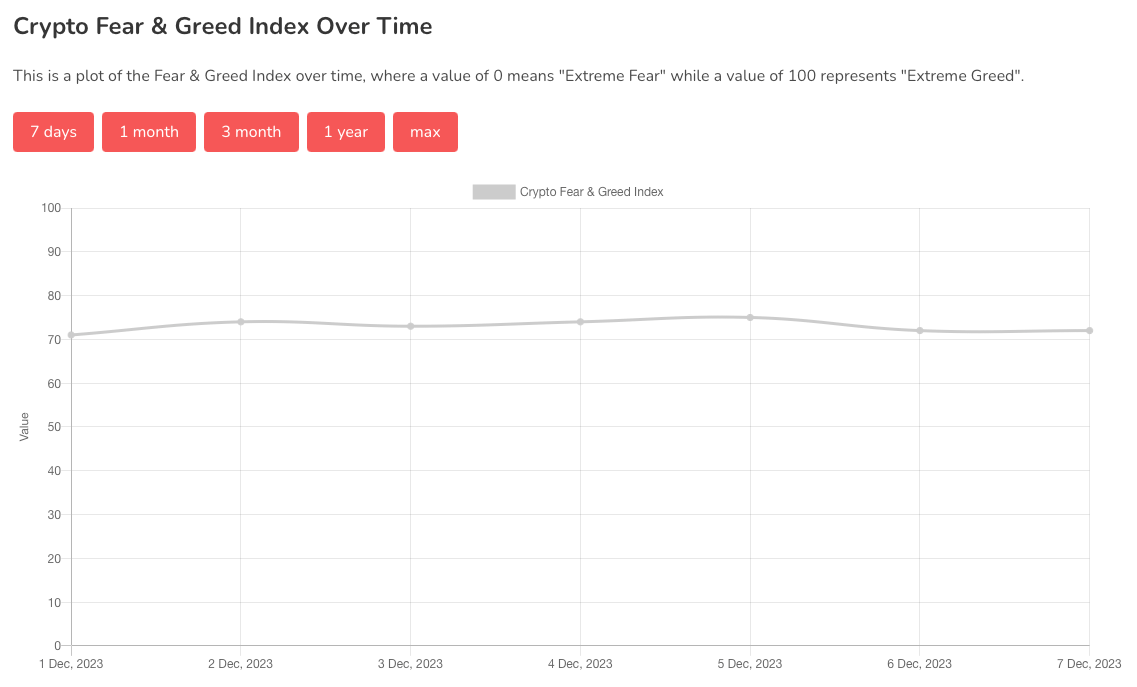
Chart #5 - Fear and Greed Index
The Fear and Greed Index is sitting at 72 today, indicating Greed.
The highest the index has been over the past seven days is 75, and the lowest is 71.
Banter’s Take
The market is showing signs of pulling back, but there is likely one more push up before the big pullback. Spots are selling and the price is still headed up, so sooner or later there will be a flush down.
Stay safe my friends!
Go to our Crypto Banter Discord here where Sheldon and Kyle give updates on the charts and trades from The Daily Candle newsletter!