

📈📉 LINK and ETH Trade Setups!
📈📉 LINK and ETH Trade Setups!
PLUS: $35,000 BTC Next?
Overview
Chart #1 - Ethereum to Bitcoin (ETHBTC) Daily
Chart #2 - Chainlink (LINKUSD) Daily
Chart #3 - Sui (SUIUSD) Daily
Chart #4 - Polkadot (DOTUSDT) 12-Hour
Chart #5 - Fear and Greed Index
Chart #1 - Ethereum to Bitcoin (ETHBTC) Daily
Chartist: Sheldon
(For the chart screenshot, click here.)
The SEC is expected to announce an ETH spot ETF in May this year, and if so, it could perform similarly to BTC - leading up to its own spot ETF approval.
ETH is at $2,300, and the $2,150 - $2,400 area of support has been holding for the last two months. I am currently laddering into a spot trade, and will hold it going into the ETF announcement in May, where I will then most likely take profits.
My stop loss is set just below $2,000.
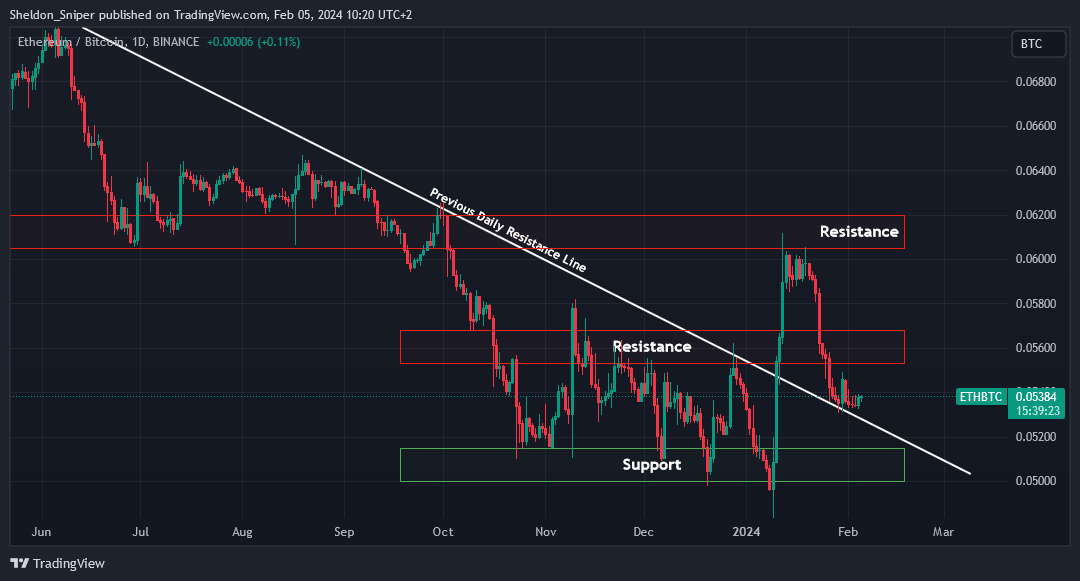
Looking at the ETH/BTC chart for confirmation, in January, there was a massive pump in ETH that resulted in the ETH/BTC pair breaking out of the daily descending resistance line that had been in place since June 2023. ETH/BTC has retraced over the last couple of weeks but is currently retesting that previous break.
I am looking for the ETH/BTC pair to reclaim the 0.056 area and turn it into support.
Sign-up and trade on Bybit today.
Exclusive $30,000 deposit rewards and bonuses up for grabs!
Chart #2 - Chainlink (LINKUSD) Daily
Chartist: Kyle
(For the chart screenshot, click here.)
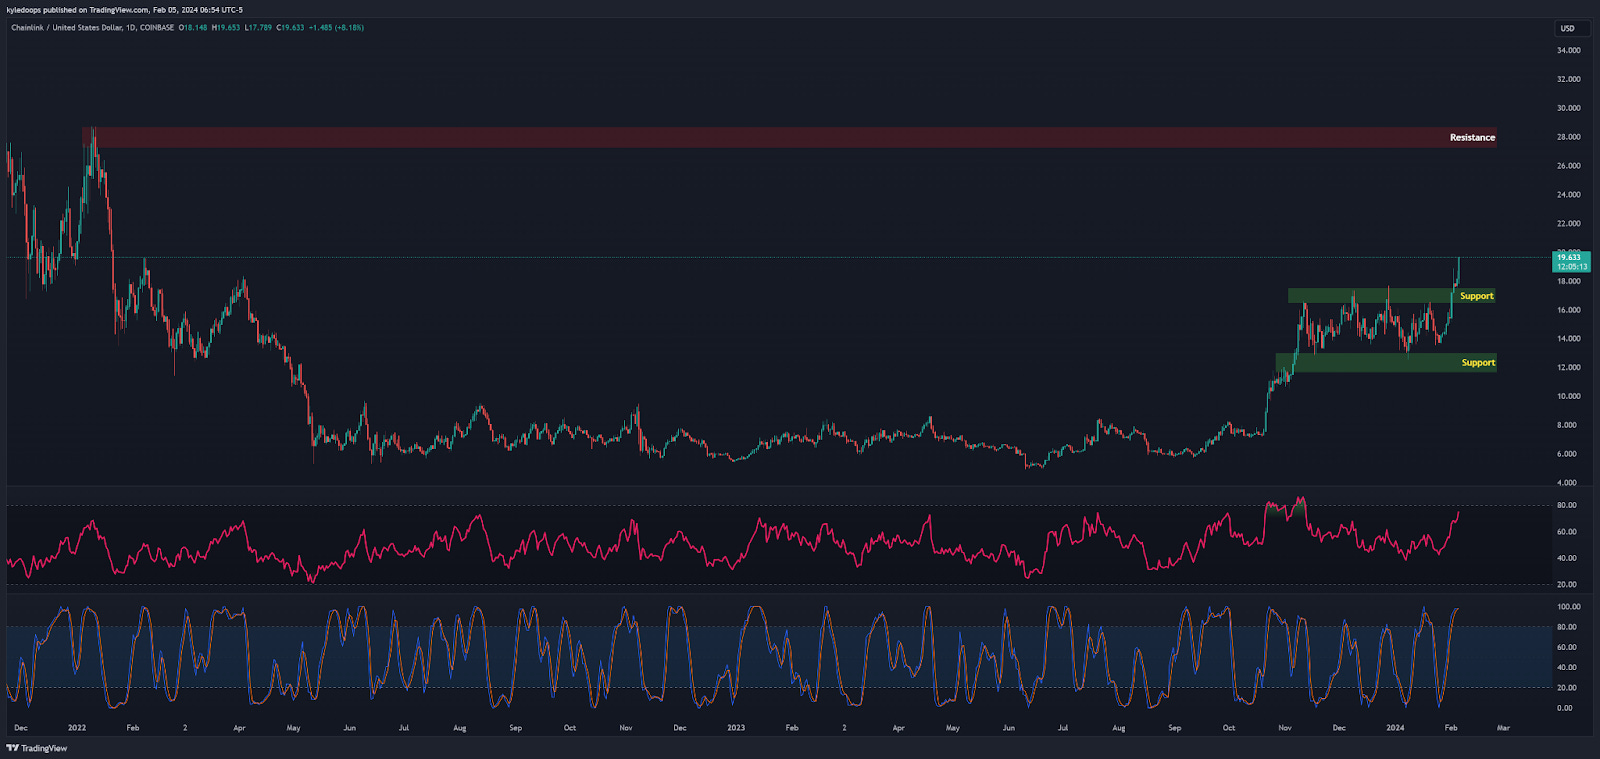
LINK has been very strong since last October when it broke out from the $8 area and has been consistently rising.
If you are experiencing FOMO (Fear of Missing Out) and missed the earlier move, you can look at the daily chart where there may be a possibility of a retest of the $18 area.
On the weekly chart, LINK appears very strong and is targeting the next resistance at $28, which represents a more than 50% move up. As long as Bitcoin remains stable within its range, LINK is likely to continue its upward movement without significant disturbances.
Claim your Bitget sign-up bonuses here (details below).

Outsmart 99% Of The Market!
Get full access into our Discord And Telegram group, where you'll find all of our premium content!
👉 Trade Signals!
👉 Trade Set-Ups!
👉 Trading Challenges!
👉 Education!
👉 SO MUCH MORE!
Chart #3 - Sui (SUIUSD) Daily
Chartist: Kyle
(For the chart screenshot, click here.)
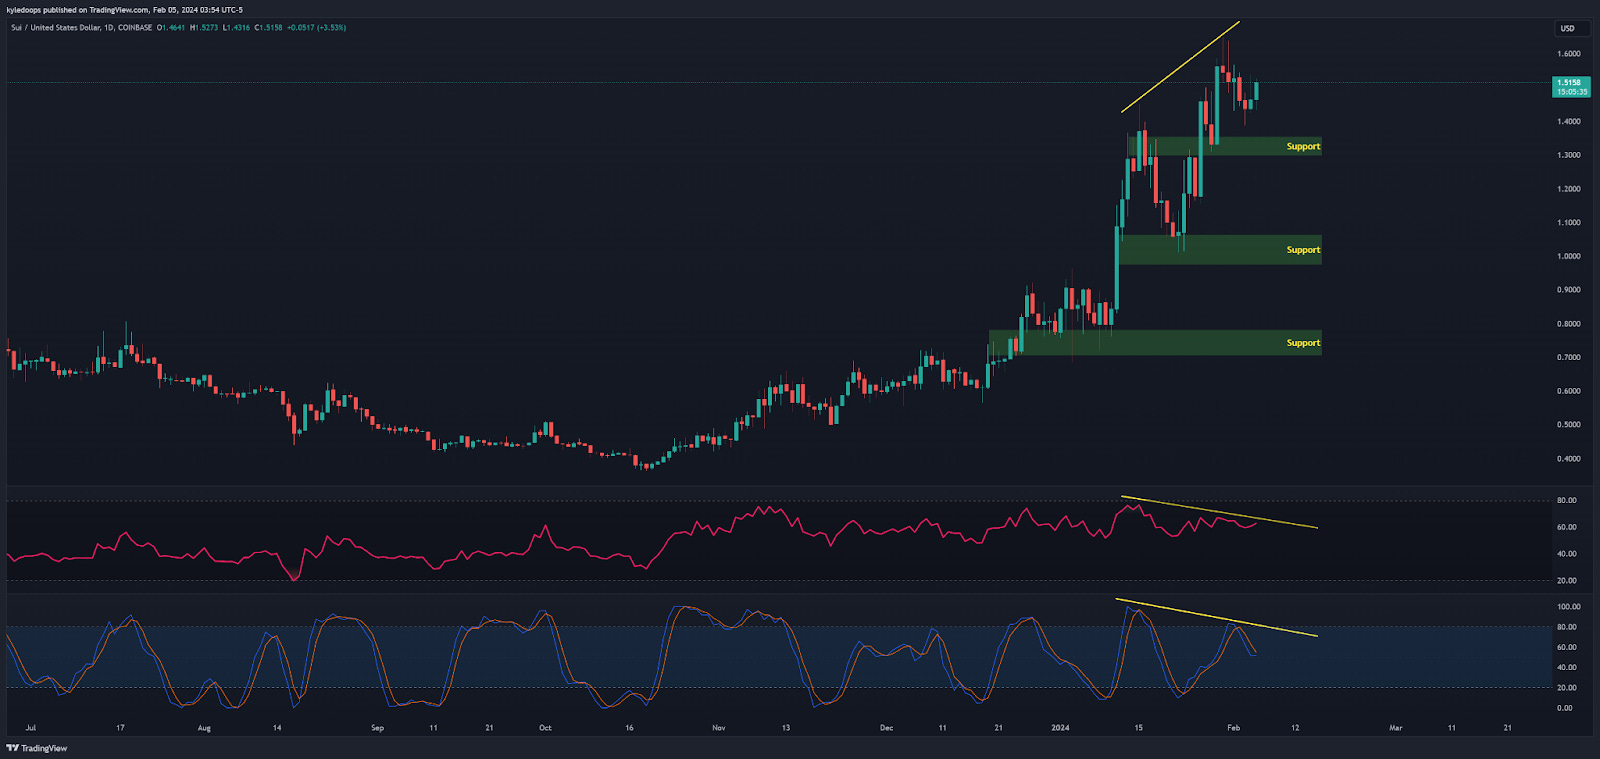
SUI on the daily is showing some divergence, so it's advisable to approach it with caution.
If it fails to break the previous high of $1.51, it's more likely to target the supports below at $1.30, $1.00, and $0.75.
We’ll wait until the end of the day to get a better sense of its direction.
Claim your Bitget sign-up bonuses here (details below).
Chart #4 - Polkadot (DOTUSDT) 12-Hour
Chartist: Sheldon
(For the chart screenshot, click here.)
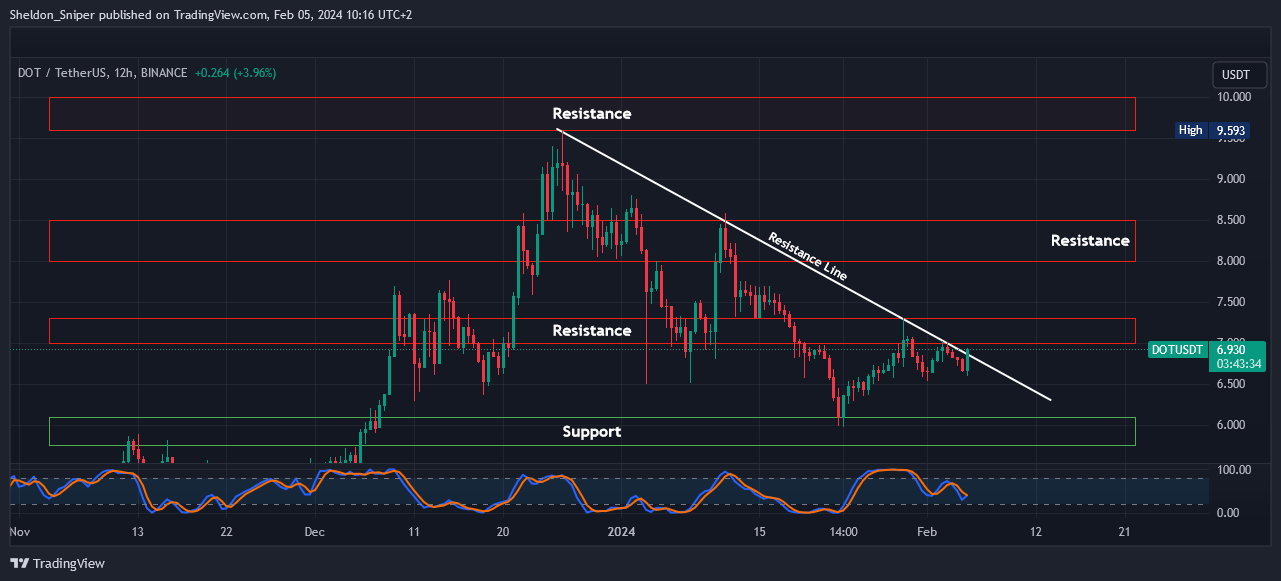
I am considering taking a DOT long position.
It’s breaking through a resistance line that dates back to around December 25th, but it is also approaching the $7.00 - $7.25 area of resistance. If it regains the $7.00 level, I will enter 50% of my allocation into the trade, with the remaining 50% upon breaking through $7.25.
My target take-profit areas will be $8.00 - $8.50 and then $9.60 - $10.00.
My stop-loss will be set at around $6.70.
Claim your Bitget sign-up bonuses here (details below).
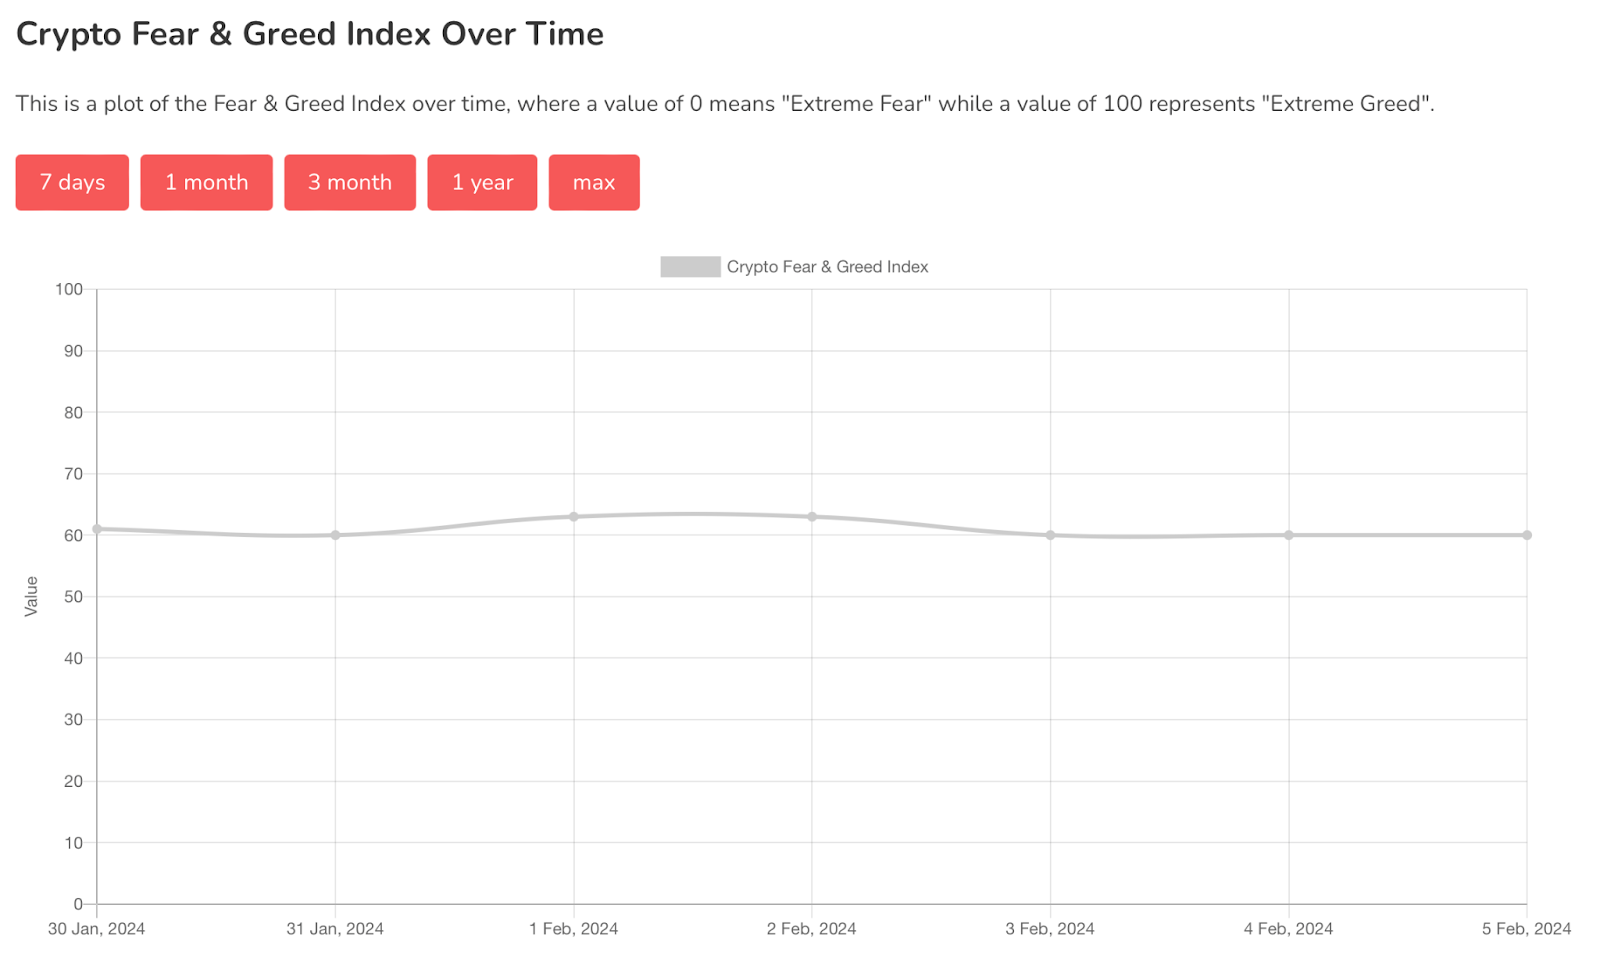
Chart #5 - Fear and Greed Index
The Fear and Greed Index is sitting at 60 today, indicating Greed.
The highest the index has been over the past seven days is 63, and the lowest is 60.
Banter’s Take
Bitcoin is back within its range after a dip on Friday, providing an opportunity for altcoins to move higher. However, from a technical perspective, Bitcoin has formed a lower high from the $48,975 level, indicating the possibility of a retracement down to $35,000, where there is still open liquidity.
It's essential to keep this in mind.
Stay safe my friends!
Go to our Crypto Banter Discord here where Sheldon and Kyle give updates on the charts and trades from The Daily Candle newsletter!
gm zm, excellent article, would you consider writing an article on requirements to become a cryto lender?