

📈📉 Litecoin Double Bottom Signals Bullish Future! Time To Short Kava?
📈📉 Litecoin Double Bottom Signals Bullish Future! Time To Short Kava?

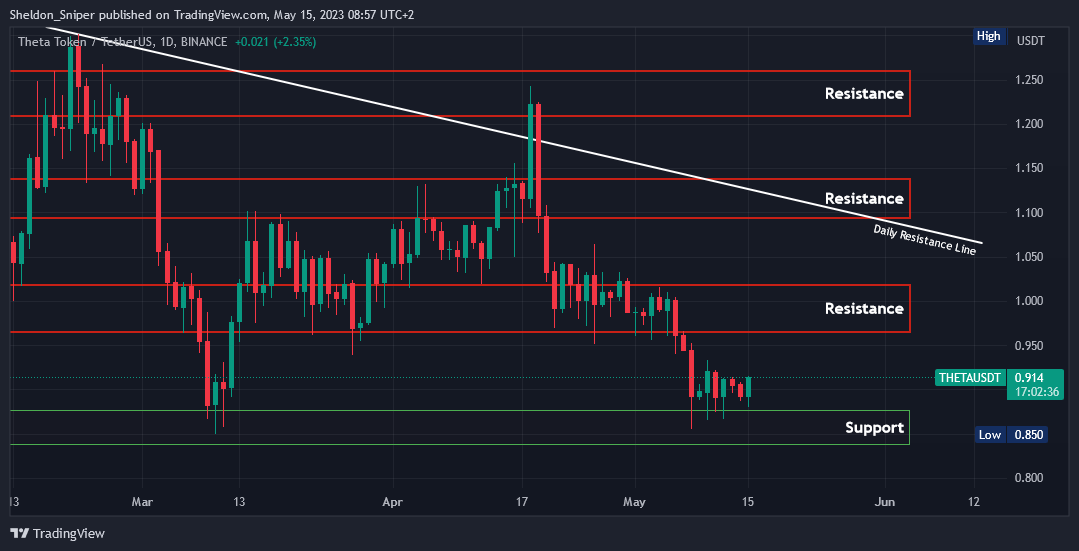
Chart #1 - Theta Network (THETAUSDT) 1-Day Chart
Chartist: Sheldon
(For the chart screenshot, click here.)
Over the past week, the price of THETA has been consolidating within the $0.84 - $0.88 support range, an area that previously served as support in mid-March before the price reversed upwards. With bitcoin's trend reversing back to the upside over the weekend, there's potential for THETA to follow suit, possibly testing the next major resistance area between $0.96 - $1.02.
Should THETA successfully breach this resistance level, it could propel the price towards the next resistance zone, around $1.10 - $1.14. Notably, this area is also where the daily descending resistance line, originating from August last year, is found, which is expected to act as additional resistance.
𝗣𝗿𝗶𝗺𝗲 𝗫𝗕𝗧
Sign up for a new Trading Account on Prime XBT!
Receive a deposit bonus of up to $7,000 with promo code: SheldonSniper
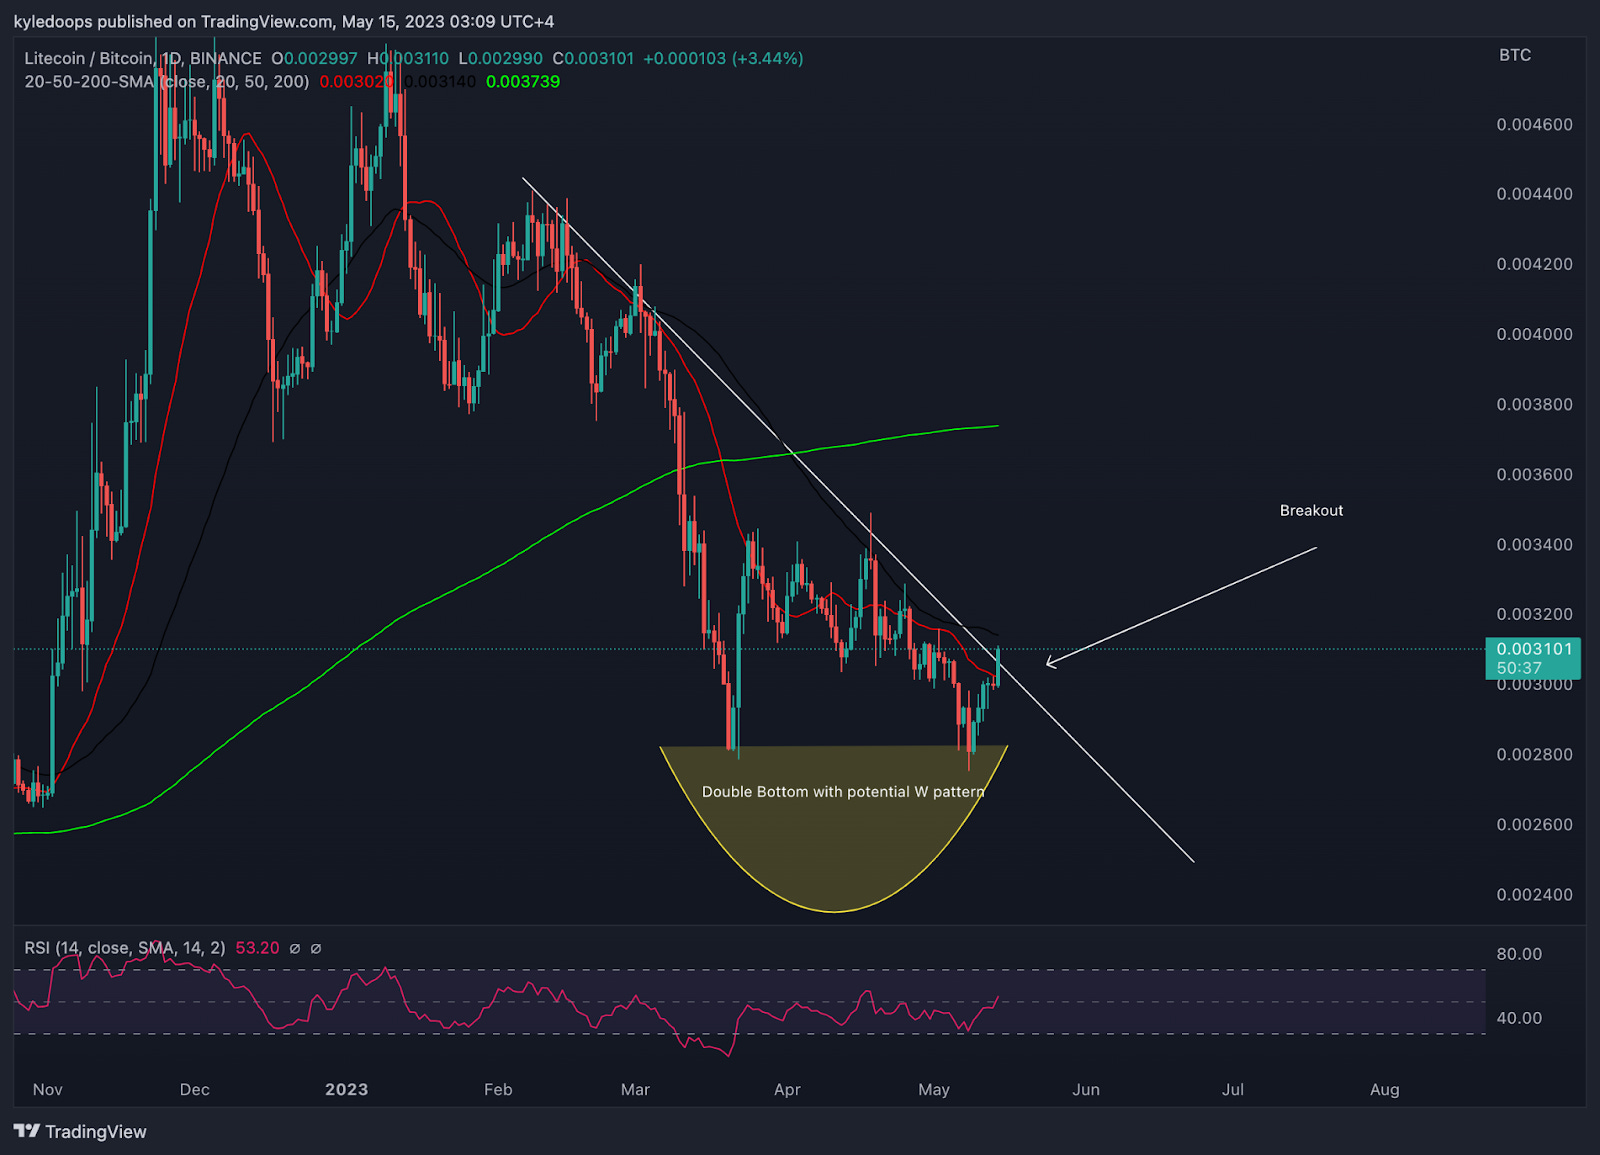
Chart #2 - Litecoin (LTCBTC) 1-Day Chart
Chartist: Kyle
(For the chart screenshot, click here.)
The Litecoin halving event is taking place around the start of August. If we consider the 2015 and 2019 halving events, the price typically rallied until approximately six weeks before the event, followed by a sell-off. Litecoin could be preparing for a similar rally leading up to this year's event.
Looking at the daily LTC/USDT chart, the 200-day Moving Average (200MA) has served as support over the past week. Today, we see the price attempting to break through the daily descending resistance line, which originates from mid-last month. The daily Relative Strength Index (RSI) also indicates a potential upward move, as it has reset at the bottom and started to rise.
Turning to the daily LTC/BTC chart, over the past week, the ratio has formed a double bottom. It's also currently breaking the daily descending resistance line, which dates back to February. This means LTC has the potential to outperform BTC over the next few weeks, leading up to the halving. However, bear in mind that these types of events typically follow a "buy the rumor, sell the news" pattern, as prices tend to drop a few weeks before the event.
𝗣𝗿𝗶𝗺𝗲 𝗫𝗕𝗧
Sign up for a new Trading Account on Prime XBT!
Receive a deposit bonus of up to $7,000 with promo code: KyleDoops

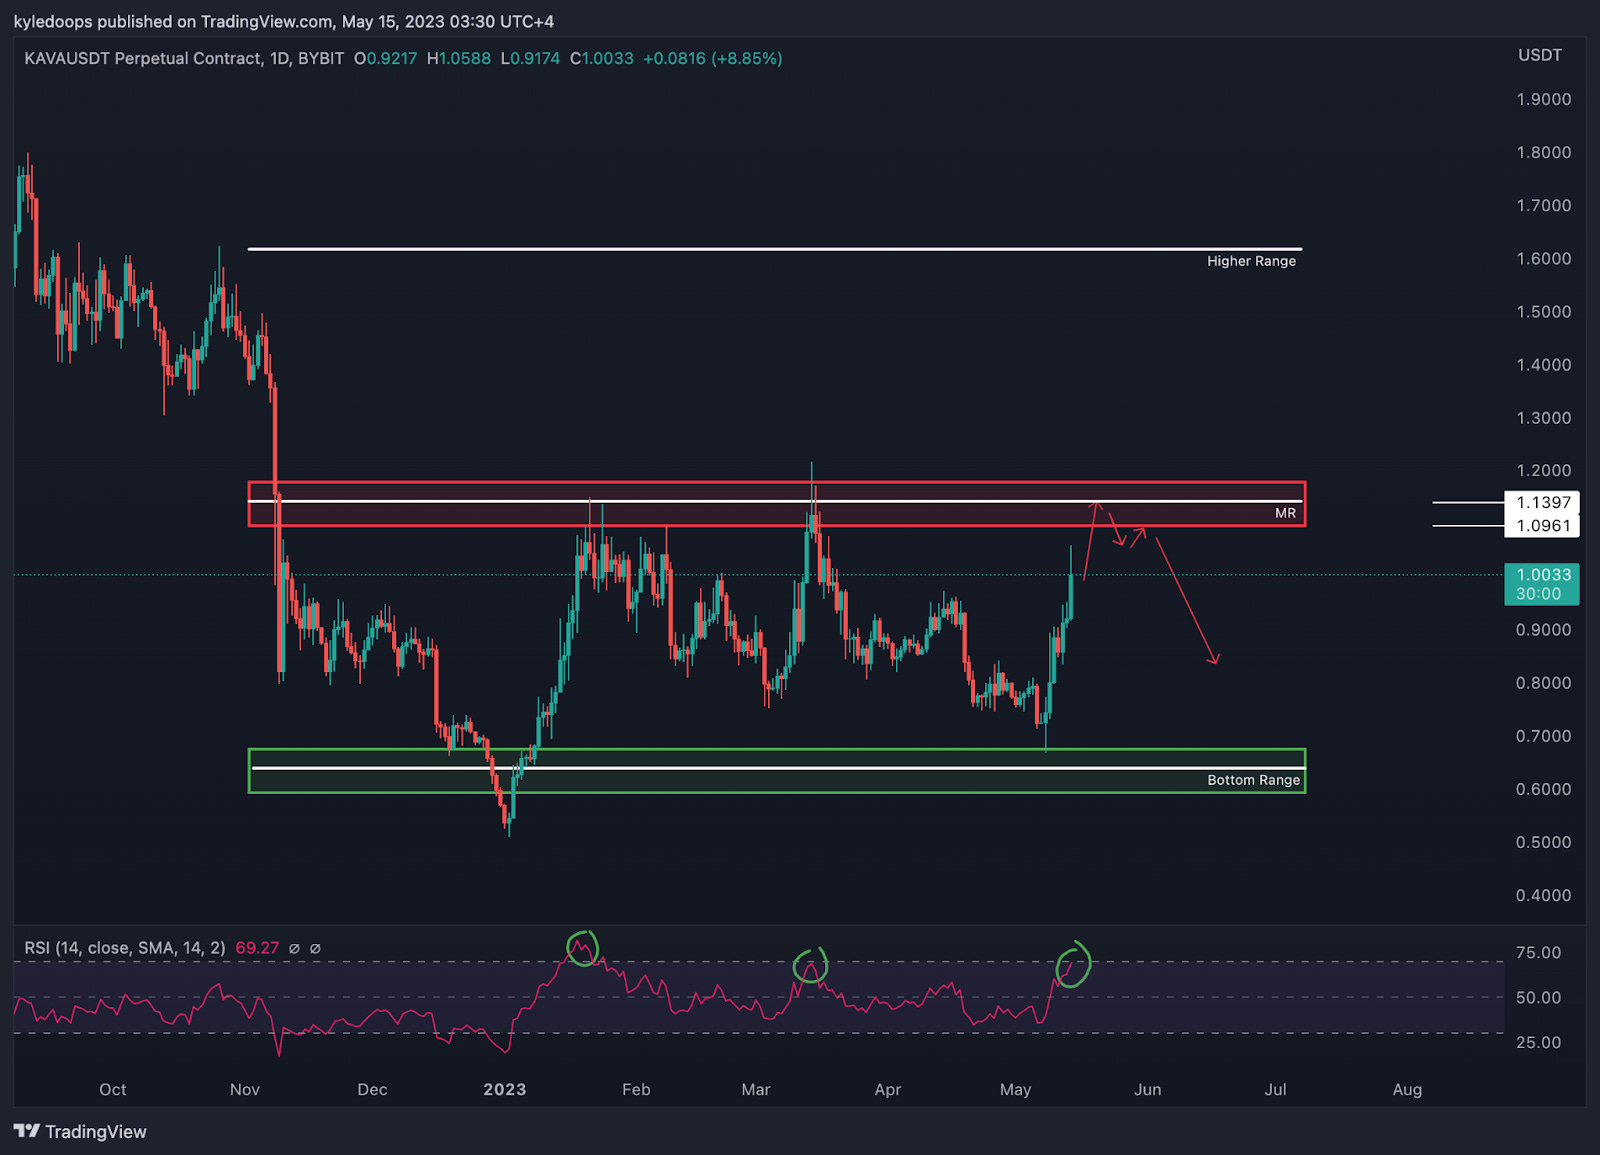
Chart #3 - Kava (KAVAUSDT) 1-Day Chart
Chartist: Kyle
(For the chart screenshot, click here.)
KAVA's price is currently nearing a significant resistance level!
We need to watch closely for a potential rejection around the $1.09 - $1.14 mark, especially in light of the upcoming Kava 13 release event scheduled for midweek. Many altcoins have been trading within a range over the past five months. As KAVA approaches the mid-range level, there's a chance for a short trade, particularly since the Relative Strength Index (RSI) is nearing overextension.
However, if KAVA manages to break above the mid-range level, it could lead to the price testing the range high.
Claim your Bitget sign-up bonuses here (details below).
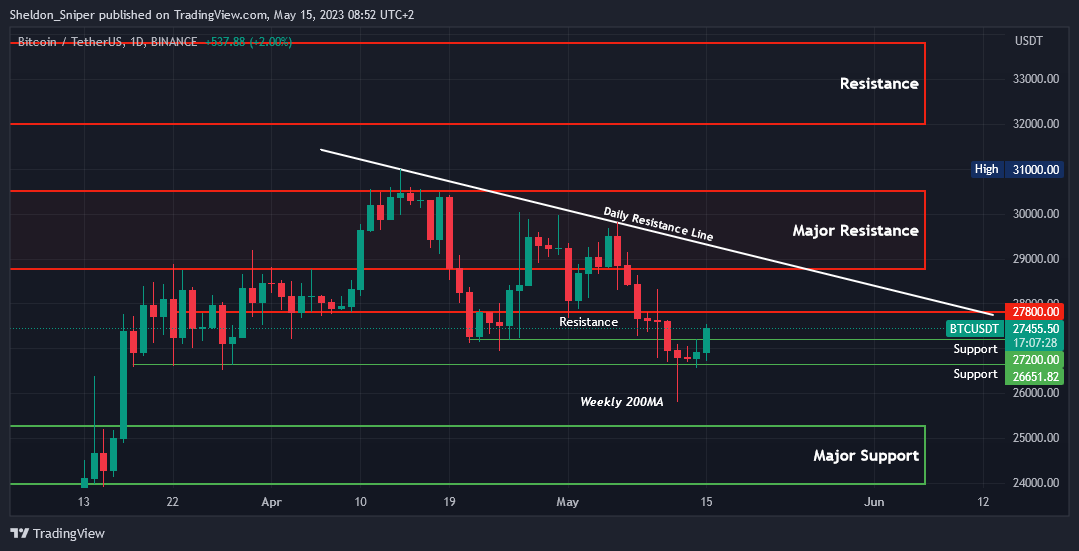
Chart #4 - Bitcoin (BTCUSDT) 1-Day Chart
Chartist: Sheldon
(For the chart screenshot, click here.)
On Friday, bitcoin found support at the Weekly 200 Moving Average, approximately at $25,800. This led to a swift price reversal as bullish traders bought back into the market. Over the weekend, bitcoin's price rose to $27,450, successfully reclaiming both the $26,650 and $27,200 support levels.
However, it is now approaching the $27,800 resistance level, which served as a support throughout most of April and the start of May.
If bitcoin faces rejection around the $27,800 mark, we could anticipate further downside, potentially testing the major support zone of $24,000 - $25,300. But, a breakthrough past the $27,800 resistance level could send the price towards the next significant resistance area, between $28,650 - $30,500.
Claim your Bitget sign-up bonuses here (details below).
Chart #5 - Bitcoin Fear and Greed Index
The Bitcoin Fear and Greed Index is sitting at 50 today, Neutral.
The highest the index has been over the past seven days is 52, and the lowest is 48.

Banter’s Take
On Friday, Bitcoin's price successfully rebounded off the Weekly 200MA, a promising development. However, it's crucial to maintain caution, as the ongoing rally might merely represent a retest of the prior support levels. Should the price fail to sustain at these levels, we could potentially witness further decline.
Stay safe my friends!
Go to our Crypto Banter Discord here where Sheldon and Kyle give updates on the charts and trades from The Daily Candle newsletter!
Today’s winning UIDs:
Bybit winner - 45101710
Bitget winner - 7510949998