

📈📉 Litecoin's 25% Surge: Prelude to a Crash or the Start of a New Rally? 🚀
📈📉 Litecoin's 25% Surge: Prelude to a Crash or the Start of a New Rally? 🚀

Chart #1 - Litecoin (LTCUSDT) 8-Hour Chart
Chartist: Sheldon

(For the chart screenshot, click here.)
Over the past week, LTC has seen a significant increase in value, with a surge of over 25%. Its price has climbed from approximately $75 to just under $94. The Litecoin halving event, scheduled for August this year, halves mining rewards, and historically, it has triggered a price rally 2-3 months prior, followed by a sell-off a few weeks before the event. We could potentially witness a similar pattern this year.
Currently, LTC’s price is trading in a resistance zone and is overbought on the 4-hour, 8-hour, and 12-hour time frames. Consequently, we might see a price correction with a potential retest of the support level in the $82 - $84 range.
This pullback could be good for Litecoin, potentially setting it up to test the major resistance area of $100 - $102. That is a barrier that LTC hasn't managed to break in the last five months.
Should LTC succeed in breaking and retesting the $102 level, it may pave the way for a test of the next significant resistance at $140. This could occur over the next few weeks as we approach the halving event.
𝗣𝗿𝗶𝗺𝗲 𝗫𝗕𝗧
Sign up for a new Trading Account on Prime XBT!
Receive a deposit bonus of up to $7,000 with promo code: SheldonSniper
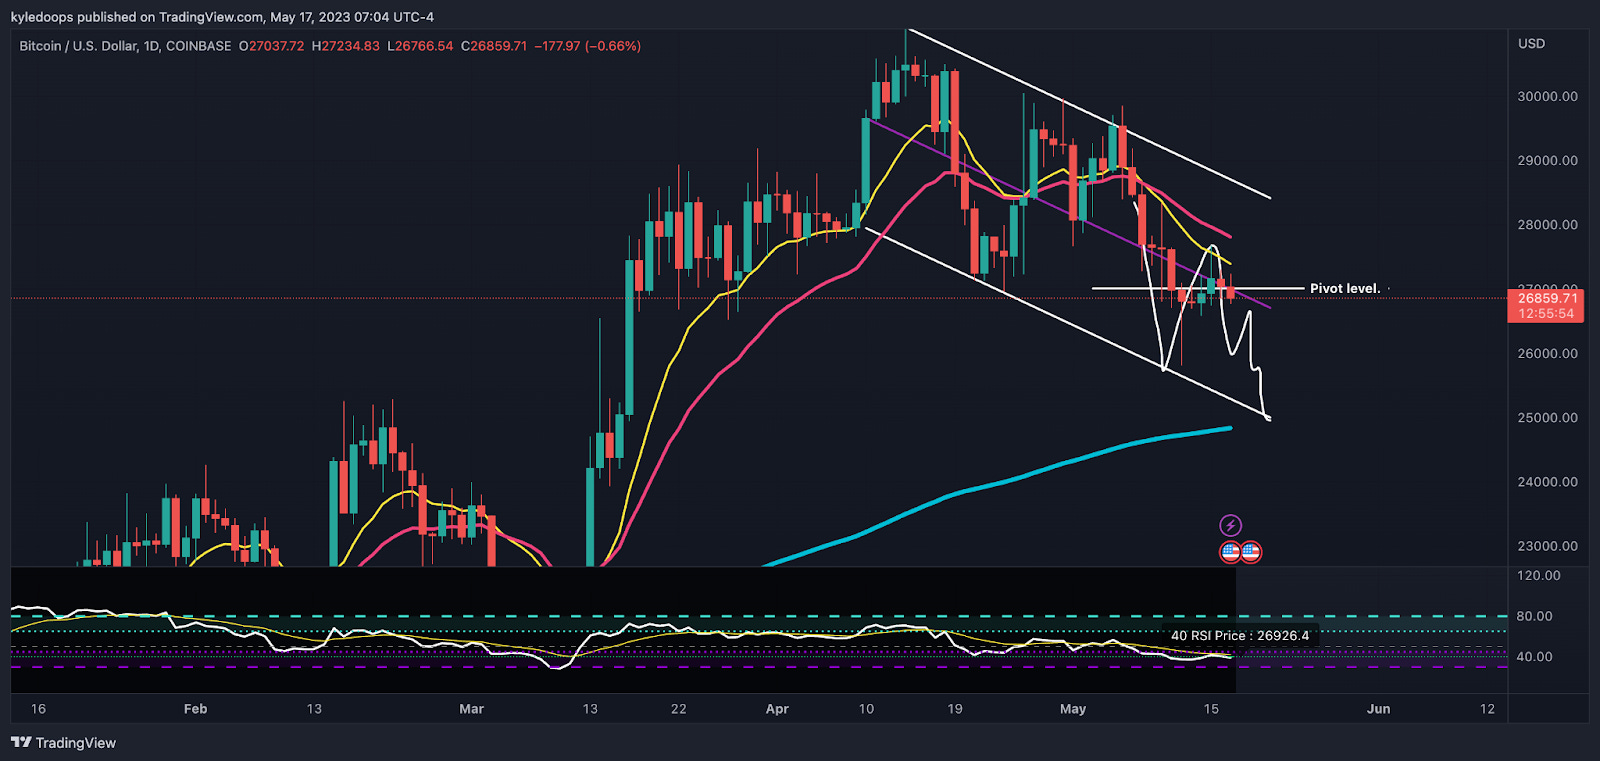
Chart #2 - Bitcoin (BTCUSD) 1-Day Chart
Chartist: Kyle
(For the chart screenshot, click here.)
Bitcoin's price has once again dipped below $27,000.
The current pivot point is specifically at $27,013. That implies that the risk of a further price drop remains as long as bitcoin trades below that level. However, a reclaiming of this pivot point could restore upward momentum and allow the Relative Strength Index (RSI) to trend upward again.
On a daily timeframe, bitcoin is still following an in-spirit of a bull flag pattern, and will have a chance to find major support at the 200 daily EMA which is at $24,844.
𝗣𝗿𝗶𝗺𝗲 𝗫𝗕𝗧
Sign up for a new Trading Account on Prime XBT!
Receive a deposit bonus of up to $7,000 with promo code: KyleDoops

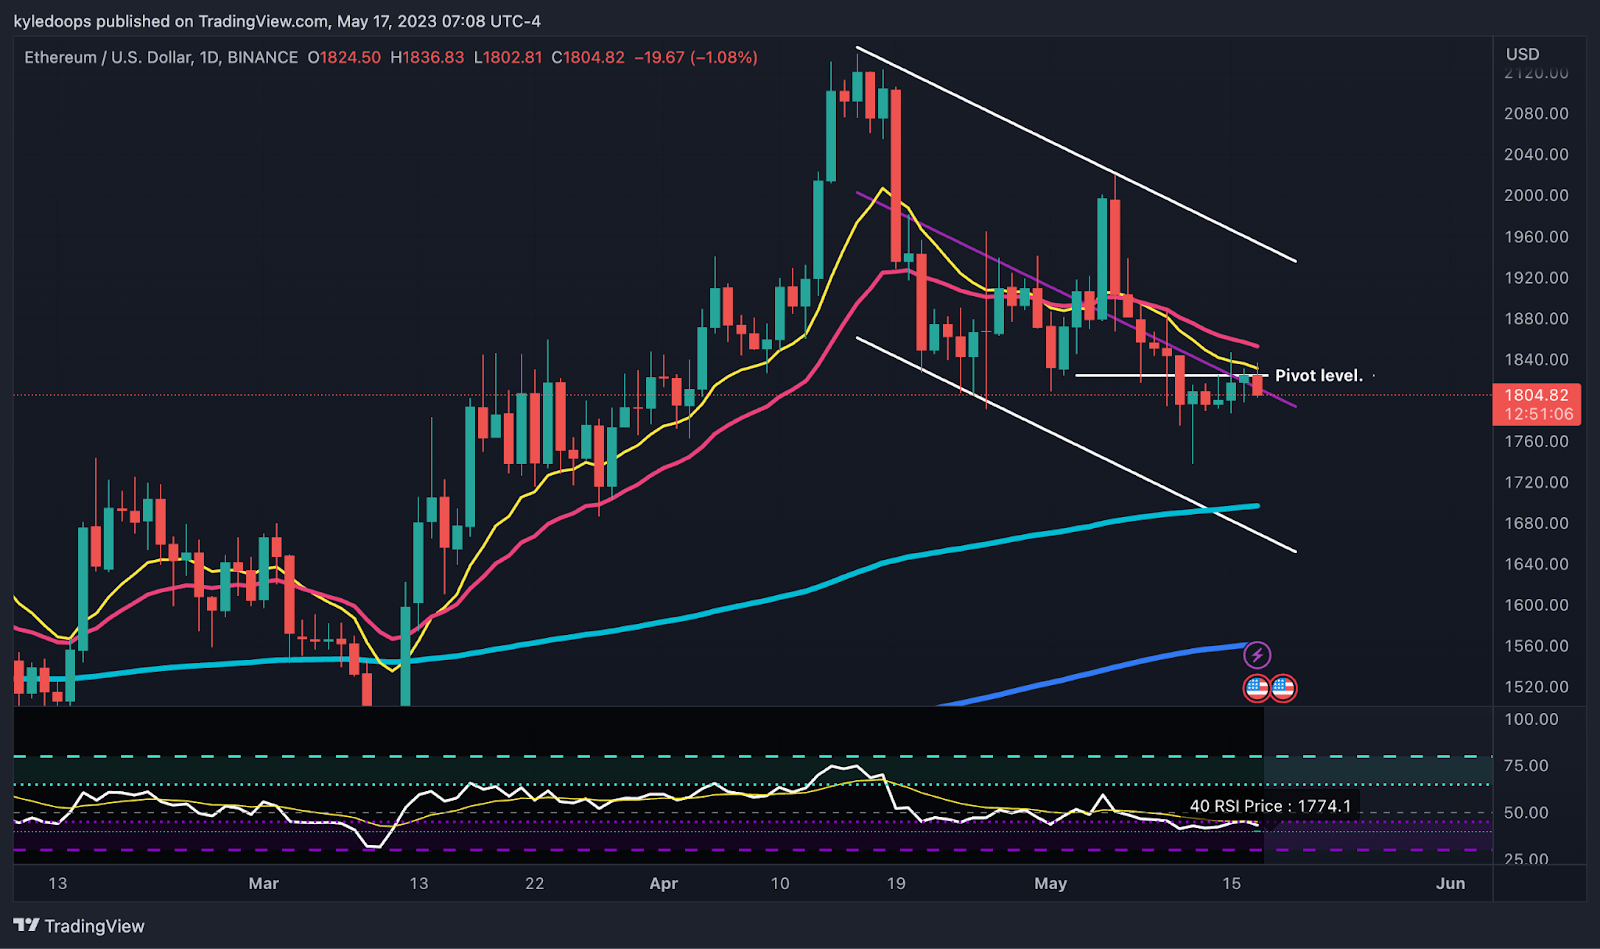
Chart #3 - Ethereum (ETHUSD) 1-Day Chart
Chartist: Kyle
(For the chart screenshot, click here.)
ETH presents a similar scenario to bitcoin, being currently stuck below its pivot level of $1,824.
If ETH manages to reclaim a position above $1,824, the risk will shift back to the upside, potentially allowing the Relative Strength Index (RSI) to ascend again.
However, downward pressure is significant. The 12-day and 24-day Exponential Moving Averages (EMAs) have crossed bearish, adding to the downward pressure. So, it's crucial for the bulls to regain control soon.
The next significant support for ETH is at the 200-day EMA, which currently sits at $1,696.
Claim your Bitget sign-up bonuses here (details below).
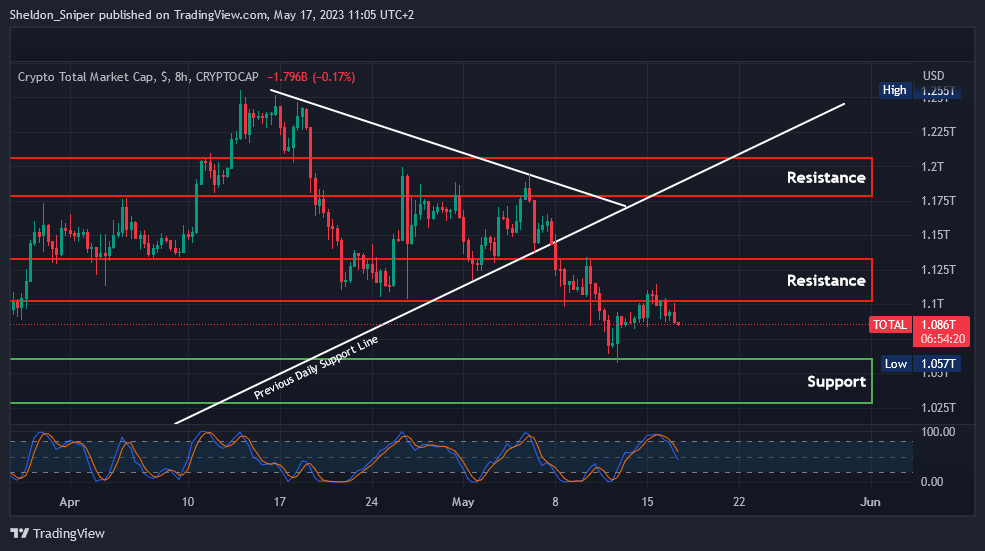
Chart #4 - TOTAL 8-Hour Chart
Chartist: Sheldon
(For the chart screenshot, click here.)
On Monday, the TOTAL failed to breach the resistance area of $1.1 trillion - $1.13 trillion and faced a rejection. In the subsequent two days, it began to pull back and is currently trading at around $1.086 trillion.
The Stochastic Relative Strength Index (Stoch RSI) on the 8-hour and 12-hour time frames continues to trend downwards, so the TOTAL could potentially fall further, possibly testing the next support area between $1.025 trillion - $1.06 trillion.
For the market to ascend in the next few weeks, it's crucial that that support level holds.
Claim your Bitget sign-up bonuses here (details below).
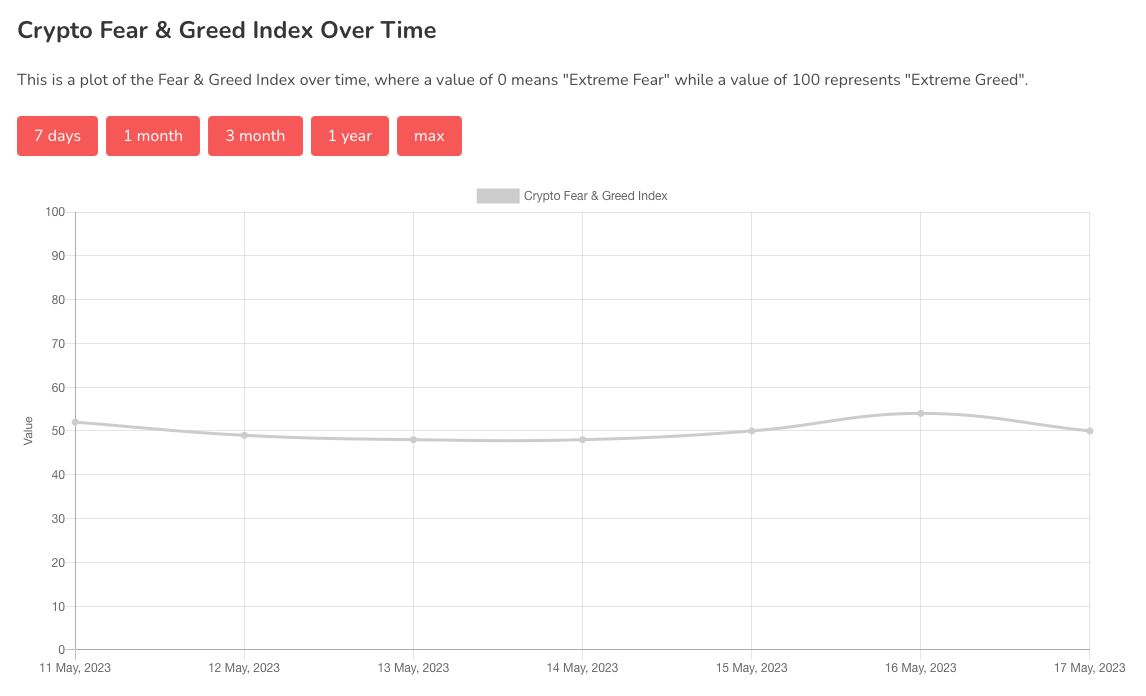
Chart #5 - Bitcoin Fear and Greed Index
The Bitcoin Fear and Greed Index is sitting at 50 today, Neutral.
The highest the index has been over the past seven days is 54, and the lowest is 48.
Banter’s Take
The market continues to hover around the pivot levels, one day it's up above the pivot level, the next day it's below.
This choppy environment makes it tough for traders to navigate, and it's often better for our pockets to wait for a decisive move from bitcoin. Once it chooses a direction, or reaches an extremity, the time to take our trades will arise.
Stay safe my friends!
Go to our Crypto Banter Discord here where Sheldon and Kyle give updates on the charts and trades from The Daily Candle newsletter!