

📈📉 Long Term KAS Trade + Bitcoin Liquidity Imbalance!
📈📉 Long Term KAS Trade + Bitcoin Liquidity Imbalance!

Overview
Chart #1 - BNB (BNBUSDT) Daily Chart
Chart #2 - Kaspa (KASUSDT) Daily Chart
Chart #3 - Bitcoin (BTCUSD) Weekly Chart
Chart #4 - Render (RNDRUSDT) Daily Chart
Chart #5 - Fear and Greed Index

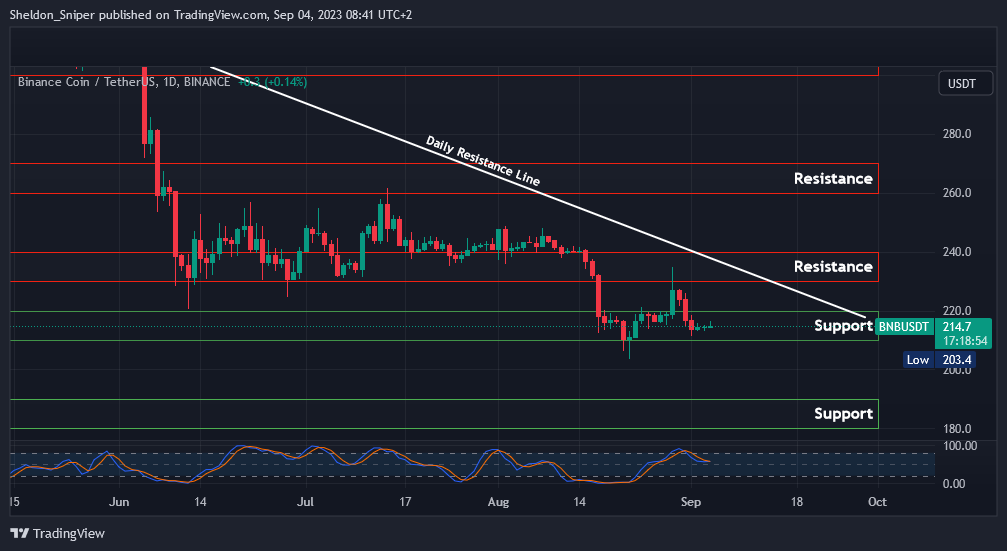
Chart #1 - BNB (BNBUSDT) Daily Chart
Chartist: Sheldon
(For the chart screenshot, click here.)
Over the last two and a half months, BNB dropped from around $260 down to $203, before recovering to $215, and over the last two weeks has ranged in the $210 - $220 support area.
If this support can hold, then there is a possibility of the price once again rising to test the next area of resistance at $230 - $240. If the price manages to break through that area, the next level of resistance is at $260 - $270.
But, if the $200 - $210 support level is lost, then the next major area of support lies at $180 - $190.
𝗣𝗿𝗶𝗺𝗲 𝗫𝗕𝗧
Sign up for a new Trading Account on Prime XBT!
Receive a deposit bonus of up to $7,000 with promo code: SheldonSniper
Sign-up and trade on Bybit today.
Exclusive $30,000 deposit rewards and bonuses up for grabs!
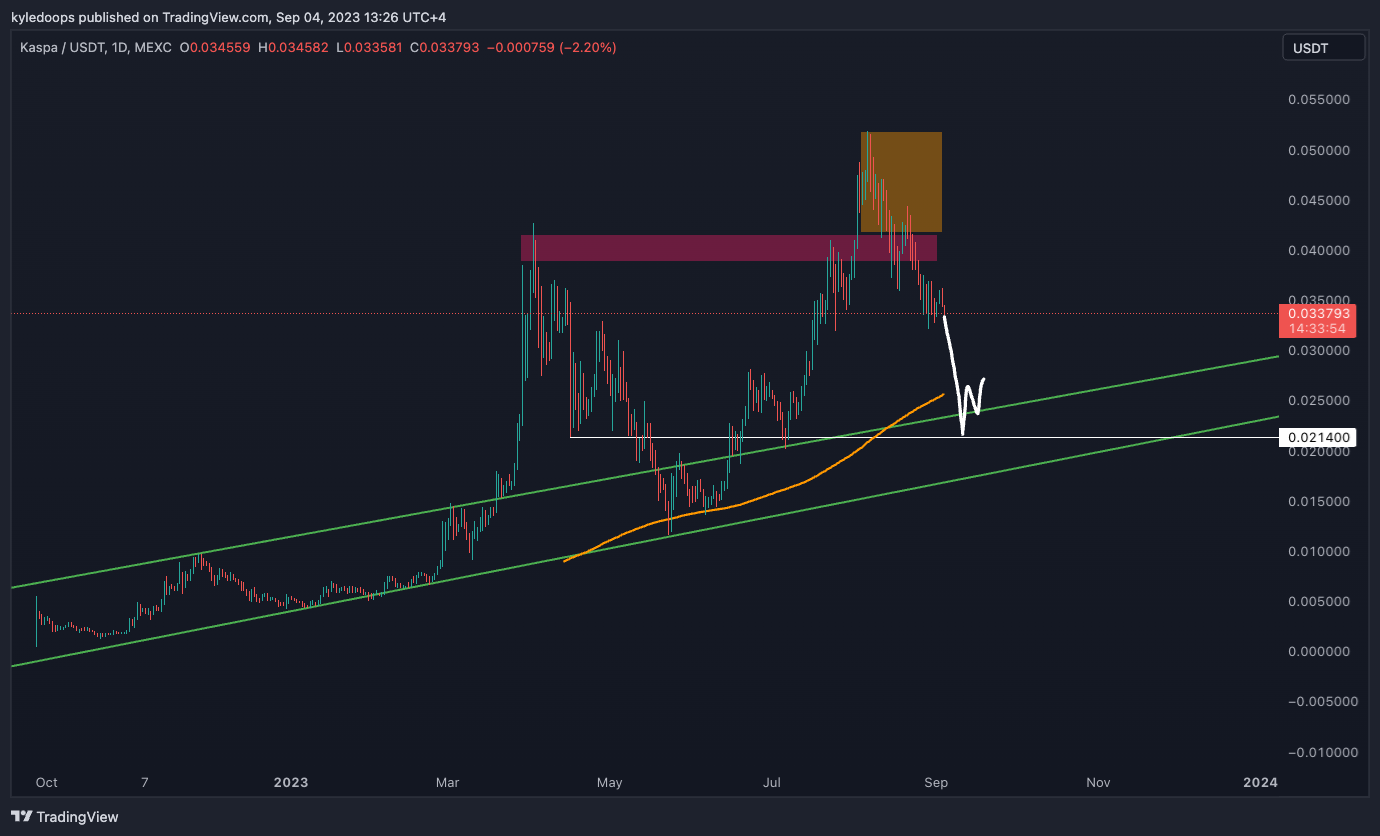
Chart #2 - Kaspa (KASUSDT) Daily Chart
Chartist: Kyle
(For the chart screenshot, click here.)
I’m looking for KAS to retrace back towards $0.021, where a potential long entry could be opened for a long-term play.
This aligns with three key levels:
The 200-day MA,
A strong diagonal, and
A strong horizontal.
𝗣𝗿𝗶𝗺𝗲 𝗫𝗕𝗧
Sign up for a new Trading Account on Prime XBT!
Receive a deposit bonus of up to $7,000 with promo code: KyleDoops
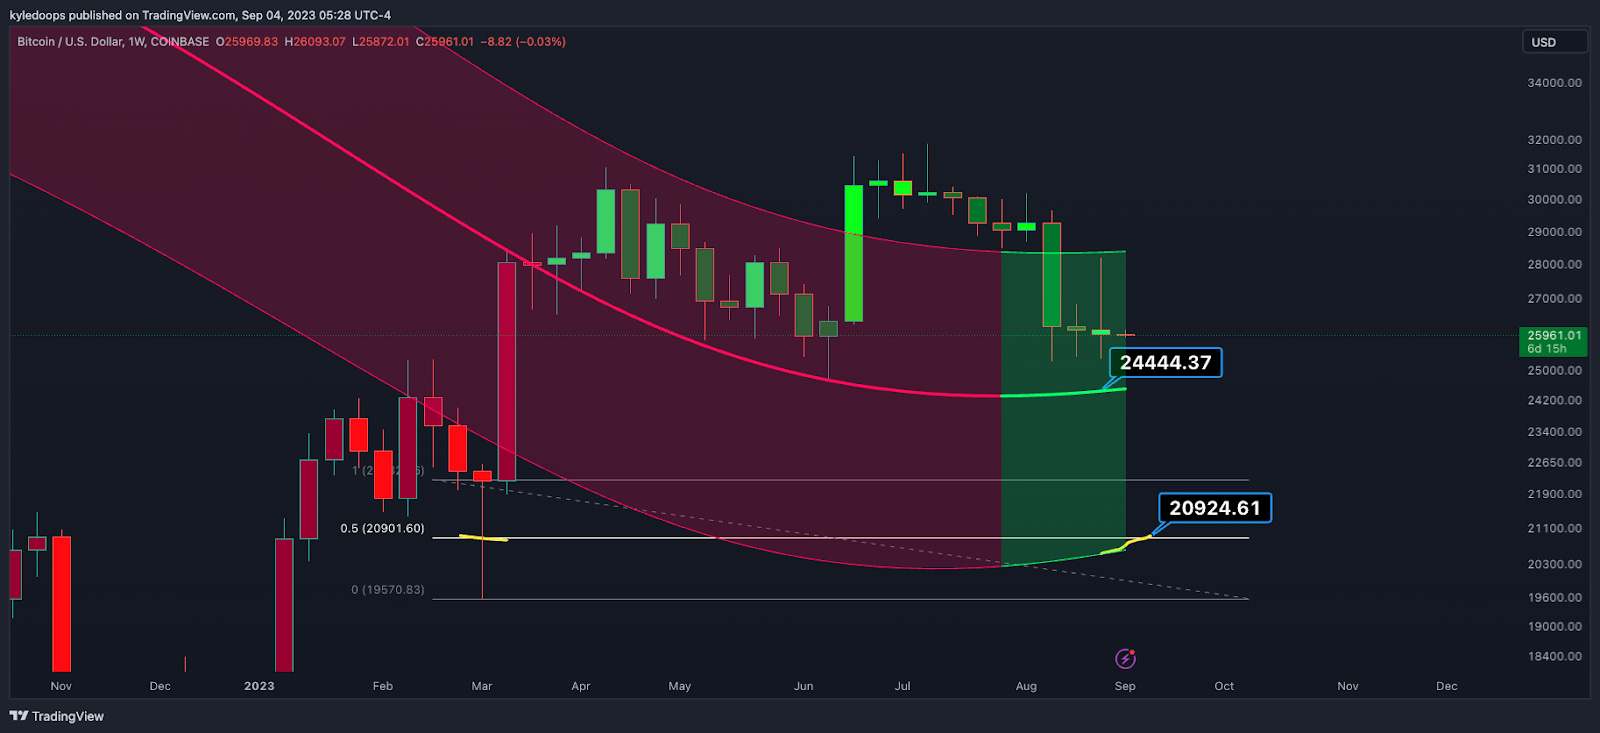
Chart #3 - Bitcoin (BTCUSD) Weekly Chart
Chartist: Kyle
(For the chart screenshot, click here.)
Bitcoin has two major supports according to the Gaussian channel, which is a trend trading system.
The first level is at $24,520 and the second level is at $20,924. This second level also aligns with the 0.5 level of the prior wick low, indicating a major liquidity imbalance.
Claim your Bitget sign-up bonuses here (details below).
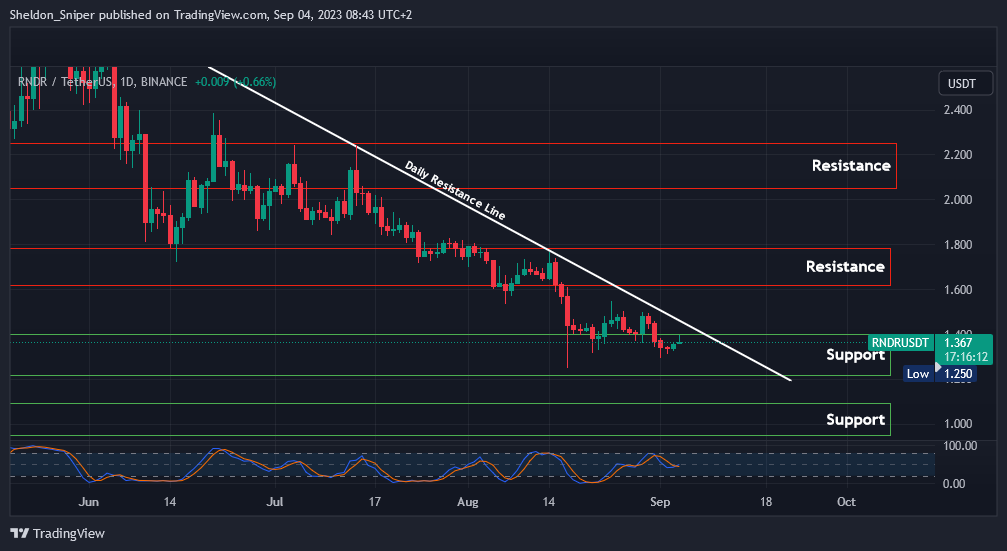
Chart #4 - Render (RNDRUSDT) Daily Chart
Chartist: Sheldon
(For the chart screenshot, click here.)
RNDR has managed to stabilize in the $1.20 - $1.40 area, following a four-month decline.
The current price hovers around $1.40. If BTC can also stabilize in the next few days, there's a chance RNDR will test $1.50, and if successful, will most likely head to $1.60 - $1.80.
If $1.20 is lost, the next support area is around $0.95 - $1.10.
Claim your Bitget sign-up bonuses here (details below).
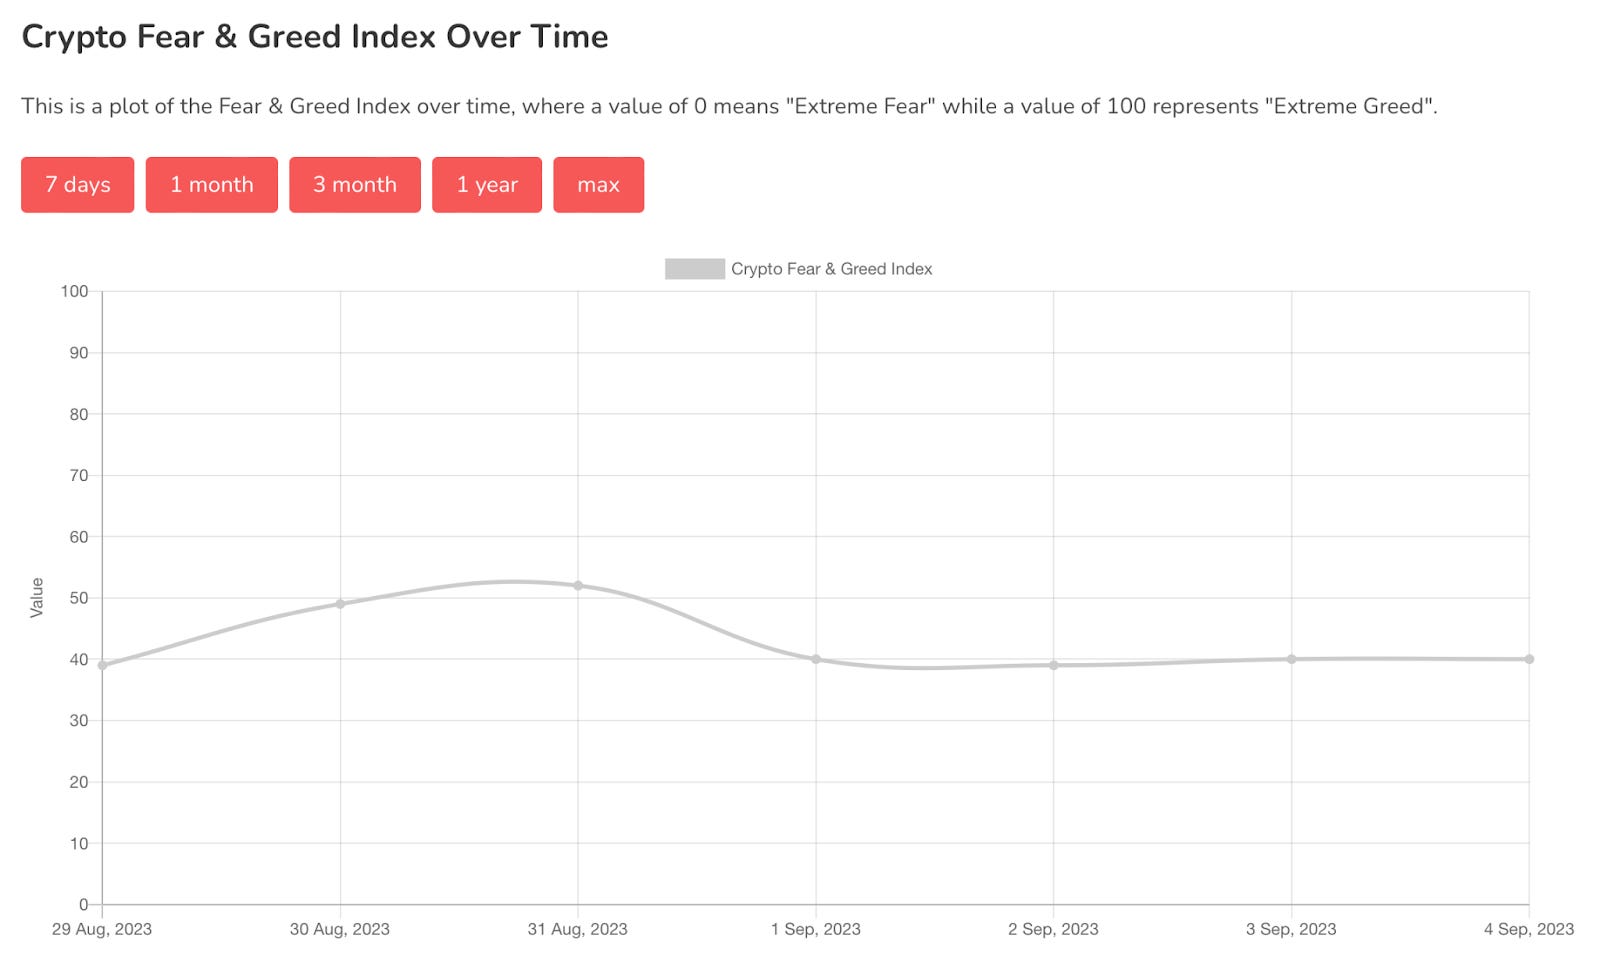
Chart #5 - Fear and Greed Index
The Fear and Greed Index is sitting at 40 today, indicating Fear.
The highest the index has been over the past seven days is 52, and the lowest is 39.
Banter’s Take
Markets are closed today, and Bitcoin is likely to consolidate in a non-eventful, boring market. Price risk is still tilted towards the downside.
Stay safe my friends!
Go to our Crypto Banter Discord here where Sheldon and Kyle give updates on the charts and trades from The Daily Candle newsletter!