

📈📉 Long Trade Setups for JOE and Fantom!
📈📉 Long Trade Setups for JOE and Fantom!

Overview
Chart #1 - Bitcoin Dominance
Chart #2 - JOE
Chart #3 - Fantom
Chart #4 - Cosmos
Chart #5 - Bitcoin Fear and Greed Index

Real Vision membership packages help you understand the complex world of crypto and macro, with real in-depth analysis!
Get your membership package 👉 here, and benefit from SPECIAL Crypto Banter discounted prices!
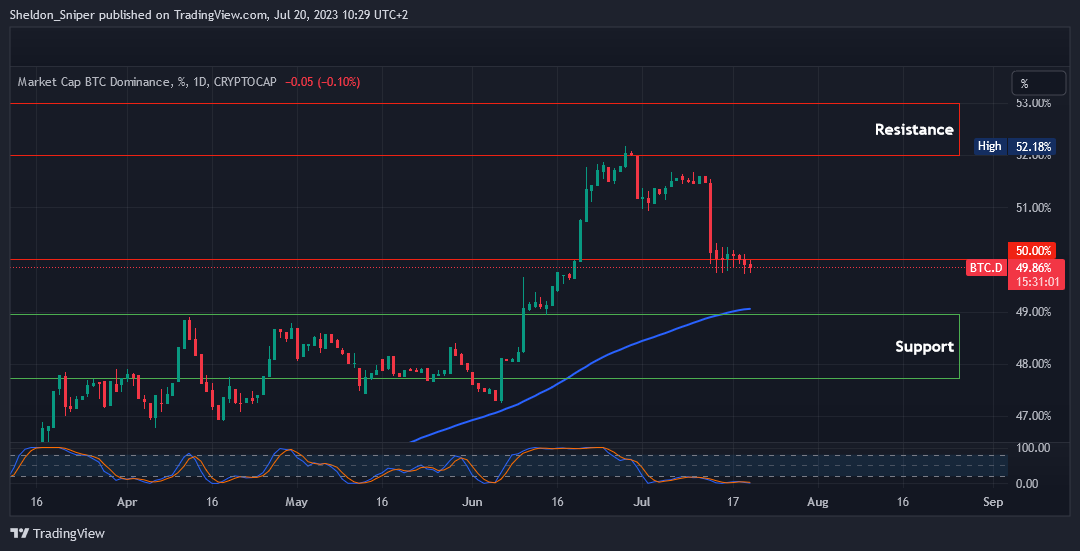
Chart #1 - Bitcoin Dominance (BTC.D) 1-Day Chart
Chartist: Sheldon
(For the chart screenshot, click here.)
Bitcoin dominance is just below the 50% resistance level, so it might resume its downward trend to test both the 100-day Moving Average (blue line) and the major support area between 48% - 49%.
The 100-day MA has been tested three times this year, and I anticipate it to once again provide support if BTC.D revisits it.
Sign-up and trade on Bybit today.
Exclusive $30,000 deposit rewards and bonuses up for grabs!
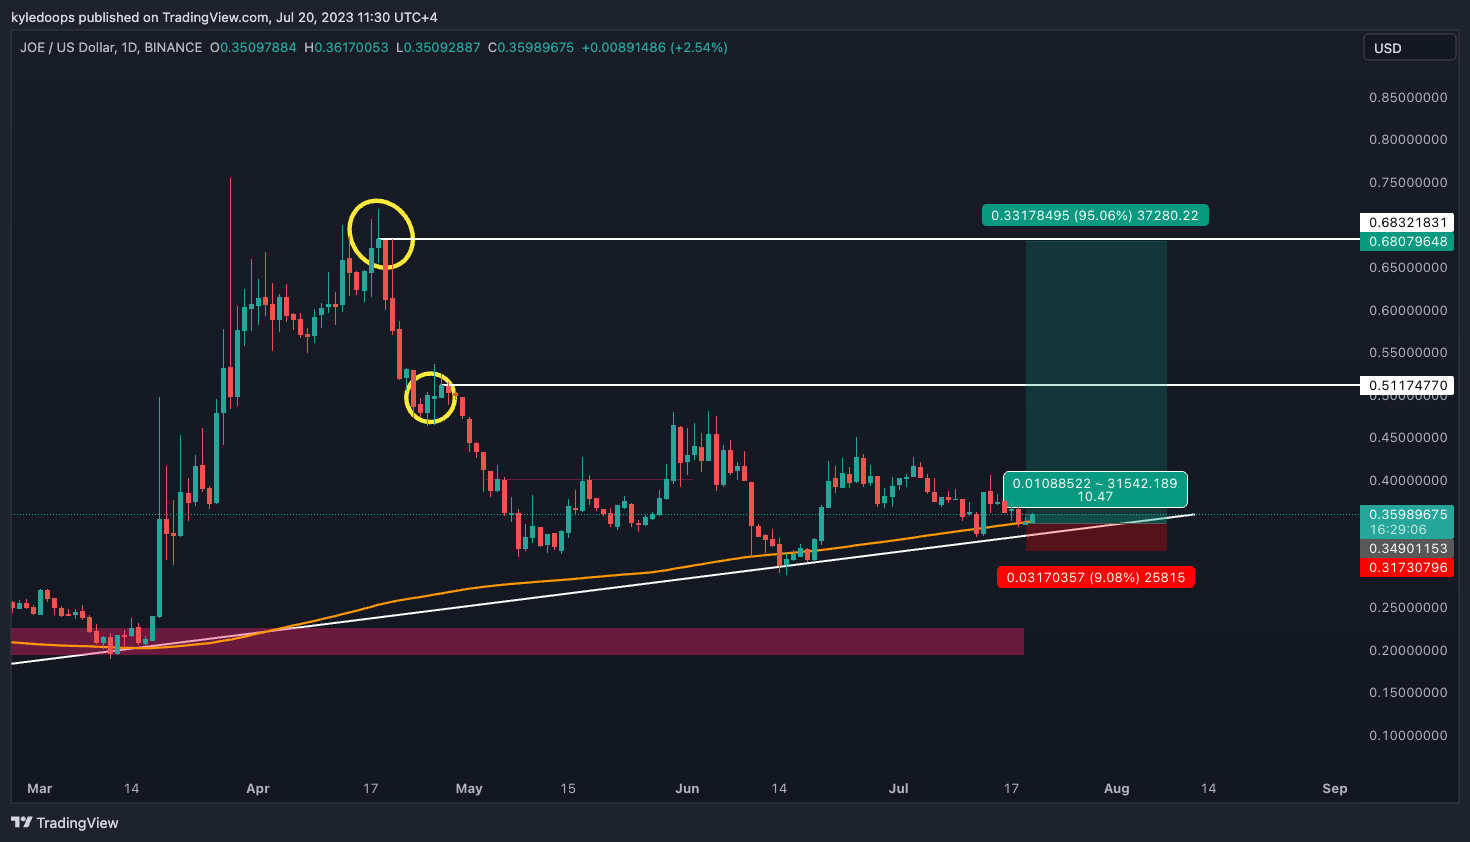
Chart #2 - JOE (JOEUSD) 1-Day Chart
Chartist: Kyle
(For the chart screenshot, click here.)
Here’s a Trader Joe long opportunity with a 10.47:1 risk to reward ratio.
My stop loss would be placed at $0.31, with take-profit (TP) levels set at $0.51 and $0.68.
The price continues to hold above the 200-day Moving Average (MA).
𝗣𝗿𝗶𝗺𝗲 𝗫𝗕𝗧
Sign up for a new Trading Account on Prime XBT!
Receive a deposit bonus of up to $7,000 with promo code: KyleDoops

Sign up for a new Trading Account on Prime XBT!
Receive a deposit bonus of up to $7,000 with promo code: SheldonSniper
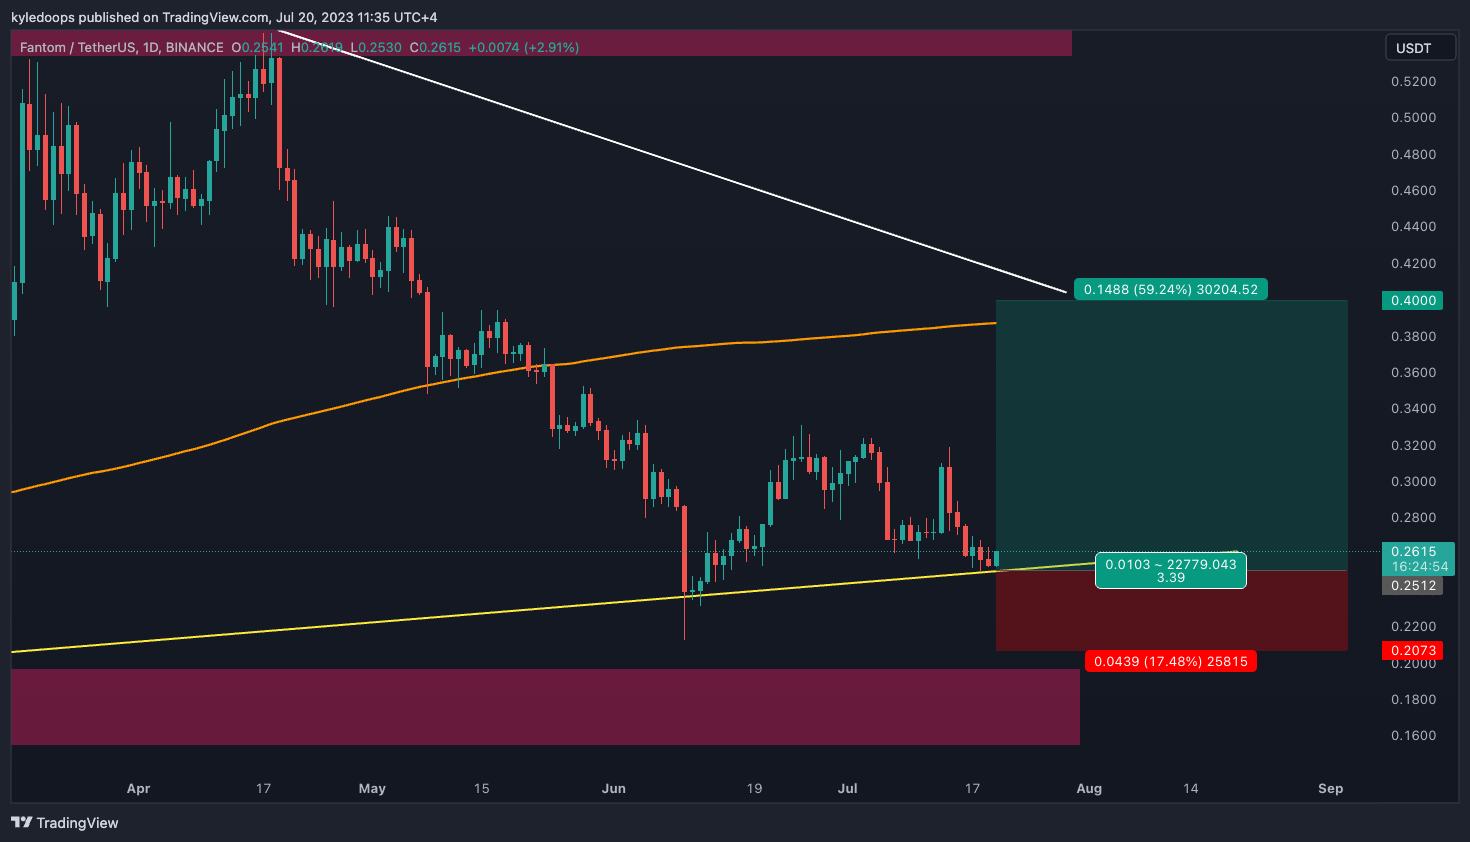
Chart #3 - Fantom (FTMUSDT) 1-Day Chart
Chartist: Kyle
(For the chart screenshot, click here.)
FTM presents a long setup with a risk-to-reward ratio of 3.39:1.
The price is bouncing off the diagonal trend line, and the 200 MA could be the next major resistance.
So, I’ll set my stop loss at $0.20, with a take-profit (TP) level at $0.40.
Claim your Bitget sign-up bonuses here (details below).
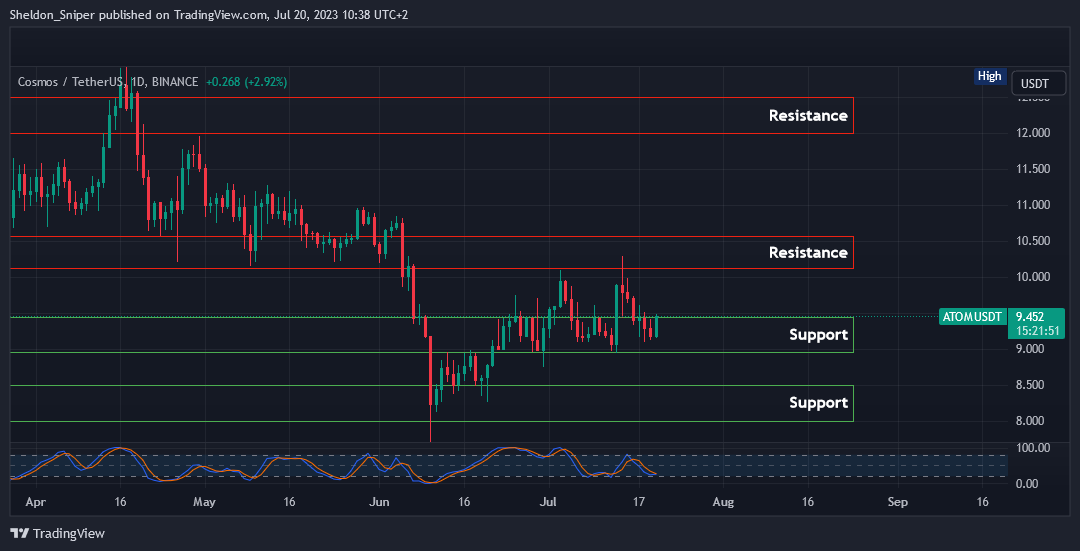
Chart #4 - Cosmos (ATOMUSDT) 1-Day Chart
Chartist: Sheldon
(For the chart screenshot, click here.)
ATOM is trading within the $9.00 - $9.50 support zone.
With the Stoch RSI on the daily having reset, it appears that the price is gearing up to test the next resistance areas of $10.25 - $10.50 and $12.00 - $12.50 (last tested in April).
As Bitcoin's price has stabilized above the crucial $30,000 level, and Bitcoin dominance continues to trend downwards, it suggests funds are flowing out of BTC and into altcoins. This could potentially set the stage for another altcoin rally over the next few weeks.
Claim your Bitget sign-up bonuses here (details below).
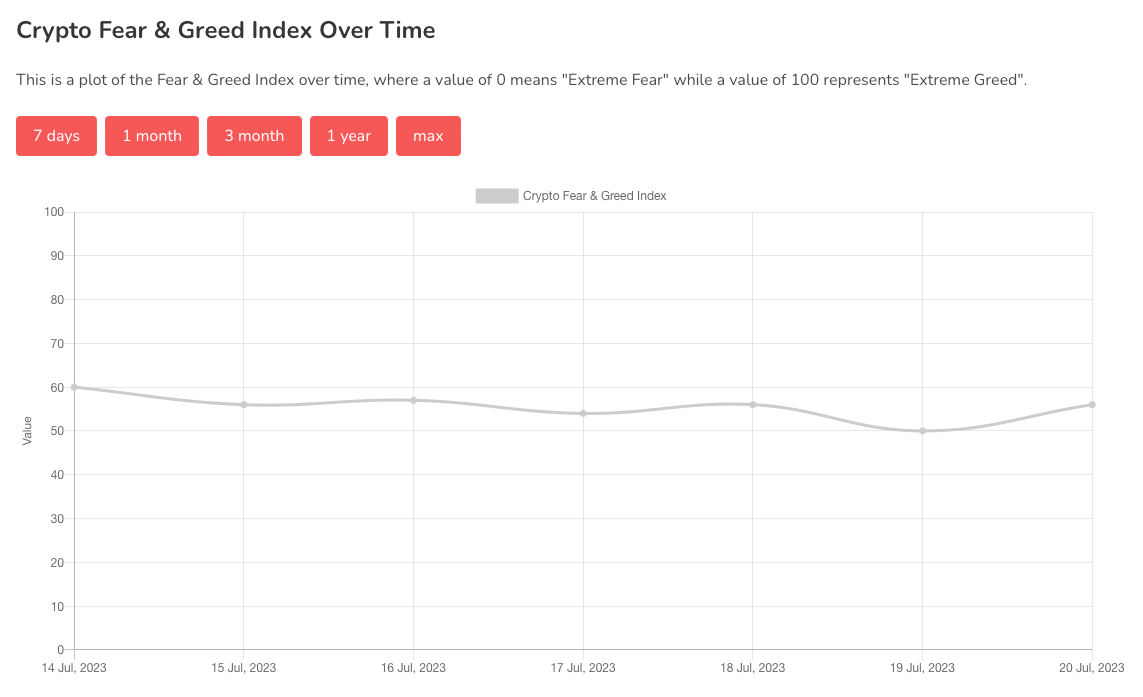
Chart #5 - Bitcoin Fear and Greed Index
The Bitcoin Fear and Greed Index is sitting at 56 today, indicating Greed.
The highest the index has been over the past seven days is 60, and the lowest is 50.
Banter’s Take
Expect the short squeeze to continue slightly higher for Bitcoin, but exercise caution if the price starts stalling at $30,500. If it fails to maintain that level, it may sweep the range lows at $29,200 again.
Stay safe my friends!
Go to our Crypto Banter Discord here where Sheldon and Kyle give updates on the charts and trades from The Daily Candle newsletter!