

📈📉 Lose THIS Level and SOL Goes to $26!
📈📉 Lose THIS Level and SOL Goes to $26!
Bulls Ready to PUMP THIS Altcoin HIGHER!
Overview
Chart #1 - U.S. Dollar (DXY) Daily
Chart #2 - Solana (SOLUSDT) 8-Hour
Chart #3 - Chainlink (LINKUSD) Daily
Chart #4 - Cardano (ADAUSDT) Daily
Chart #5 - Fear and Greed Index
Chart #1 - U.S. Dollar (DXY) Daily
Chartist: Sheldon
(For the chart screenshot, click here.)
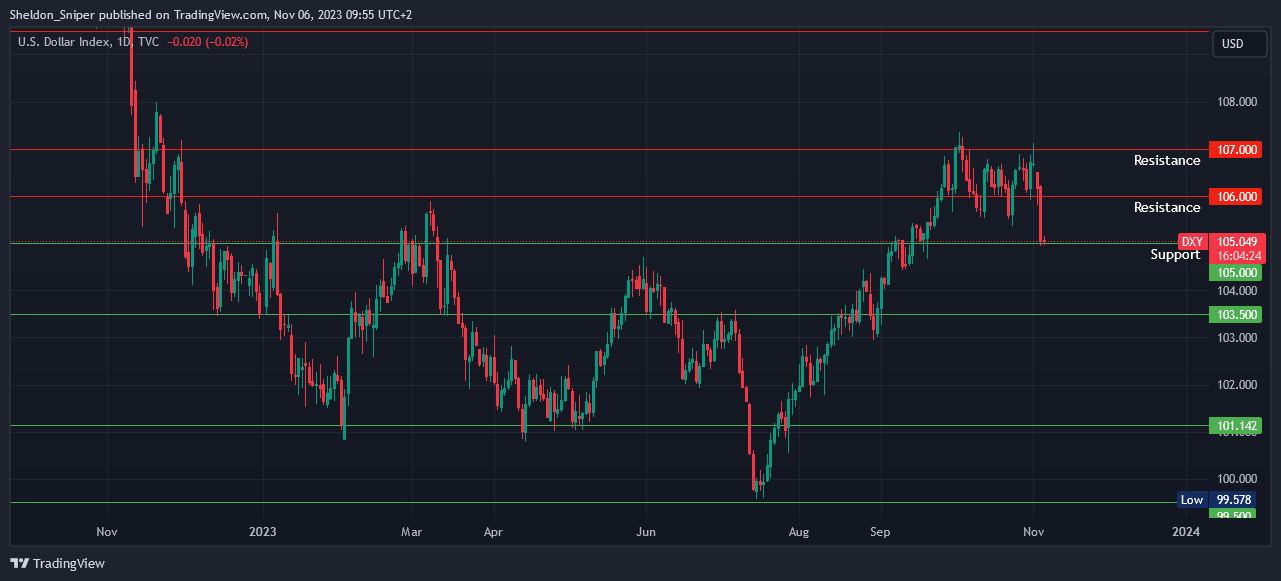
On Friday, the DXY dropped from just over 106.00 down to 105.00, and at the same time lost the five-week-old 105.50 support.
It’s on support at the moment, but I think that it will continue its trend to the downside over the next couple of weeks, but obviously not in a straight line. The DXY could firstly go up from here to test the break of the 105.50 level before reversing down again.
If the 105.00 level is lost, then the next major support is at 103.50, and after that at around 101.00.
Sign-up and trade on Bybit today.
Exclusive $30,000 deposit rewards and bonuses up for grabs!
Chart #2 - Solana (SOLUSDT) 8-Hour
Chartist: Kyle
(For the chart screenshot, click here.)
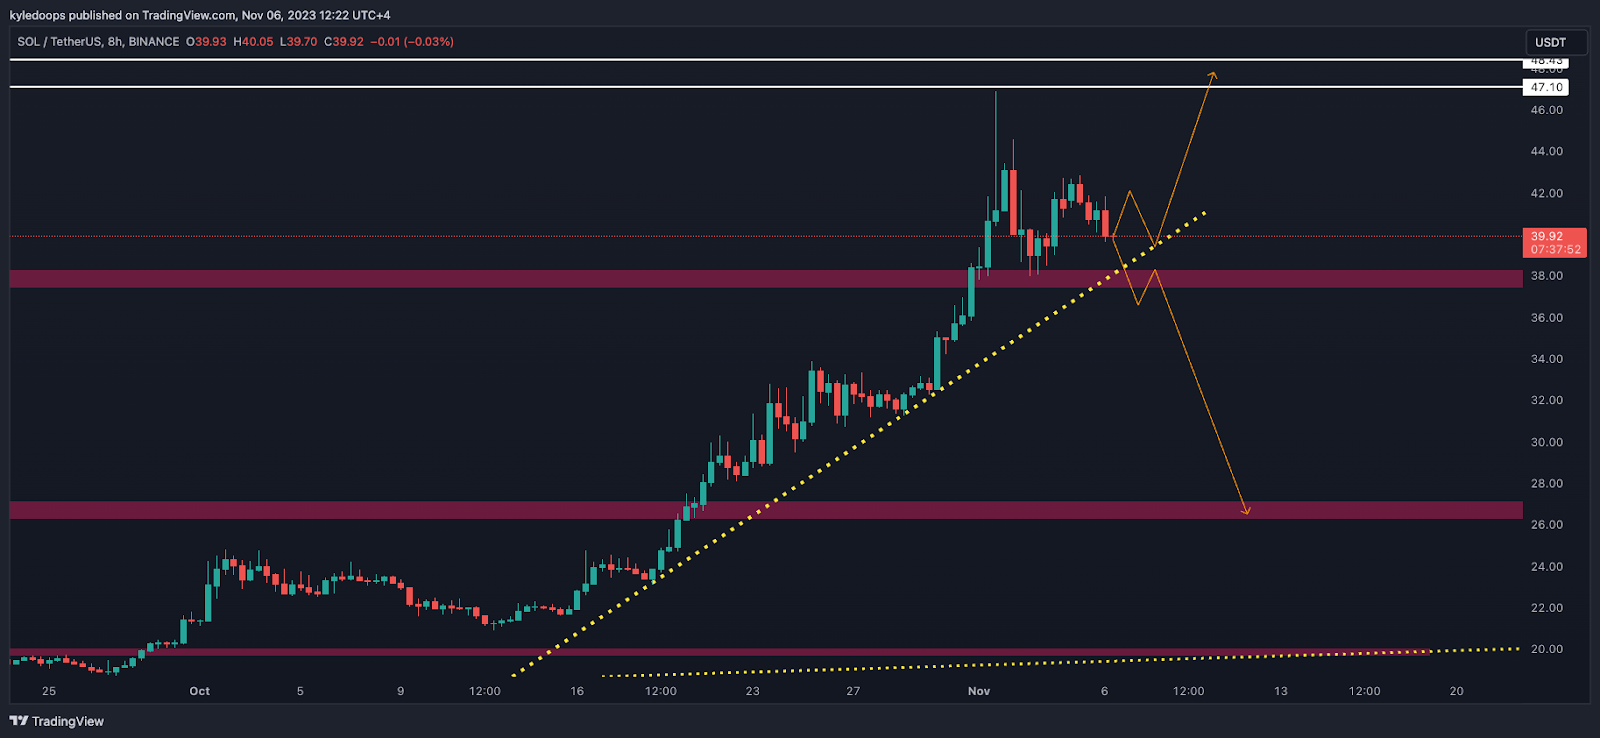
SOL may have topped in the short term, especially considering the Solana Breakpoint conference has come to an end.
Pay attention to the upsloping yellow dashed trend line; if it breaks, expect the price to continue to sell off down to $26.
If it holds $38, the new trading range will be between $38 and $48.
Claim your Bitget sign-up bonuses here (details below).

Outsmart 99% Of The Market!
Join the Whale Room and get full access into our Discord And Telegram group, where you'll find all of our premium content!
👉 Trade Signals!
👉 Trade Set-Ups!
👉 Trading Challenges!
👉 Education!
👉 SO MUCH MORE!
Chart #3 - Chainlink (LINKUSD) Daily
Chartist: Kyle
(For the chart screenshot, click here.)
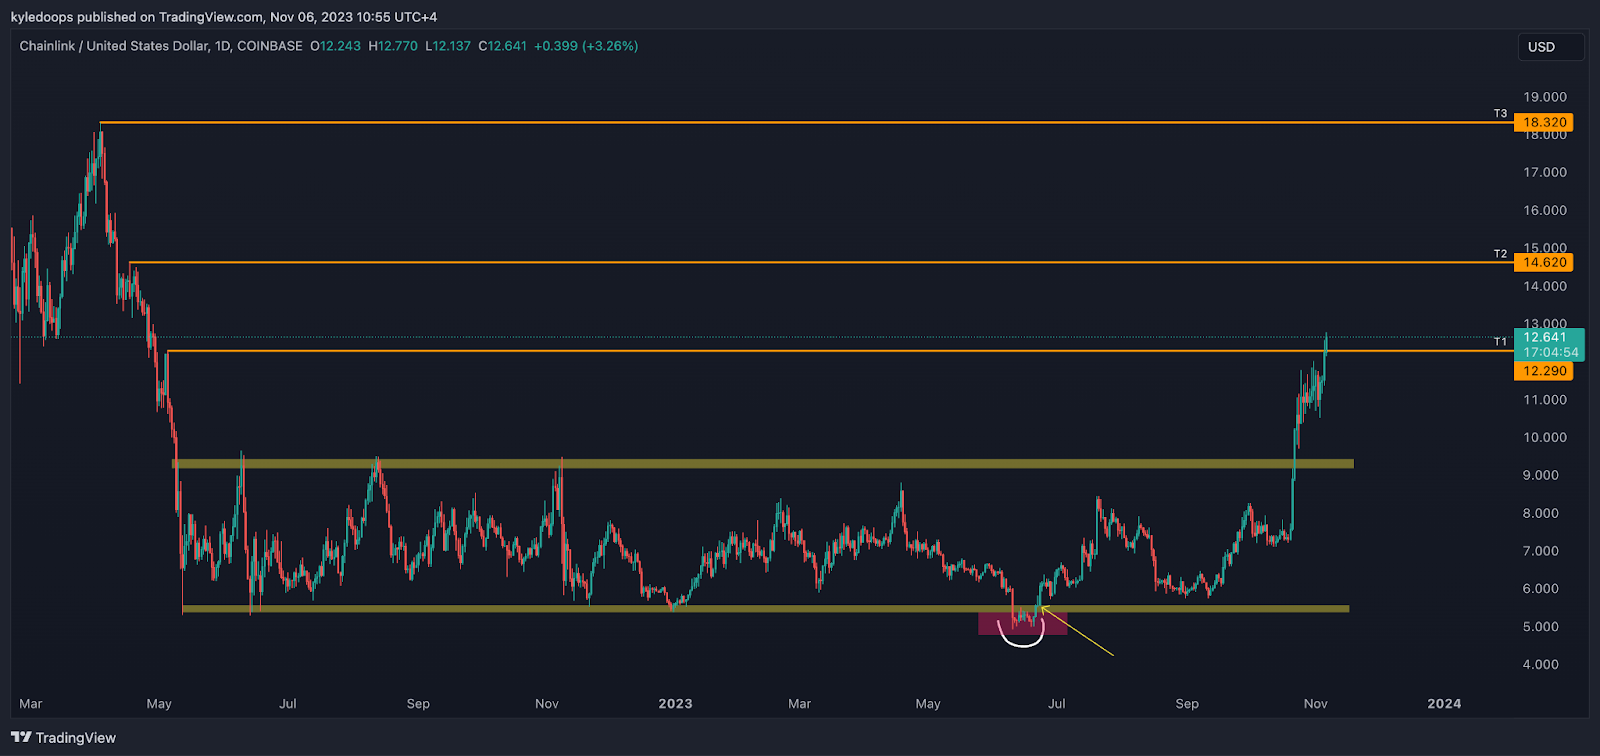
We got LINK at the yellow arrow at $5.
The price has expanded up to $12.29, and open interest on the hourly has picked up significantly, which means bulls will likely try to send this to $14.62.
That is Take Profit 2 (TP2) and the next major resistance.
Claim your Bitget sign-up bonuses here (details below).
Chart #4 - Cardano (ADAUSDT) Daily
Chartist: Sheldon
(For the chart screenshot, click here.)
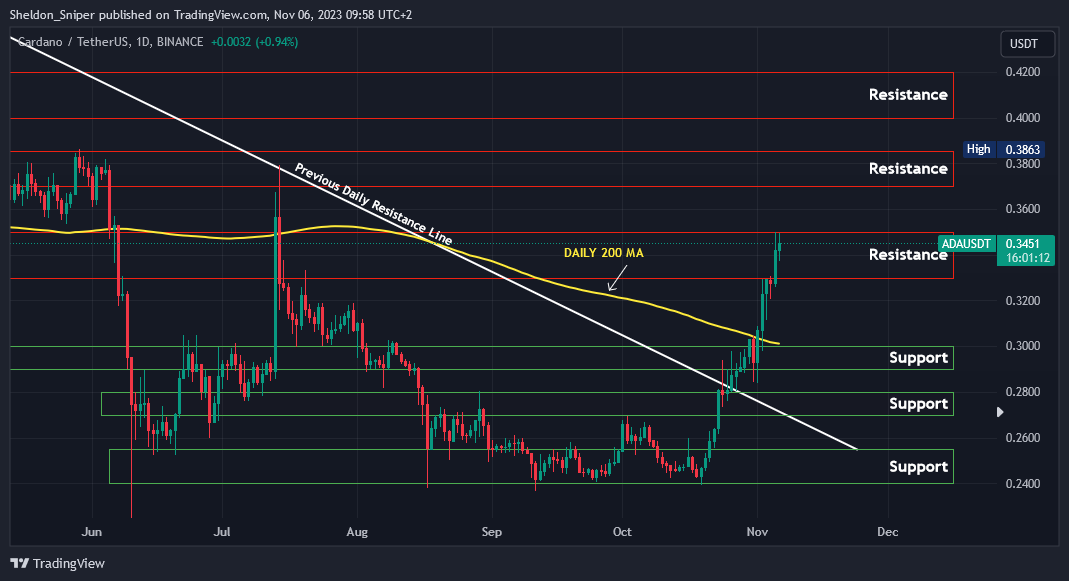
ADA has reached the $0.35 top of the range area of resistance. But, after running over the last two weeks, a correction could be imminent!
If it rejects and dumps here, the next support is the range low of $0.33, and if that does not hold, we could see $0.29 - $0.30.
If the price moves higher from here and breaks the $0.35 level of resistance, the next one is at $0.37 - $0.39.
Claim your Bitget sign-up bonuses here (details below).
🚀 Sniper School's New Cohort Begins November 7th!
Sniper School is a free 3-week trading course led by Sheldon. Dive deep into his strategies and insights to master the art of trading. Equip yourself with the skills to capitalize on market shifts and maximize your gains.
Limited Seats! With only 3,000 seats available, our waitlist fills up rapidly! Secure Your Seat Today!
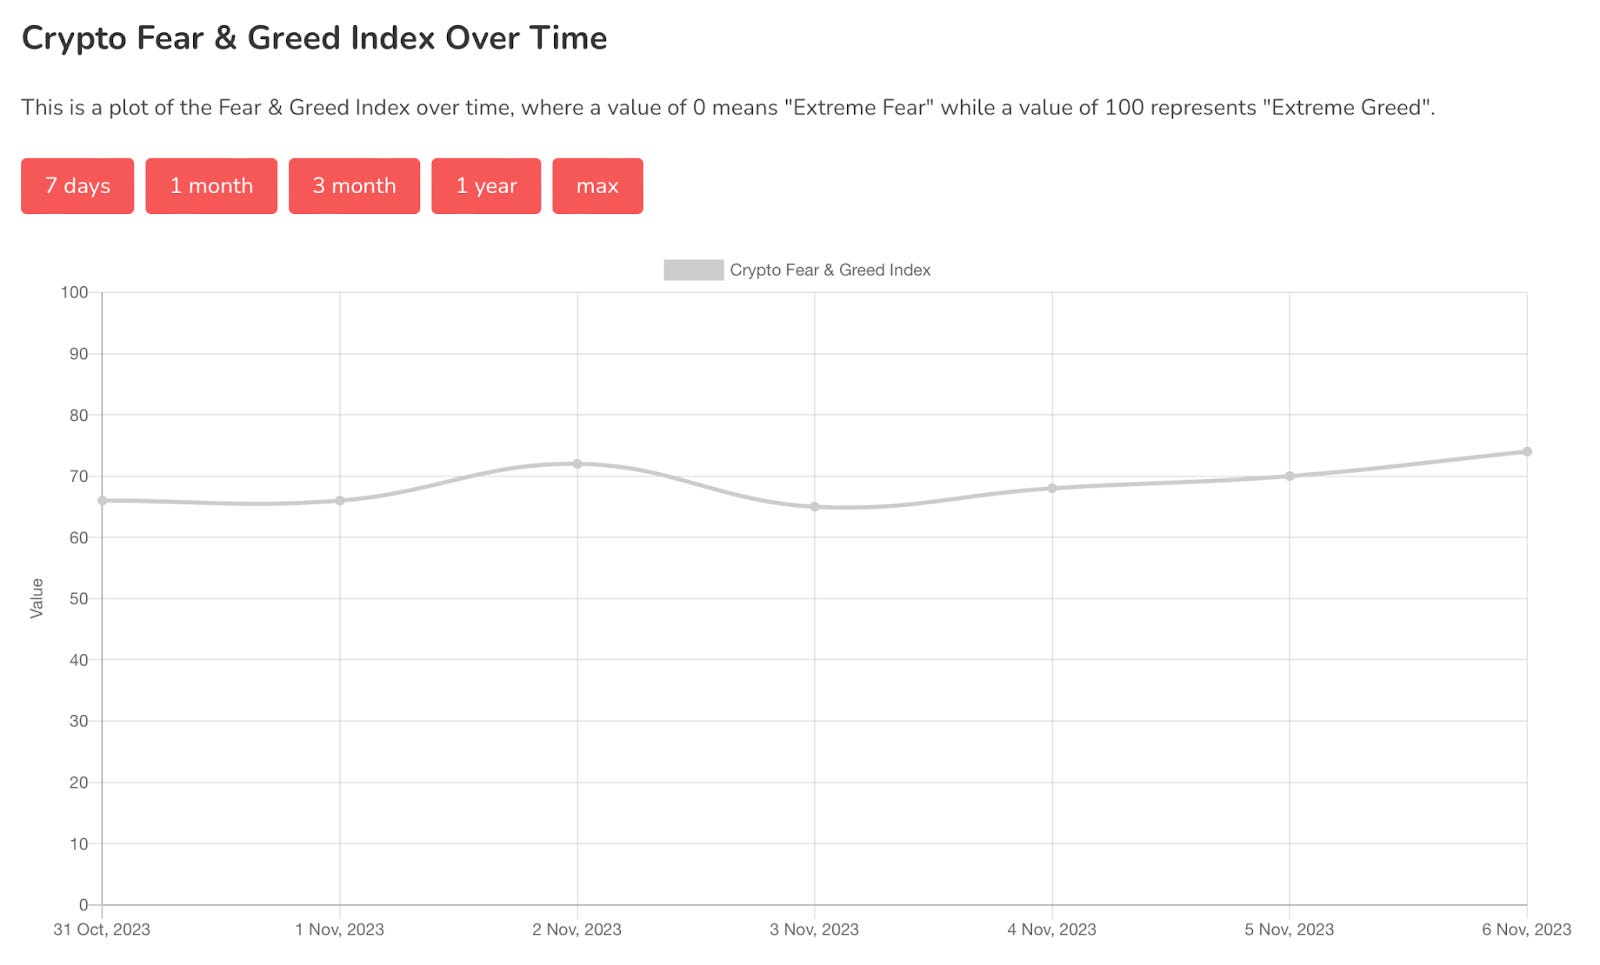
Chart #5 - Fear and Greed Index
The Fear and Greed Index is sitting at 74 today, indicating Greed.
The highest the index has been over the past seven days is 74, and the lowest is 65.
Banter’s Take
The stock market experienced a significant upward move but is now entering a lower high zone, so we need to keep a look out for a potential lower high getting set.
At the end of the day, crypto is behaving differently than the stock market, which means that even if it sets a lower high, it's not necessarily a death sentence for the crypto market.
Additionally, the DXY pulling back is also favorable for risk-on assets.
Stay safe my friends!
Go to our Crypto Banter Discord here where Sheldon and Kyle give updates on the charts and trades from The Daily Candle newsletter!