

📈📉 Major Bitcoin Long Opportunity Once It Hits This Level!
📈📉 Major Bitcoin Long Opportunity Once It Hits This Level!

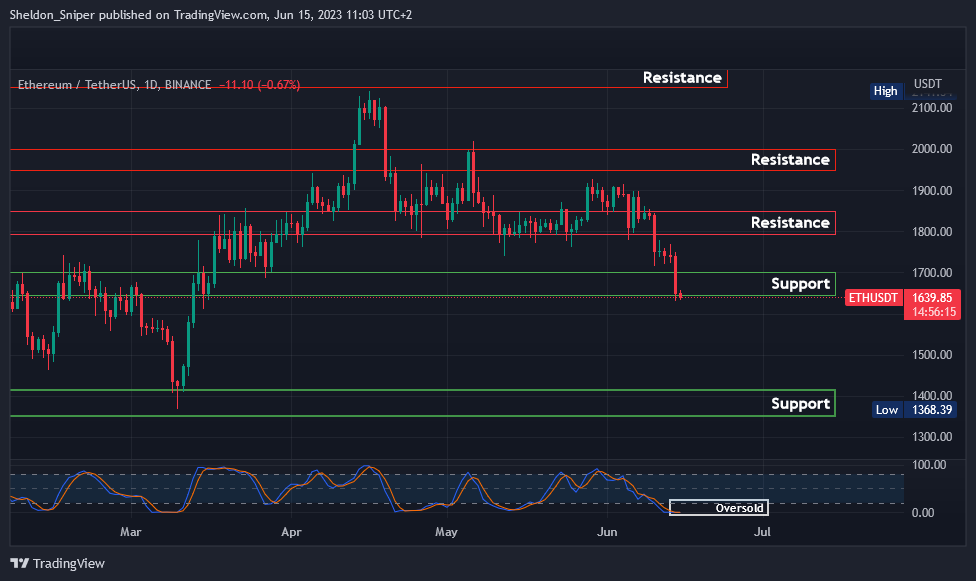
Chart #1 - Ethereum (ETHUSDT) 1-Day Chart
Chartist: Sheldon
(For the chart screenshot, click here.)
Earlier this week, ETH lost the significant $1,800 support level and has retraced down to the support zone at $1,650 - $1,700.
The price is oversold on higher time frames, but it can remain oversold for a while before it retraces back to the upside.
Today, it appears that the market is still trending to the downside, so if ETH loses the current support level, the next one is at $1,350 - $1,400.
Sign-up and trade on Bybit today.
Exclusive $30,000 deposit rewards and bonuses up for grabs!
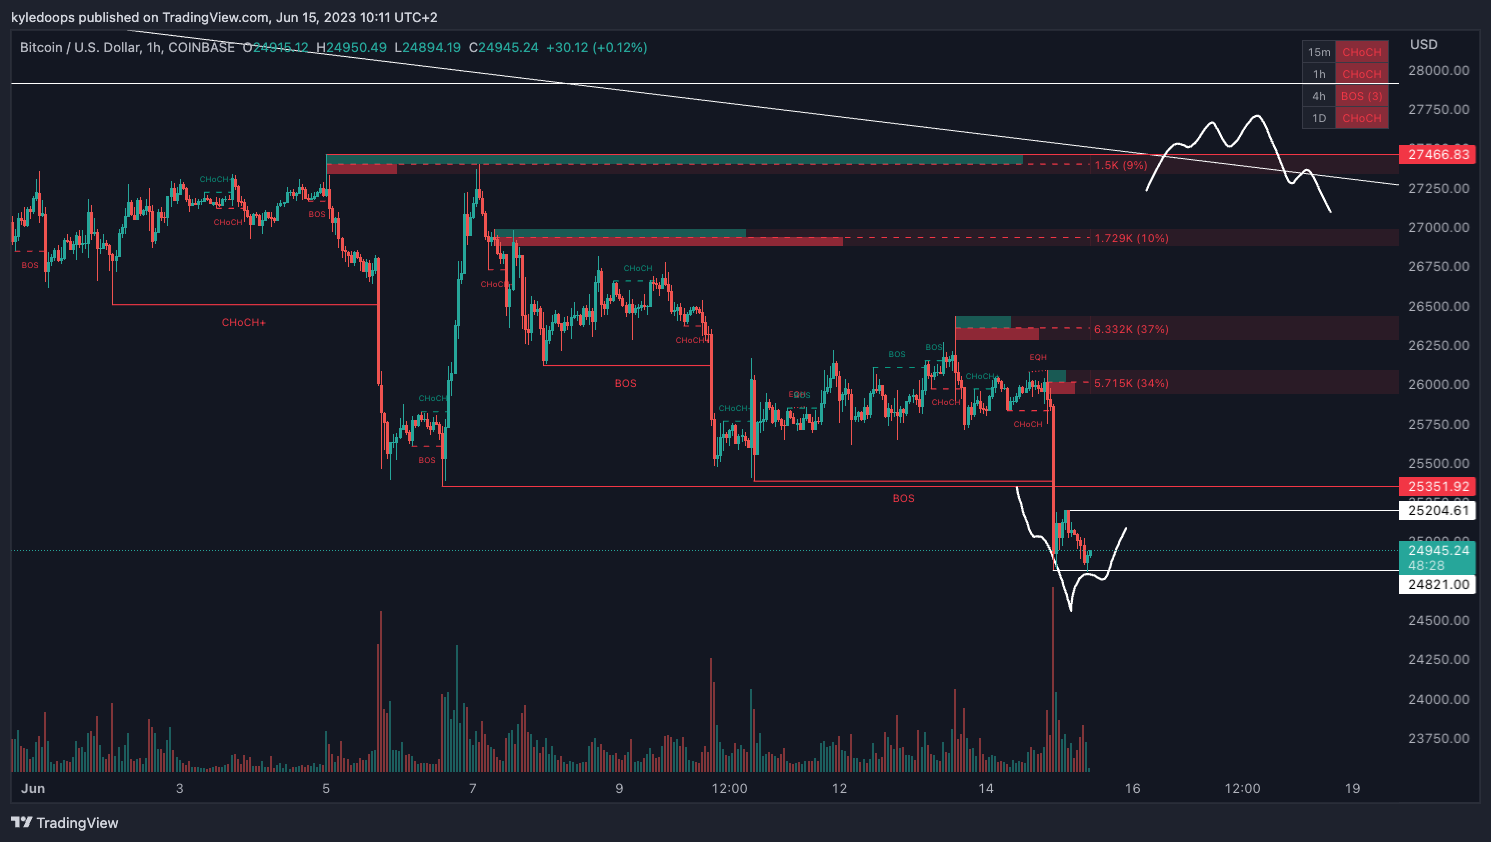
Chart #2 - Bitcoin (BTCUSD) 1-Hour Chart
Chartist: Kyle
(For the chart screenshot, click here.)
Here's an update based on yesterday's BTC analysis.
Yesterday, we were looking for a sweep of liquidity at either the lows (higher probability) or the highs (lower probability).
Since BTC ended up sweeping the lows first, we should now be looking for a reclaim of that level ($25,351). If the price starts closing back above that level, then we are back in the range and I would then target the other side of the liquidity at $27,466.
𝗣𝗿𝗶𝗺𝗲 𝗫𝗕𝗧
Sign up for a new Trading Account on Prime XBT!
Receive a deposit bonus of up to $7,000 with promo code: KyleDoops

Sign up for a new Trading Account on Prime XBT!
Receive a deposit bonus of up to $7,000 with promo code: SheldonSniper
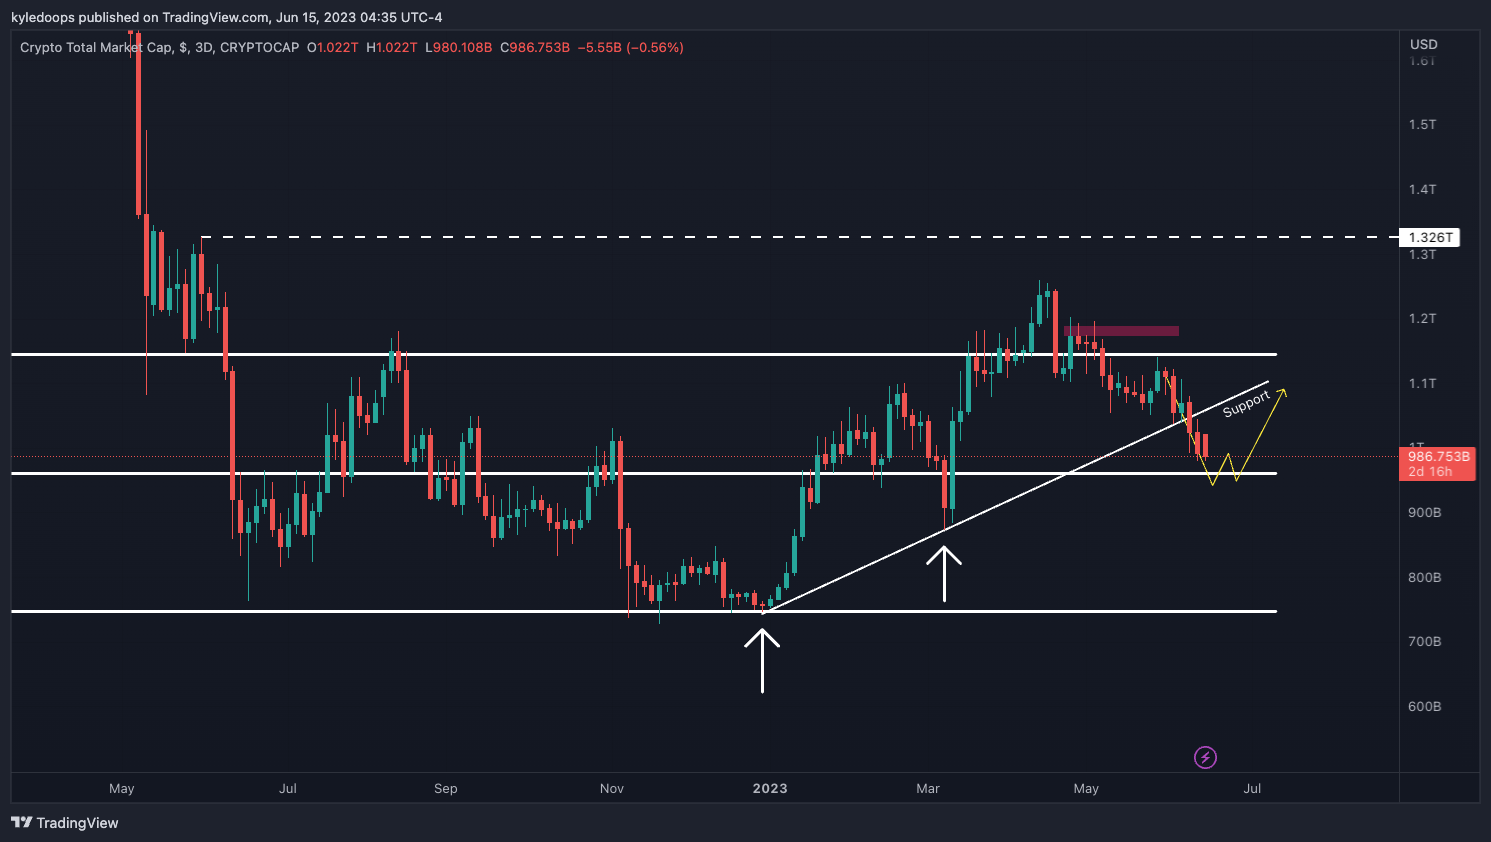
Chart #3 - TOTAL 3-Day Chart
Chartist: Kyle
(For the chart screenshot, click here.)
The 3-day chart for the total market cap is showing a test of the mid-range and $960 Billion.
If bulls defend this level, it will most likely be a result of Bitcoin bulls piling into the market, more so than from capital flowing into altcoins.
A loss of that level would be doubly bad for alts, since dominance is still in favor of Bitcoin.
Claim your Bitget sign-up bonuses here (details below).
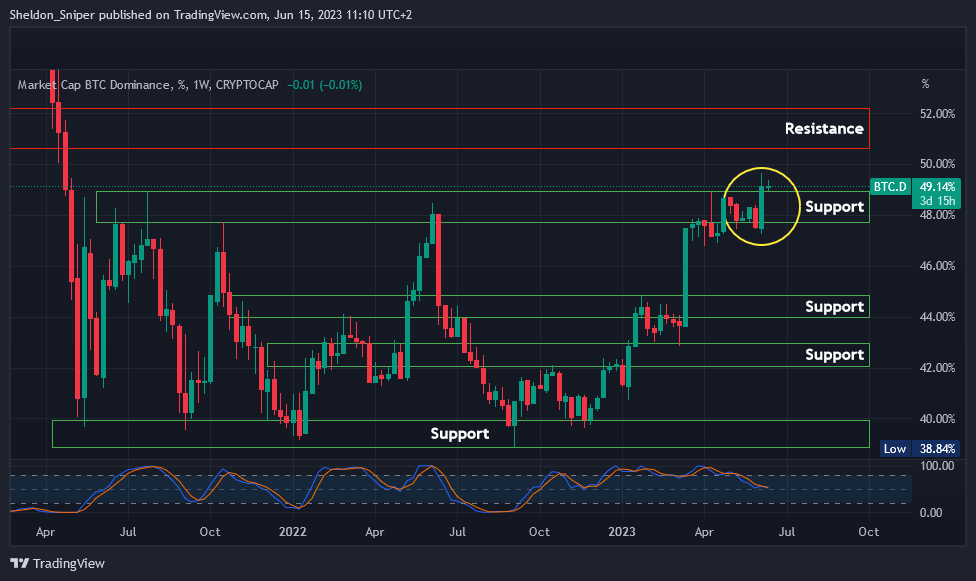
Chart #4 - Bitcoin Dominance (BTC.D) 1-Week Chart
Chartist: Sheldon
(For the chart screenshot, click here.)
Over the past two weeks, we have seen the first signs of Bitcoin Dominance possibly breaking out of the 39% - 48% range that it has been in for the last two years.
And that’s all after the SEC announced it is taking legal action against Binance.US for a number of altcoins that it has trading on its platform. This has led to a general altcoin sell-off, resulting in a spike in the BTC.D.
If altcoins continue to sell off, BTC.D could reach 51% - 52% soon!
Claim your Bitget sign-up bonuses here (details below).
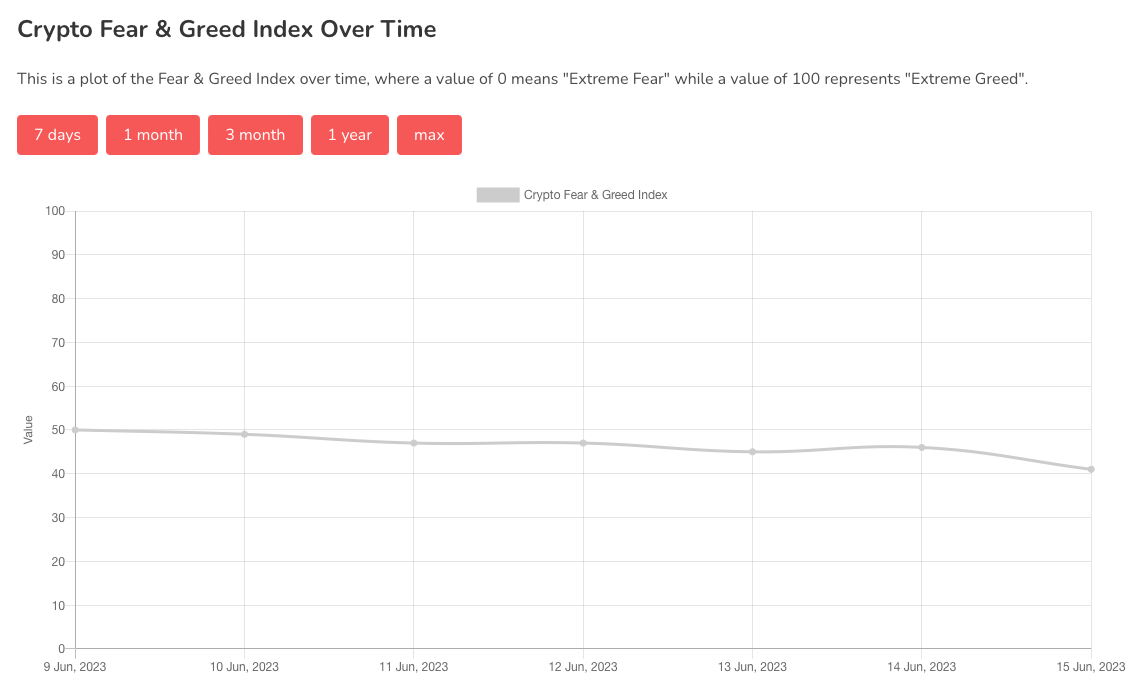
Chart #5 - Bitcoin Fear and Greed Index
The Bitcoin Fear and Greed Index is sitting at 41 today, indicating Fear.
The highest the index has been over the past seven days is 50, and the lowest is 41.
Banter’s Take
Although both ETH and BTC appear to be clinging on by a final thread, market participants should anticipate that prices might drop through those support levels.
This is where major players get their orders filled by scaring retail out of their positions. The drop of support will shake retail investors out. A reclaim of those support levels would be our confirmation the shakeout is complete.
Stay safe my friends!
Go to our Crypto Banter Discord here where Sheldon and Kyle give updates on the charts and trades from The Daily Candle newsletter!