

📈📉 Major Render (RNDR) Short Trade Spotted!
📈📉 Major Render (RNDR) Short Trade Spotted!

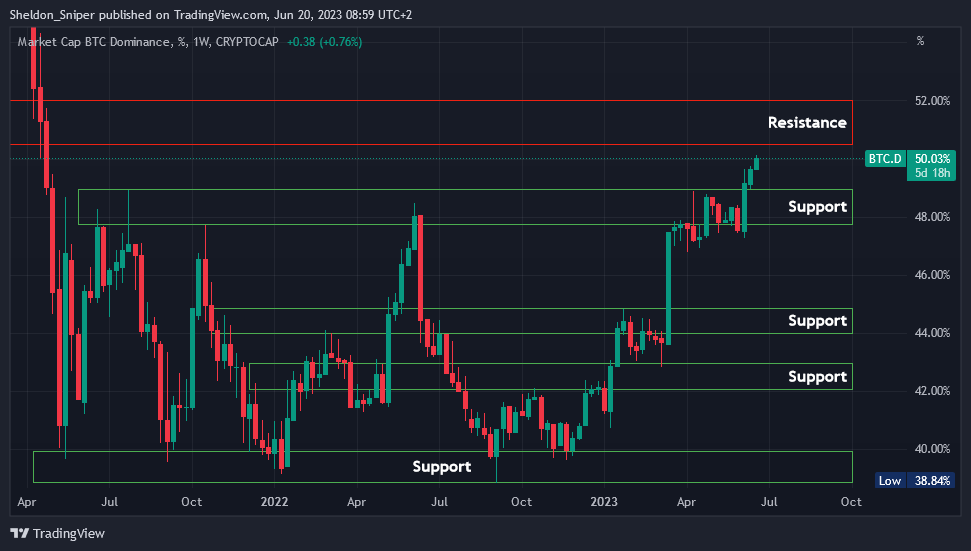
Chart #1 - Bitcoin Dominance (BTC.D) 1-Week Chart
Chartist: Sheldon
(For the chart screenshot, click here.)
After Bitcoin Dominance broke out of a two-year range two weeks ago, it has continued its upward trend.
However, it is now approaching the first resistance area, which ranges from 50.50% - 52%.
Should there be a rejection here, we might see a retrace back down to retest the previous monthly range high resistance of 49%, which will now serve as support. Alts are currently oversold, so a potential rejection at 50.50% could cause them to rally.
Sign-up and trade on Bybit today.
Exclusive $30,000 deposit rewards and bonuses up for grabs!
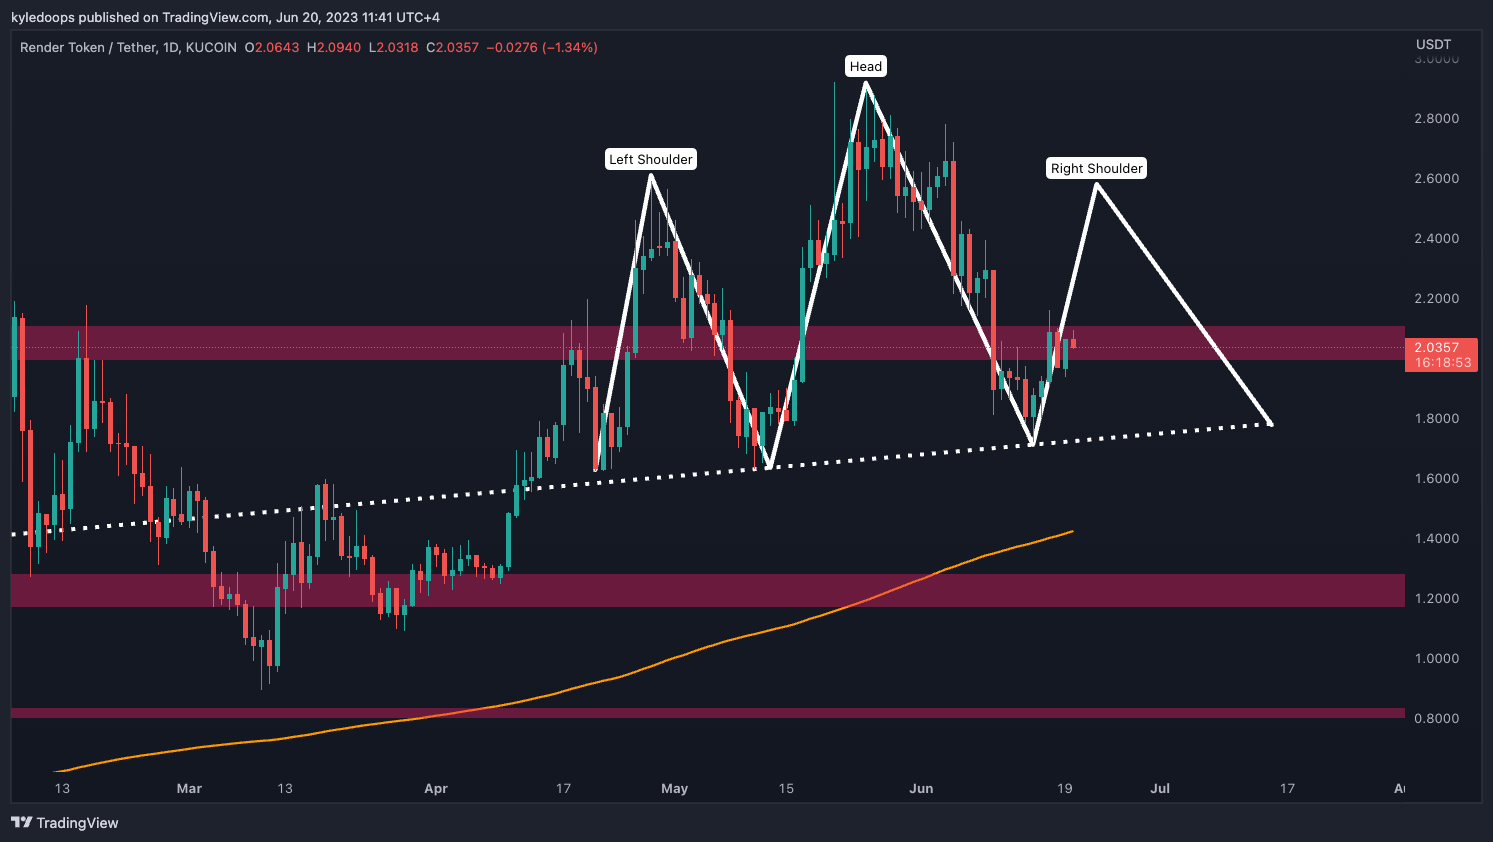
Chart #2 - Render (RNDRUSDT) 1-Day Chart
Chartist: Kyle
(For the chart screenshot, click here.)
It's too soon to call, but we should add this to our watchlist for the time being.
RNDR could potentially be forming a head and shoulders pattern, which means now is the time to watch for a lower high.
If a lower high forms, this will represent the right shoulder of the pattern. A break below $2 would confirm a major short trade, which could send RNDR down to $1.20.
𝗣𝗿𝗶𝗺𝗲 𝗫𝗕𝗧
Sign up for a new Trading Account on Prime XBT!
Receive a deposit bonus of up to $7,000 with promo code: KyleDoops

Sign up for a new Trading Account on Prime XBT!
Receive a deposit bonus of up to $7,000 with promo code: SheldonSniper
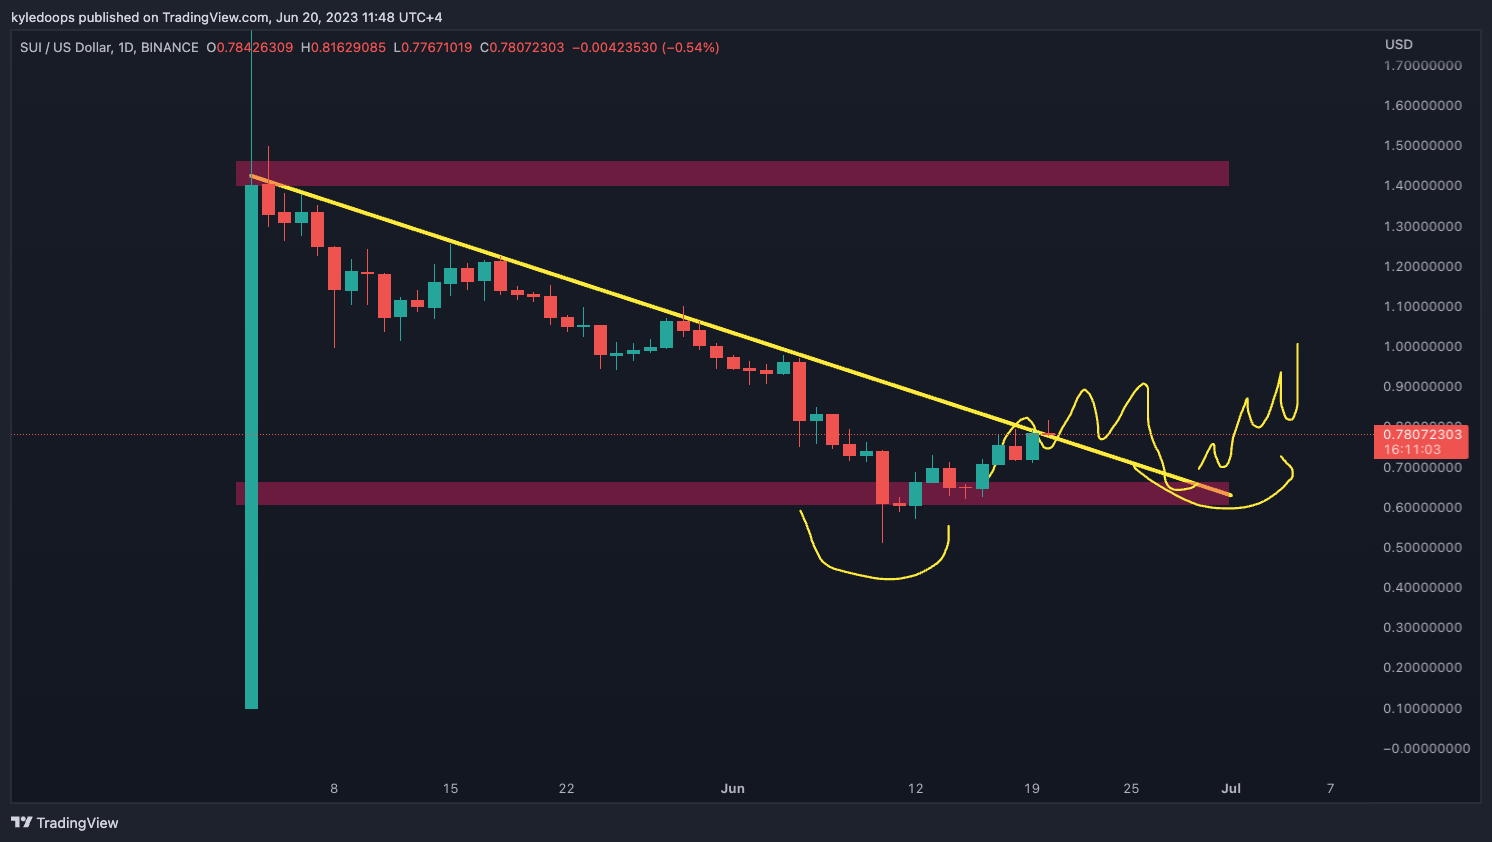
Chart #3 - Sui (SUIUSD) 1-Day Chart
Chartist: Kyle
(For the chart screenshot, click here.)
For those considering purchasing SUI, it might be best to wait for a break above the diagonal downtrend, followed by a bullish retest which would create a higher low.
In practical terms, this means the price would need to rise towards $0.90, then retrace back down to approximately $0.67 to form the next higher low.
Claim your Bitget sign-up bonuses here (details below).
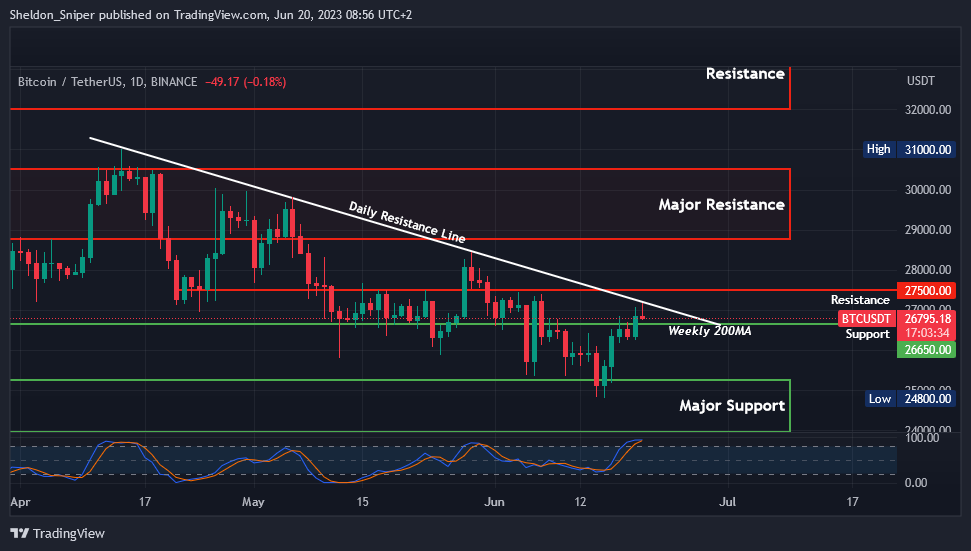
Chart #4 - Bitcoin (BTCUSDT) 1-Day Chart
Chartist: Sheldon
(For the chart screenshot, click here.)
Yesterday, Bitcoin managed to reclaim the important weekly 200 Moving Average, after the price managed to break through the $26,600 area of resistance.
This morning, however, there has been a slight retrace in price after it got rejected at the daily descending resistance line originating from mid-April.
The price is currently trading at $26,800. For further upward continuation, it needs to break the daily resistance line at approximately $27,000. The first area to test, following this, would be the next resistance area at $27,500. After that, the major area of resistance lies between $28,800 and $30,500.
If the price retraces further, the next major support below the weekly 200 Moving Average stands between $23,800 and $25,300, an area last tested about a week ago.
Claim your Bitget sign-up bonuses here (details below).
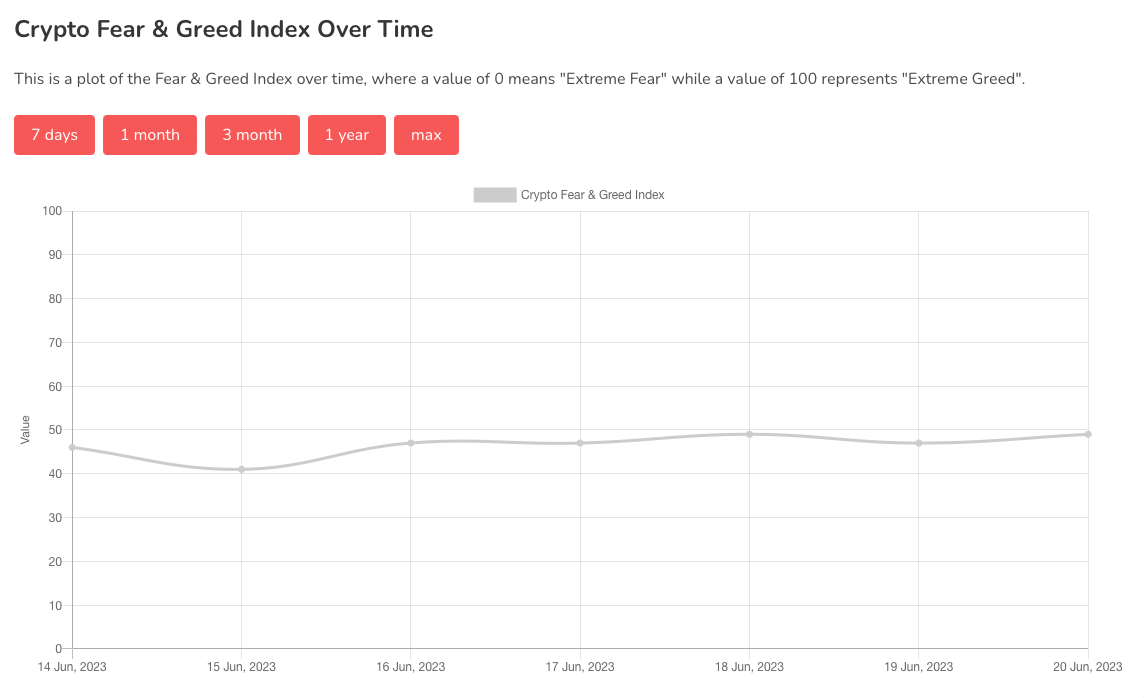
Chart #5 - Bitcoin Fear and Greed Index
The Bitcoin Fear and Greed Index is sitting at 49 today, Neutral.
The highest the index has been over the past seven days is 49, and the lowest is 41.
Banter’s Take
Bitcoin is currently encountering resistance. To maintain momentum, bulls need to hold the $26,200 mark. A break above the diagonal trend line for Bitcoin would pave the way for potentially hitting $27,400.
However, remember that this is a liquidity void and until the price consolidates above that level, high timeframe bullish setups cannot be confirmed.
Stay safe my friends!
Go to our Crypto Banter Discord here where Sheldon and Kyle give updates on the charts and trades from The Daily Candle newsletter!