

📈📉 Make a Quick +45% Profit if THIS Level Holds!
📈📉 Make a Quick +45% Profit if THIS Level Holds!
CAUTION! AVOID Trading TIA Until THIS Level Clears!
Overview
Chart #1 - Crypto Total Market Cap (TOTAL) 12-Hour
Chart #2 - Celestia (TIAUSD) 12-Hour
Chart #3 - Myro (MYROUSDT) 12-Hour
Chart #4 - Aptos (APTUSDT) 8-Hour
Chart #5 - Fear and Greed Index
Chart #1 - Crypto Total Market Cap (TOTAL) 12-Hour
Chartist: Sheldon
(For the chart screenshot, click here.)
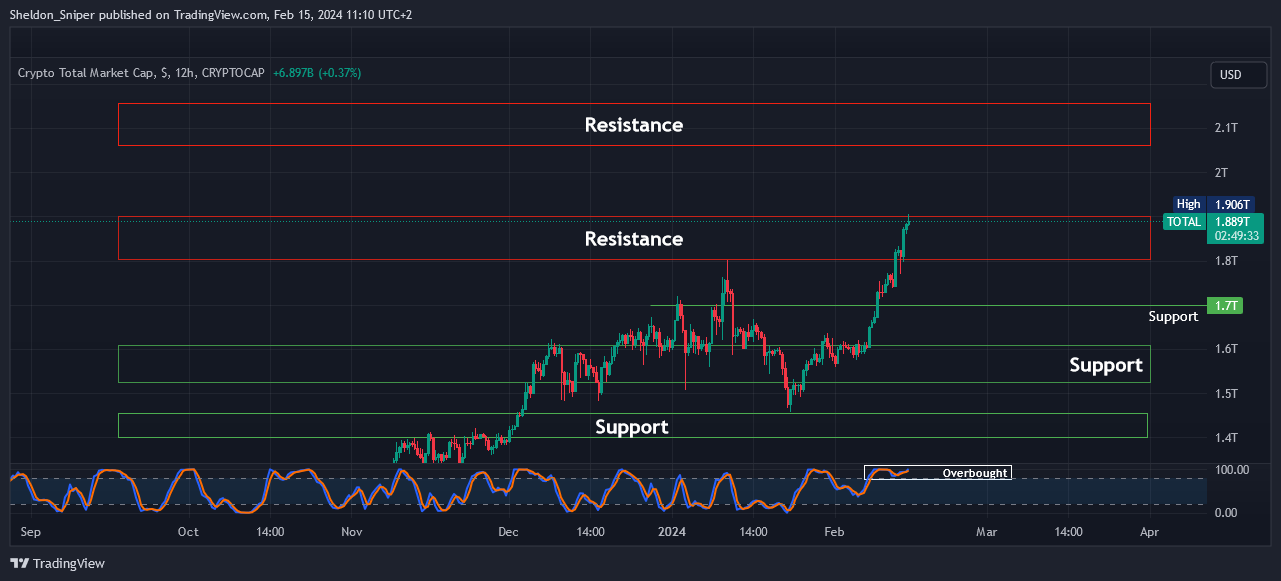
The TOTAL is facing resistance, so we might get a minor pullback in the market in the next day or two. A healthy correction would be good after this pump.
It is testing the upper range resistance level of $1.90 trillion and is overbought. If it faces rejection here and begins to trend downward, the next support is at the lower range of resistance at $1.80 trillion. Should this level fail to hold, we could see a further decline to test the smaller support level of $1.70 trillion.
Sign-up and trade on Bybit today.
Exclusive $30,000 deposit rewards and bonuses up for grabs!
Chart #2 - Celestia (TIAUSD) 12-Hour
Chartist: Kyle
(For the chart screenshot, click here.)
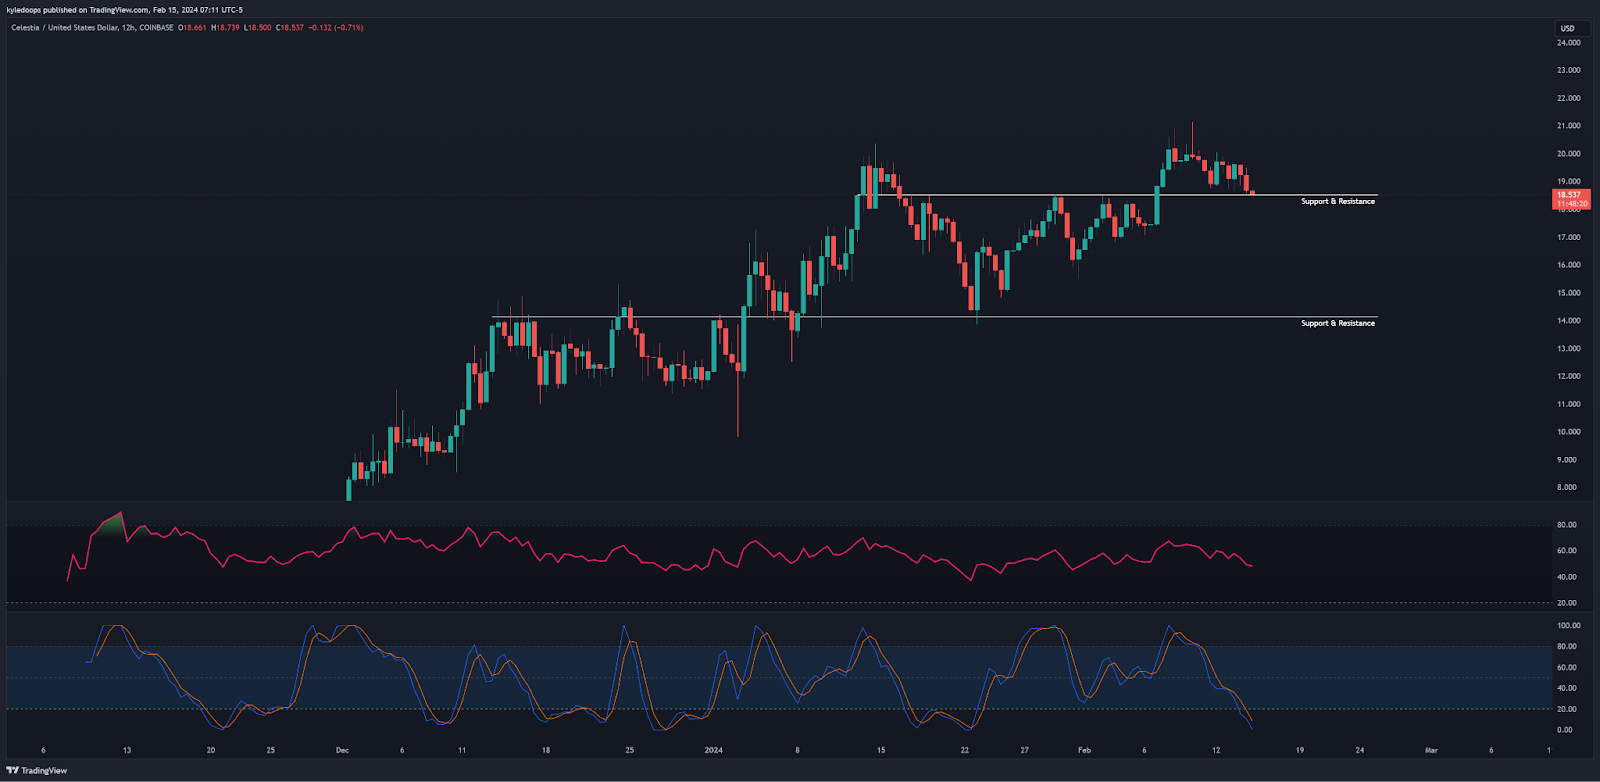
TIA is currently at a support/resistance level, and it remains to be seen whether it will hold or break.
Avoid entering short positions unless it clears the $18.5 mark!
There's potential for a deviation and a bounce from $17.64. Bulls need to defend this level here and now if we aim to continue upward.
The next key support level is at $14.14.
Claim your Bitget sign-up bonuses here (details below).

Outsmart 99% Of The Market!
Get full access into our Discord And Telegram group, where you'll find all of our premium content!
👉 Trade Signals!
👉 Trade Set-Ups!
👉 Trading Challenges!
👉 Education!
👉 SO MUCH MORE!
Chart #3 - Myro (MYROUSDT) 12-Hour
Chartist: Kyle
(For the chart screenshot, click here.)
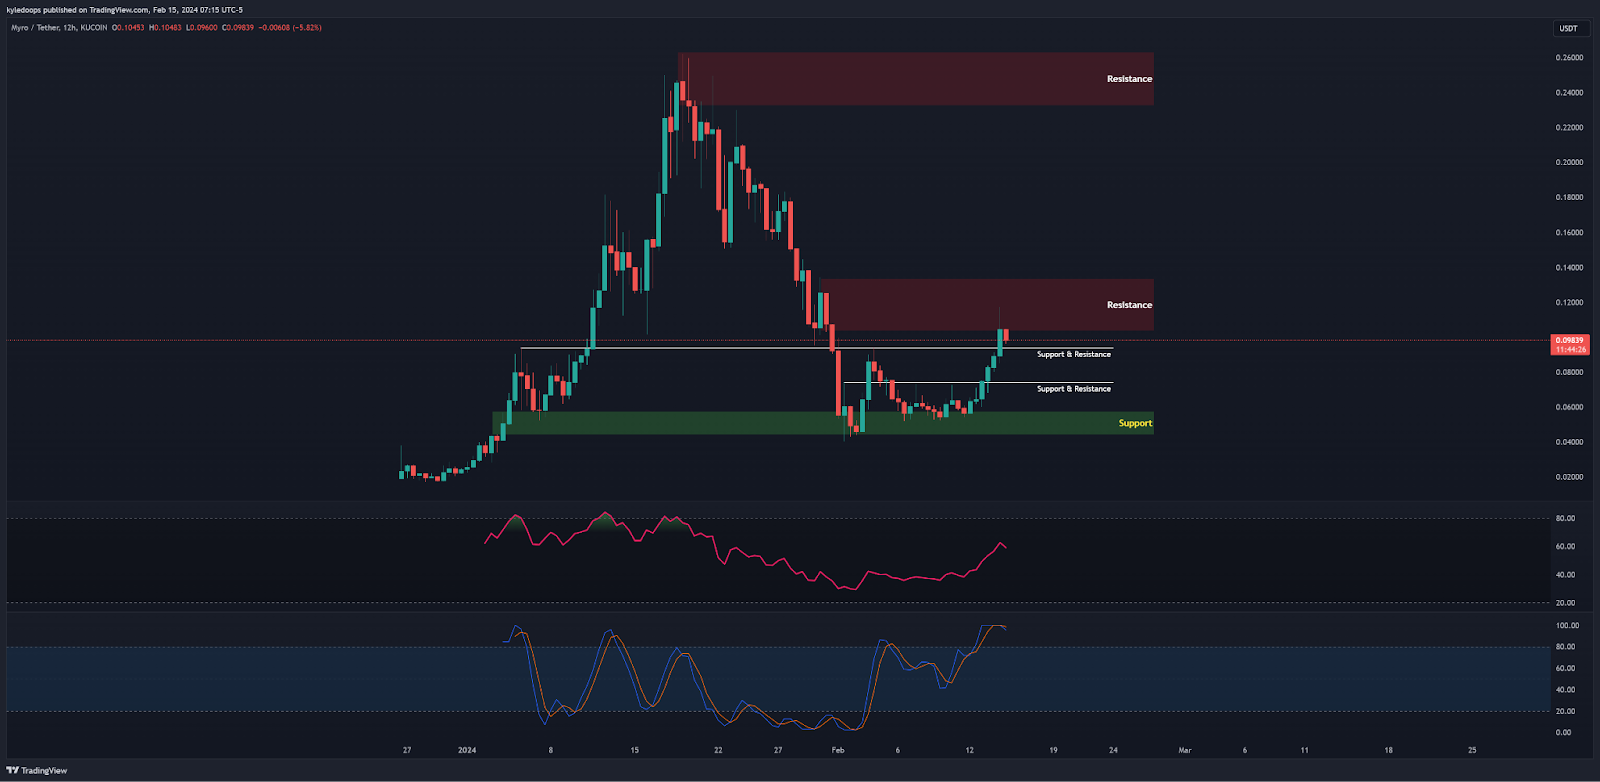
MYRO is reacting to the resistance at $0.104 and is moving towards the next support level at $0.093.
If it fails to hold that, it could head to $0.074.
This is all because it encountered a massive sell order block. Bulls need to step up to maintain MYRO's position.
Claim your Bitget sign-up bonuses here (details below).
Chart #4 - Aptos (APTUSDT) 8-Hour
Chartist: Sheldon
(For the chart screenshot, click here.)
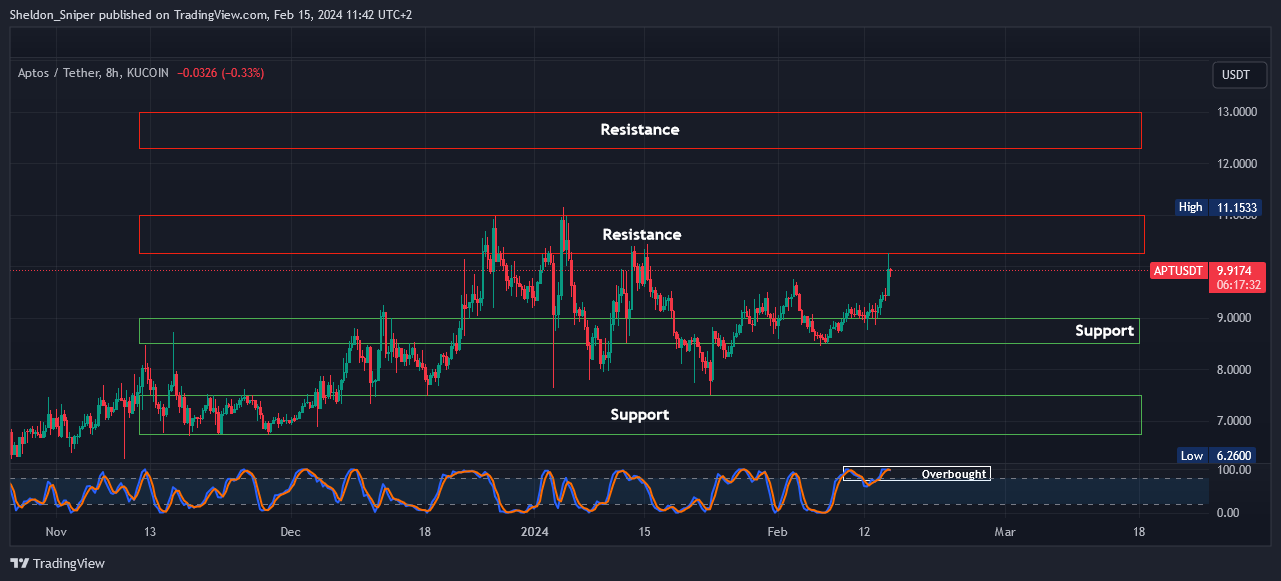
APT is testing the resistance area of $10.30 - $11.00, and with the price being overbought on the 8-hour chart, there might be a rejection in the next day or two.
The first support level is around $9.00.
If that level holds, I will probably enter a long trade, planning to take profit at the next resistance areas of $10.30 - $11.00, followed by around $12.30 - $13.00. Assuming we go from $9.00 to $13.00, that’s roughly a 45% gain!
My stop loss would be placed just below $8.50.
Claim your Bitget sign-up bonuses here (details below).
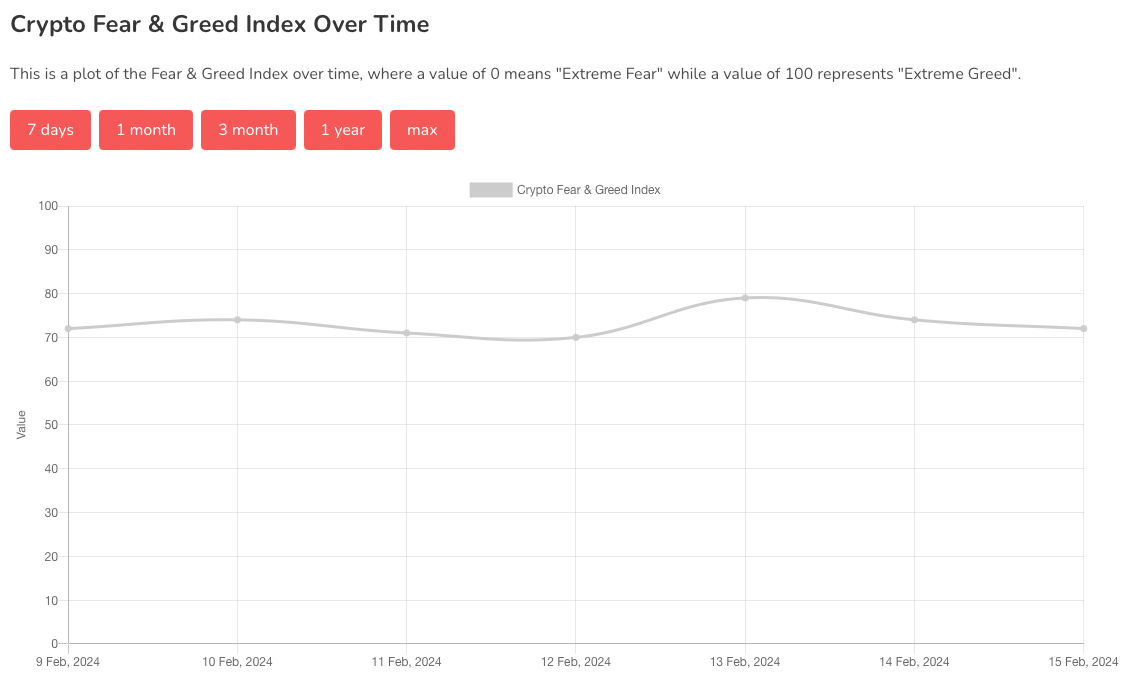
Chart #5 - Fear and Greed Index
The Fear and Greed Index is sitting at 72 today, indicating Greed.
The highest the index has been over the past seven days is 79, and the lowest is 70.
Banter’s Take
Bitcoin shows no signs of weakness. Our approach remains to tackle this one level at a time. The next minor sell wall is located at $53,000, which, personally, I don't expect to pose any significant obstacle!
Stay safe my friends!
Go to our Crypto Banter Discord here where Sheldon and Kyle give updates on the charts and trades from The Daily Candle newsletter!