

📈📉 Market PUMP! Is LINK Ready to Explode?
📈📉 Market PUMP! Is LINK Ready to Explode?
PLUS: THIS is the Primary Risk for Crypto Right NOW!
Overview
Chart #1 - Bitcoin Macro Emotional Cycle (on BTCUSD) Weekly
Chart #2 - Ethereum (ETHUSDT) Daily
Chart #3 - Chainlink (LINKUSD) Daily
Chart #4 - S&P 500 Futures (ES1!) Daily
Chart #5 - Ethereum Dominance (ETH.D) Weekly
Chart #6 - Fear and Greed Index

Chart #1 - Bitcoin Macro Emotional Cycle (on BTCUSD) Weekly
Chartist: Sheldon
(For the chart screenshot, click here.)
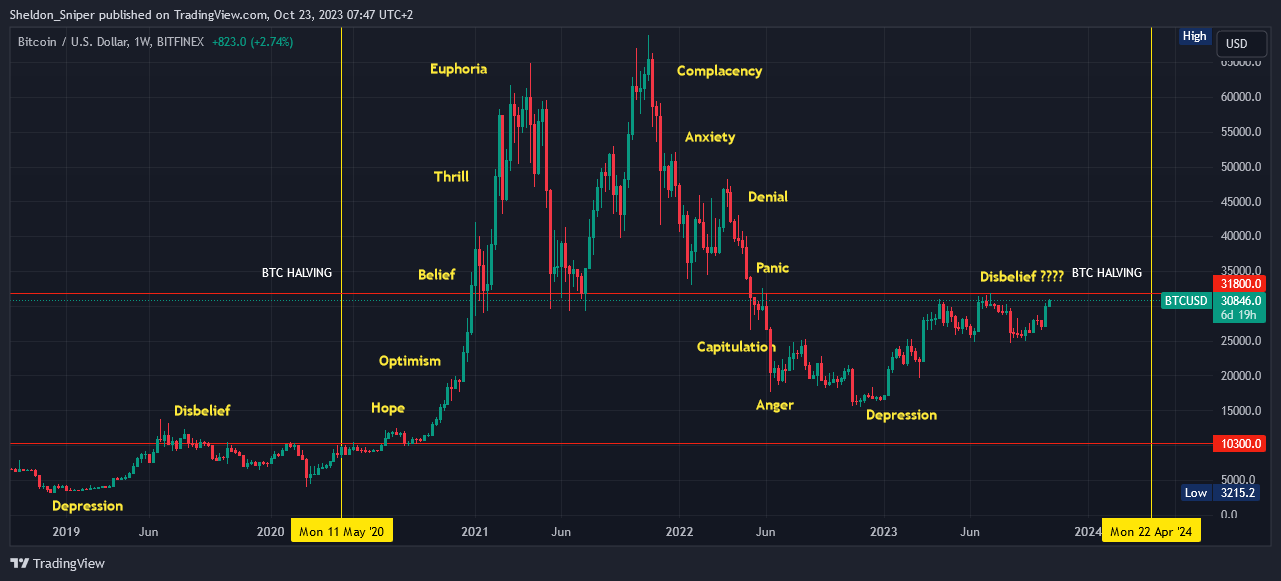
Over the past ten months, Bitcoin has rallied from a low around $15,600, to the current yearly high at the big $31,800 resistance level.
Observing the Wall St. Emotional Cycle on the weekly, we transitioned from the Depression Phase at the end of the previous year to the current Disbelief Phase.
Examining the 11 months prior to the previous BTC halving event - the last six months of 2019 and the first five months of 2020 - BTC remained below the major $10,300 resistance level for eight months, before retracing in March 2020 during the Covid scare. The ascent to $10,300 during that period represented the Disbelief phase of that cycle.
With the next BTC halving scheduled for April of the coming year, the market might once again be in the Disbelief Phase, provided Bitcoin maintains below $31,800 on higher time frames.
Sign-up and trade on Bybit today.
Exclusive $30,000 deposit rewards and bonuses up for grabs!
Chart #2 - Ethereum (ETHUSDT) Daily
Chartist: Sheldon
(For the chart screenshot, click here.)
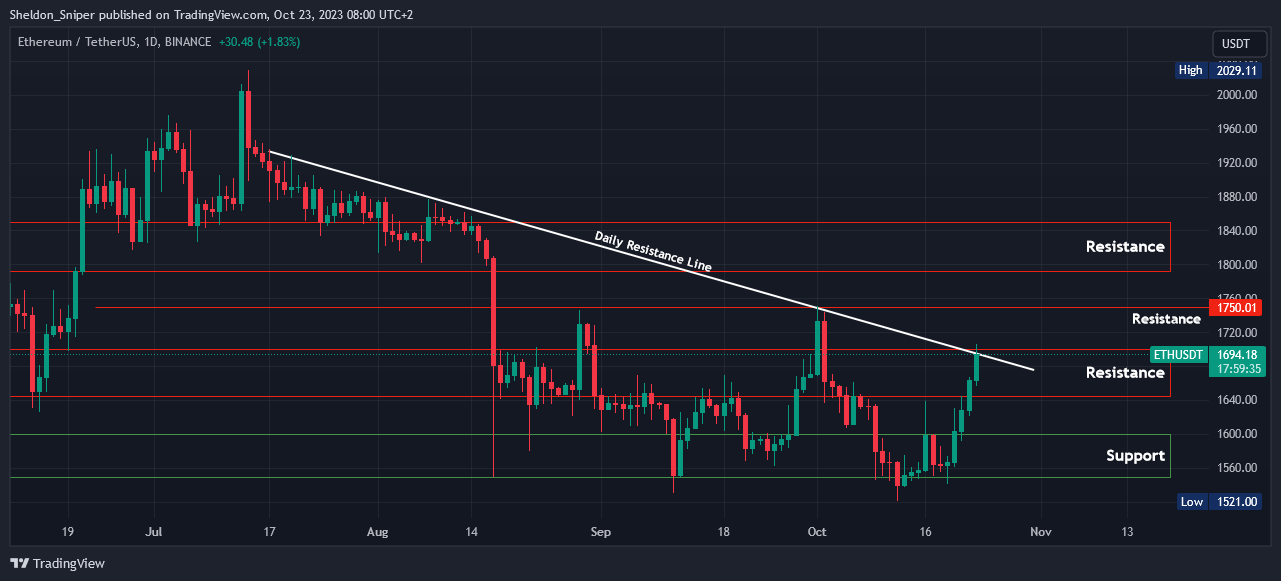
ETH has reached both the $1,700 level of resistance and the descending resistance line that originates from mid-July.
The market has been strong over the past few days, and I am now anticipating a potential retrace, during which ETH might correct to test lower support levels. The first level of support is at the range low, around $1,640, with the subsequent support level at $1,600.
If ETH manages to break through here, the next resistance is at $1,750. This level was tested at the end of August and again at the beginning of October.
Sign-up and trade on Bybit today.
Exclusive $30,000 deposit rewards and bonuses up for grabs!
Chart #3 - Chainlink (LINKUSD) Daily
Chartist: Kyle
(For the chart screenshot, click here.)
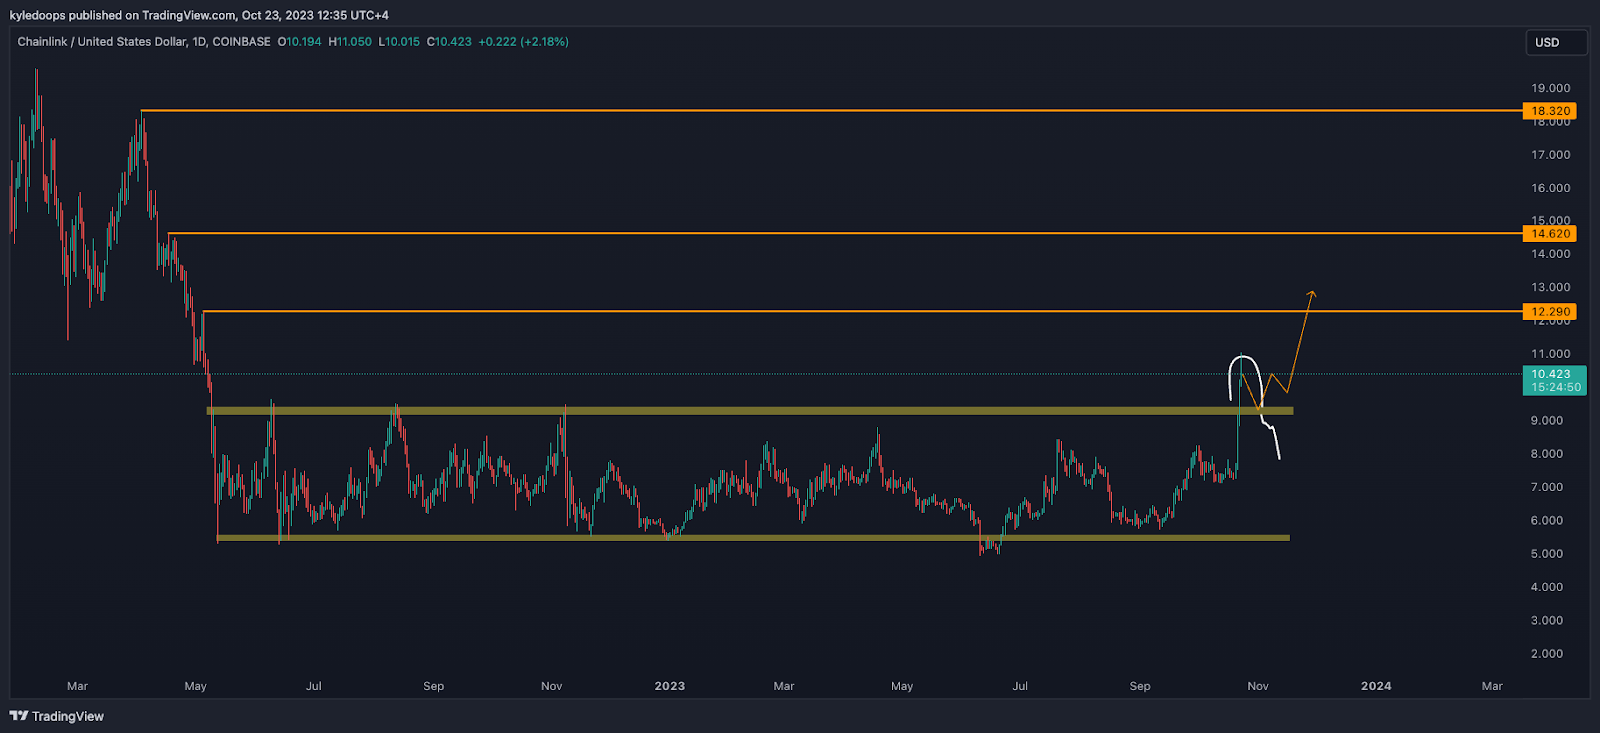
LINK has broken out from a long-held range!
Months ago, we highlighted that the price is in a PO3, which essentially means: accumulation (sideways price action), manipulation (dips below the range low), and expansion (progressive upward movement).
Traders should be vigilant for the price deviating back into the range or retesting as support.
The probe into the $9.30 level will be crucial to maintain. If it sustains, anticipate a continuation upward towards $12.30 as Target 1, $14.62 as Target 2, and $18.32 as the Ultimate Target to conclude the expansion phase.
Claim your Bitget sign-up bonuses here (details below).
Chart #4 - S&P 500 Futures (ES1!) Daily
Chartist: Kyle
(For the chart screenshot, click here.)
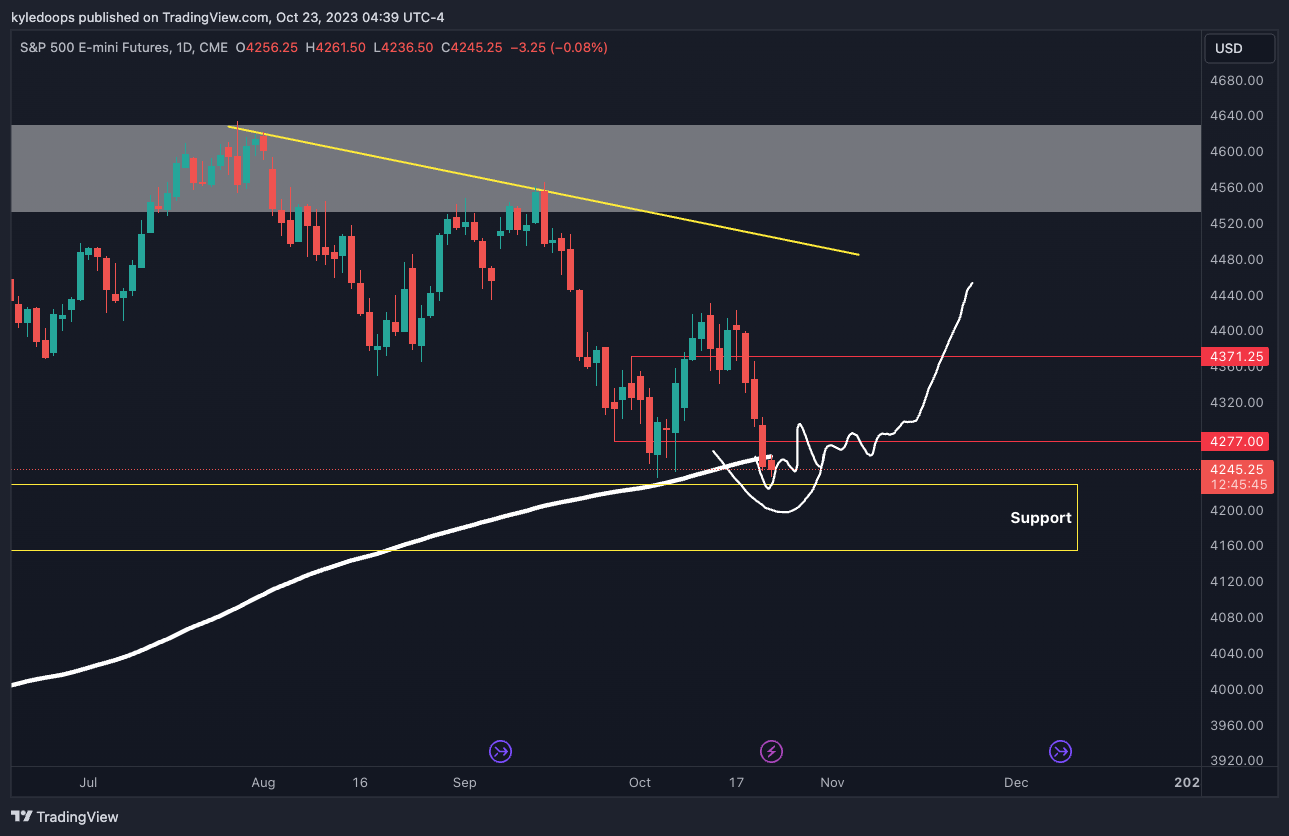
The S&P 500 continues its downward trend on the daily, marked by lower highs and lower lows, yet remains above the yellow box support zone.
This yellow box support level stands as the last bastion for bulls. Given that the price has already fallen below the 200-day moving average, this tilts the risk back to the downside.
With one daily candle closing below that level, if we witness two more, then the likelihood that this robust support could give way increases.
This presents the primary risk for crypto at the moment.
Claim your Bitget sign-up bonuses here (details below).
Chart #5 - Ethereum Dominance (ETH.D) Weekly
Chartist: Sheldon
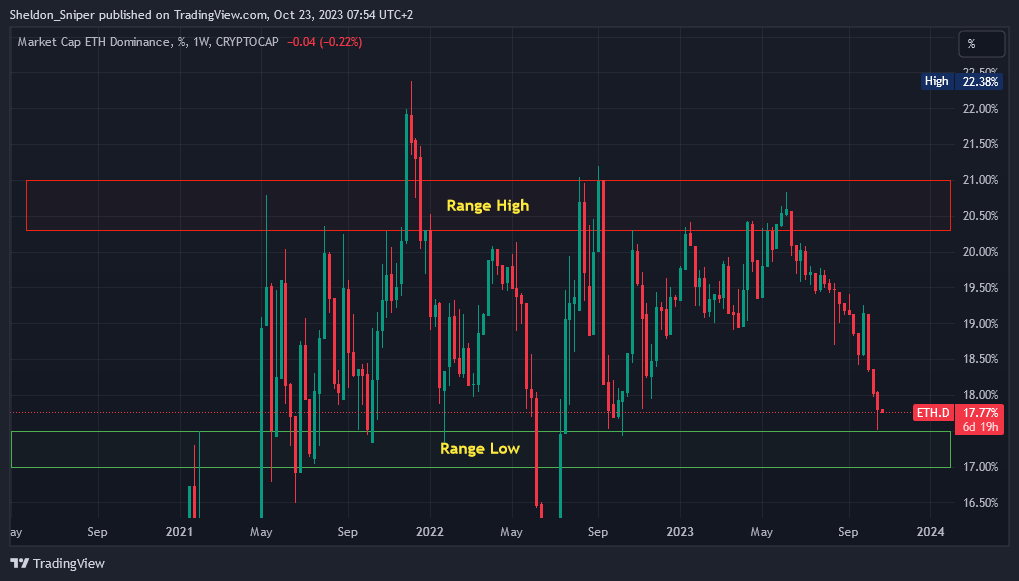
(For the chart screenshot, click here.)
After being in a downtrend for the last five months, ETH Dominance has once again reached the weekly range low support at 17% - 17.50%.
I expect this area to hold, with a possible reversal back to the upside. This could result in ETH gaining strength in the total market. A move up will not only be bullish for ETH, but also for the entire altcoin market, which has been in a slow bleed over the last couple of months.
To the upside, the first area of resistance is at 18.5% - 19%.
Claim your Bitget sign-up bonuses here (details below).
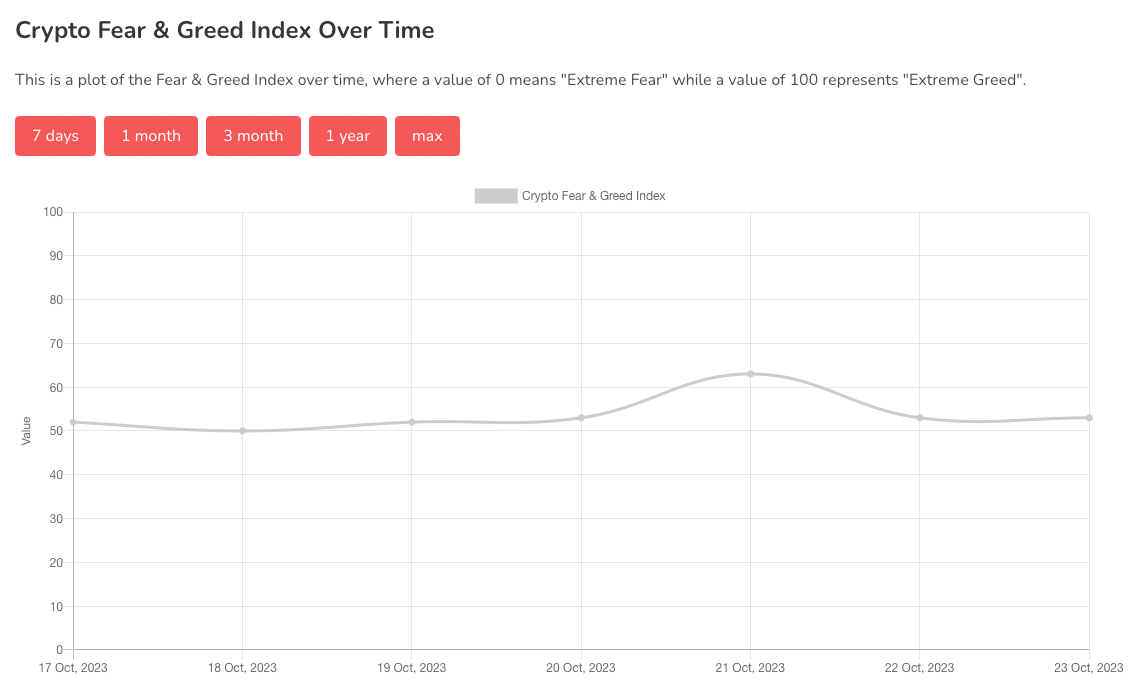
Chart #6 - Fear and Greed Index
The Fear and Greed Index is sitting at 53 today, Neutral.
The highest the index has been over the past seven days is 63, and the lowest is 50.
Banter’s Take
Bitcoin and the stock market are currently uncorrelated, with Bitcoin rising and the stock market declining. A mean reversion is anticipated, suggesting a Bitcoin pullback and a stock market rebound.
Stay safe my friends!
Go to our Crypto Banter Discord here where Sheldon and Kyle give updates on the charts and trades from The Daily Candle newsletter!