

📈📉 Market revives and BTC breaches $28k! Is LINK about to bounce?
📈📉 Market revives and BTC breaches $28k! Is LINK about to bounce?

Bitget winner - 1006821795
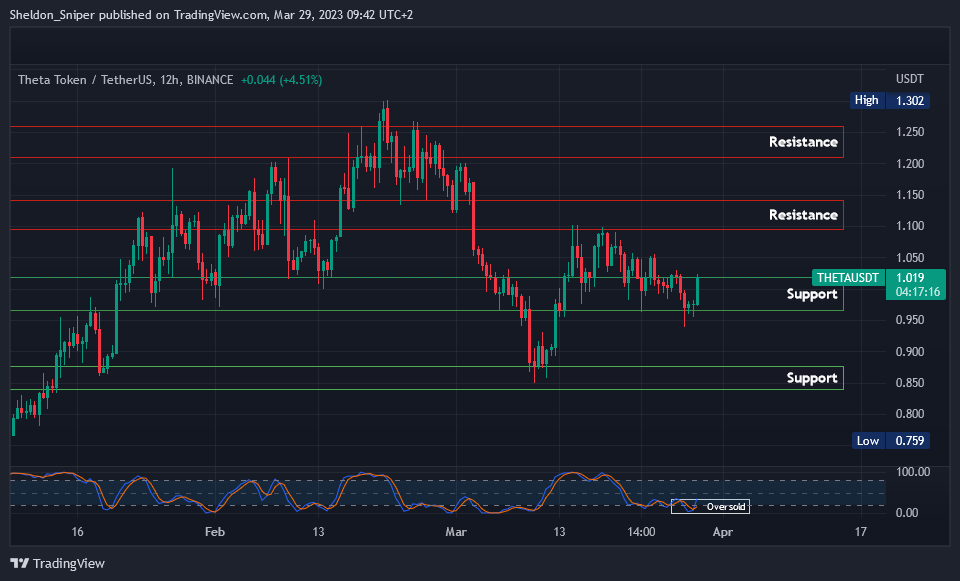
Chart #1 - Theta Network (THETAUSDT) 12-Hour Chart
Chartist: Sheldon
(For the chart screenshot, click here.)
THETA is currently at $1 and in a buy zone.
The stochastic RSI on the higher time frames is oversold, so THETA's next move may be to head up to the $1.10 and $1.20 resistance levels.
But we must manage risk, as a drop from here would take it to $.85.
𝗣𝗿𝗶𝗺𝗲 𝗫𝗕𝗧
Sign up for a new Trading Account on Prime XBT!
Receive a deposit bonus of up to $7,000 with promo code: SheldonSniper
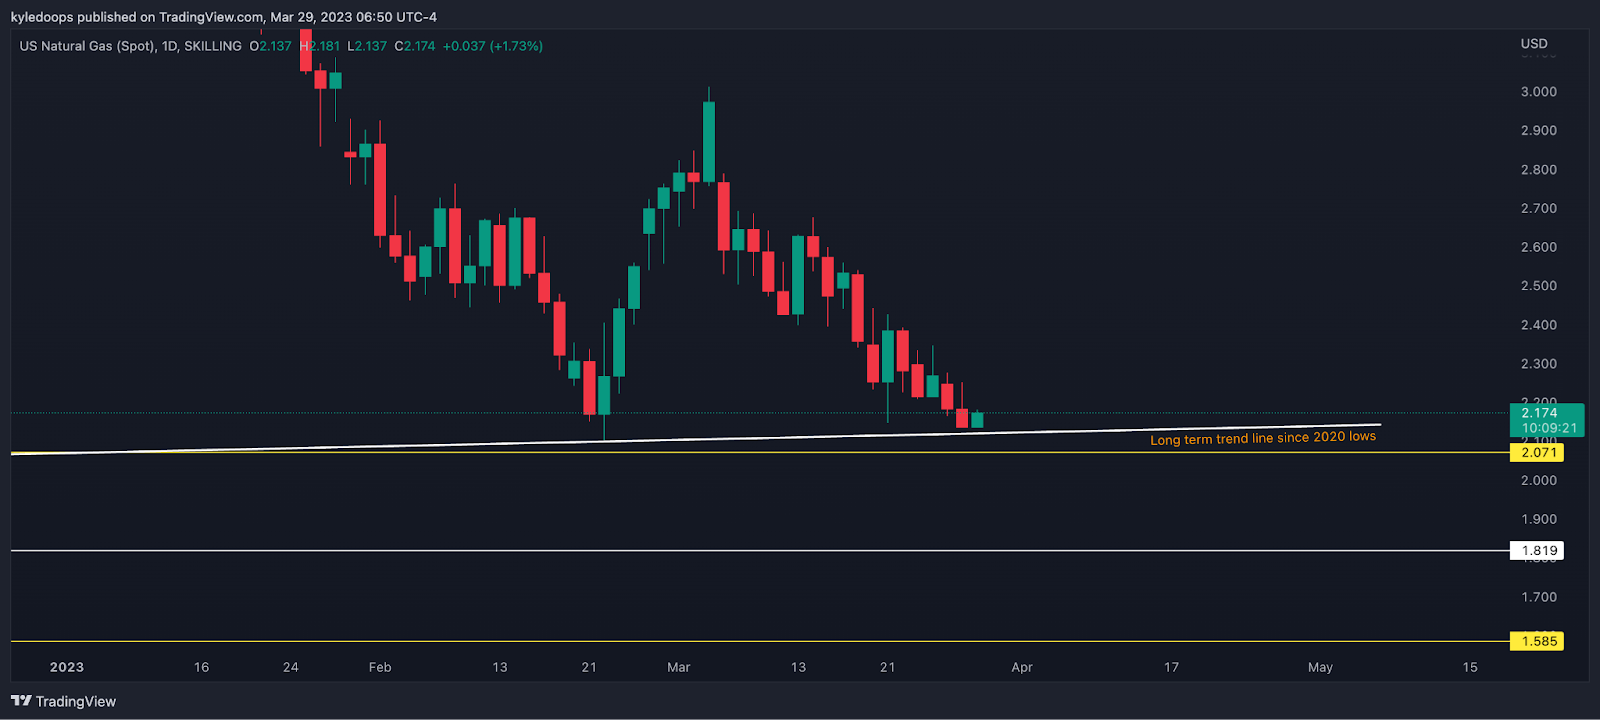
Chart #2 - US Natural Gas 1-Day Chart
Chartist: Kyle
(For the chart screenshot, click here.)
Natural gas has been in an incredibly strong downtrend for quite some time, but it is finally approaching critical levels. So, I have outlined a couple of areas of interest where a long position could be taken.
Natural gas is available to trade on PrimeXBT, just use the link below.
I would wait for at least one green daily close to confirm the bounce is indeed taking place. I'll update you on the progress of this trade tomorrow. Don't miss out.
𝗣𝗿𝗶𝗺𝗲 𝗫𝗕𝗧
Sign up for a new Trading Account on Prime XBT!
Receive a deposit bonus of up to $7,000 with promo code: KyleDoops

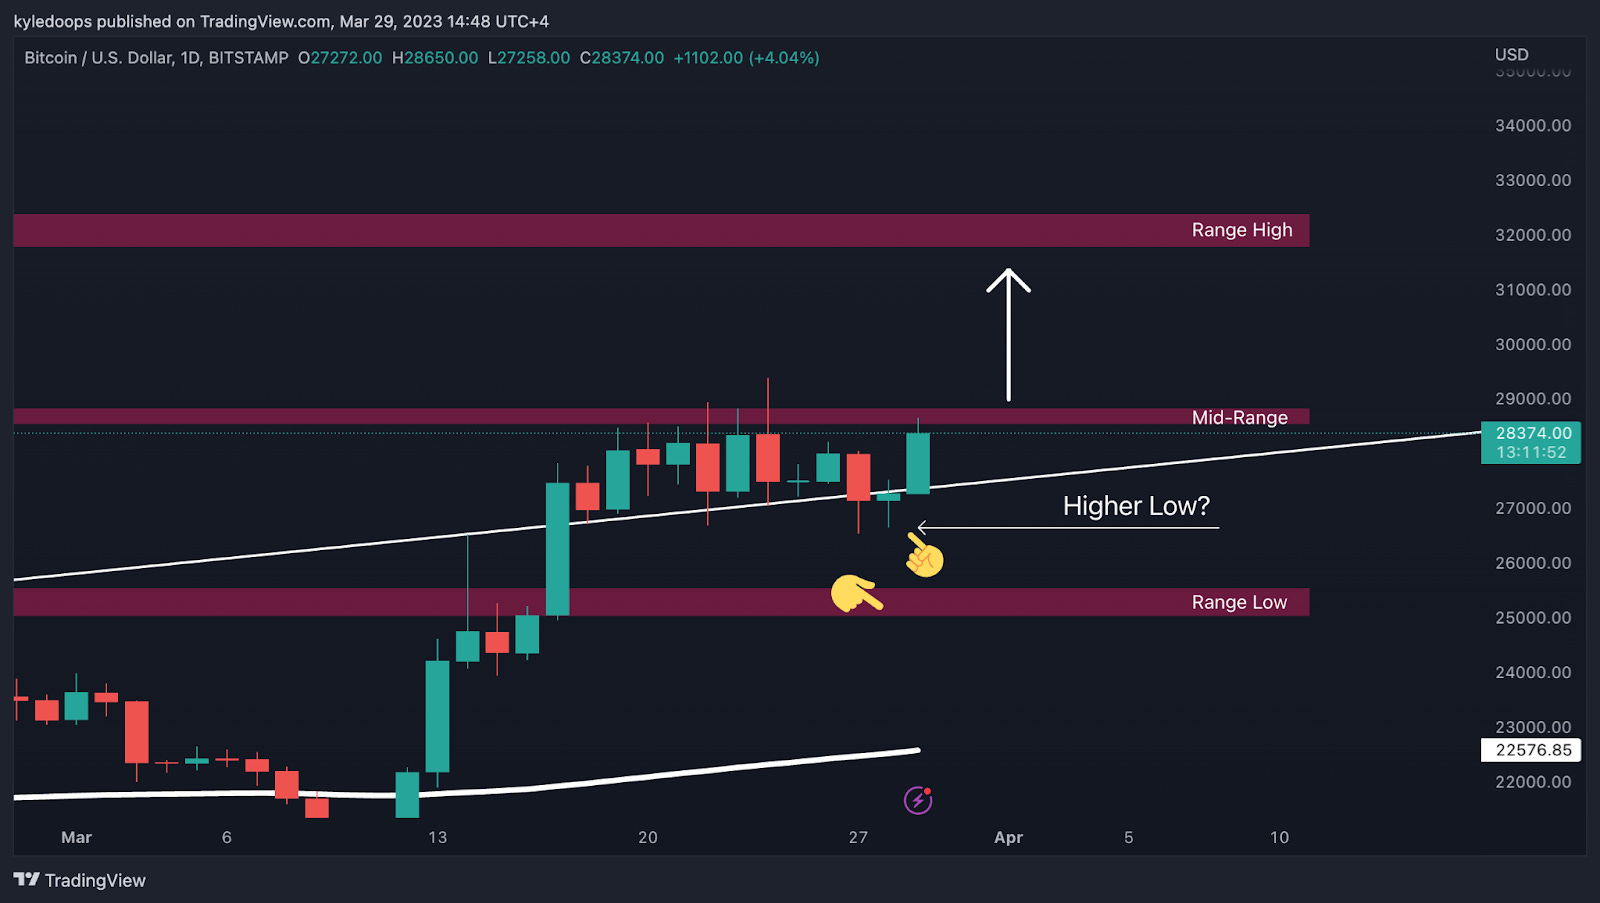
Chart #3 - Bitcoin (BTCUSD) 1-Day Chart
Chartist: Kyle
(For the chart screenshot, click here.)
As I mentioned recently in The Daily Candle, I have been expecting bitcoin to establish a new range between $25,000 and $32,000. So I had been waiting for BTC to tag the old range high, at $25,000, and flip it from resistance into support. That would then become the new range low.
But, yesterday's candle close started to indicate that it might not make it that low.
If today's daily candle closes strong, it will form a higher low, and the price can work on reclaiming the mid-range and ultimately making its way up towards the $32,000 range high.
That would likely happen quickly and in the form of a short squeeze.
Claim your Bitget sign-up bonuses here (details below).
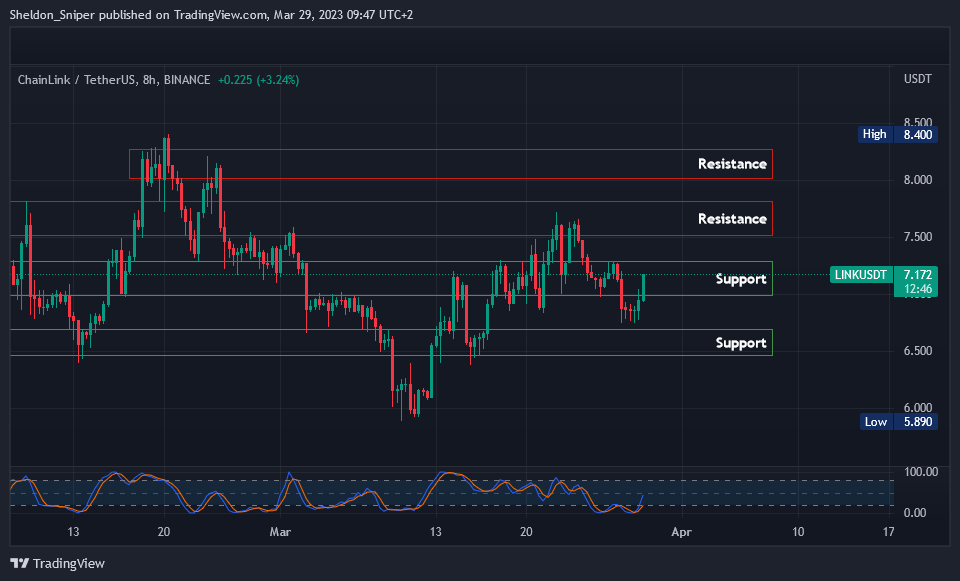
Chart #4 - Chainlink (LINKUSDT) 8-Hour Chart
Chartist: Sheldon
(For the chart screenshot, click here.)
LINK found support at $6.75 and is now trading at $7.17.
The area between $7 and $7.20 is a support zone for LINK, and since that's where it currently sits, LINK could bounce up to either $7.50 or $8.00 (resistance) - it tested that region in February.
If LINK decides to drop out of this support zone, it will go to $6.50 - $6.60.
Claim your Bitget sign-up bonuses here (details below).
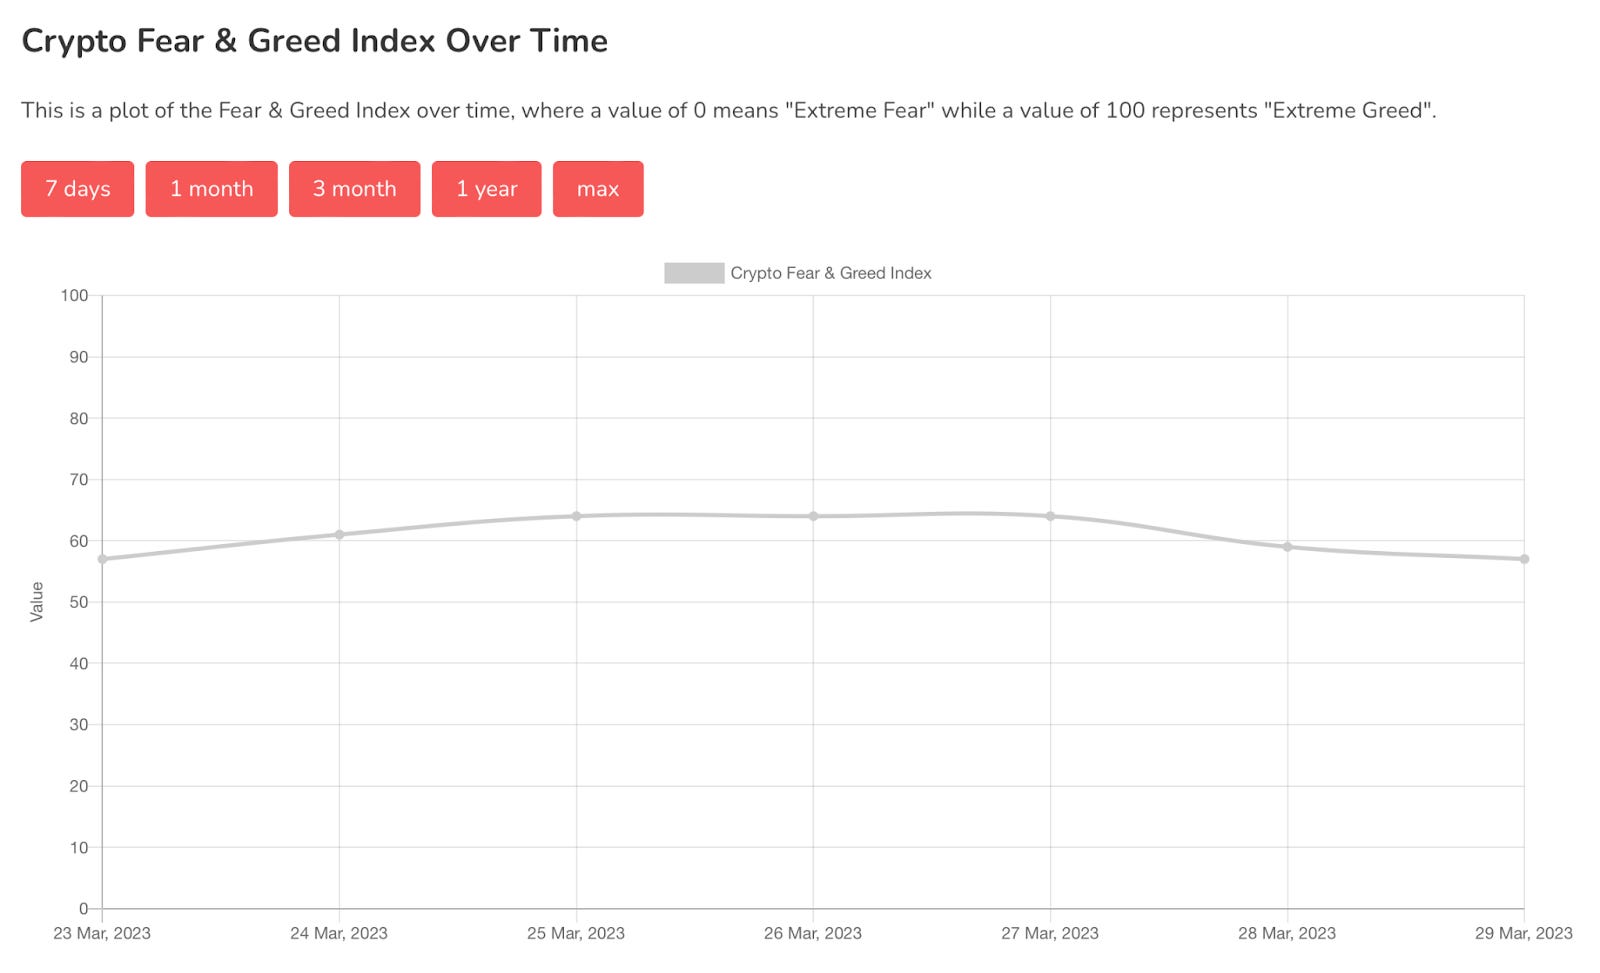
Chart #5 - Bitcoin Fear and Greed Index
The Bitcoin Fear and Greed Index is sitting at 57 today, indicating Greed.
The highest the index has been over the past seven days is 64, and the lowest is 57.
Sniper School
Sniper School kicks off a new cohort on April 3rd! What is Sniper School? Free 3-week trading course with Sheldon. You will learn how to trade like a pro in 3 short weeks and capitalize on the change in the markets.
There are only 3k seats and the waitlist is filling up fast! We still have some spots left for those that complete the entrance requirements of signing up for a fee exchange account and funding it. You’ll use it to trade live during the course.
The course includes weekly live workshops hosted by Sheldon, Mama Sniper, and special guests, plus daily live trading and market analysis sessions with our team of Sniper Mentors!
It’s not just a school. It really is the start of an incredible journey with our family of degens! Reserve your spot now by clicking here.
Banter’s Take
The market has shown some small signs of life and a bounce is in play. Basically, bitcoin above $27,700 is bullish, and below $27,500 is bearish.
It's really as simple as that.
Trade well and stay safe my friends!
Go to our Crypto Banter Discord here where Sheldon and Kyle give updates on the charts and trades from The Daily Candle newsletter!
Bybit winner - 56871830