

📈📉 Massive bitcoin pump overnight! Are the alts next?
📈📉 Massive bitcoin pump overnight! Are the alts next?

Bitget winner - 6321501279
Wondering what that 👆 is and how you can win? Then check out our daily shows on YouTube!
Are you using Bybit instead? Then look for the winning Bybit account below. But if you want to double your chances of winning, sign up today to both exchanges with the links found in the description of our YouTube videos!
Good luck to all!
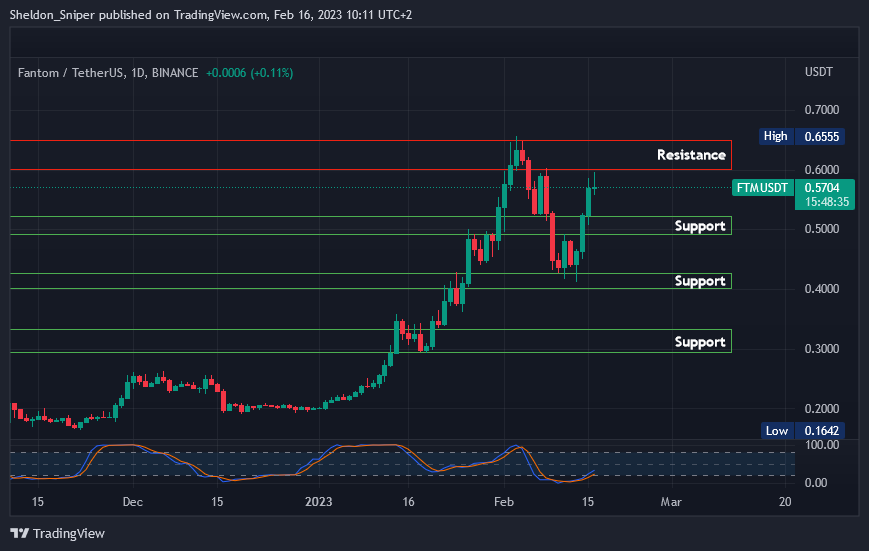
Chart #1 - Fantom (FTMUSDT) 1-Day Chart
Chartist: Sheldon
(For the chart screenshot, click here.)
FTM has rallied by a massive 45% this week from $0.41 on Monday and reaching the $0.60 - $0.65 area of resistance this morning - the same area where it was at the beginning of February.
If FTM breaks through this significant resistance zone, the next ones are at $0.70 and $0.80. If the price gets rejected here, creating a double-top, the next support levels are at $0.48 - $0.53 and below that at $0.40 - $0.42.
FTM was one of the best-performing Layer-1 coins in the previous bull cycle, so if the market continues rallying for the next few weeks, I think it will reach at least the $1 level.
Check our Crypto Banter Discord here for updates!
Follow me on Twitter for urgent updates on my trading progress!
Claim your Bitget sign-up bonuses here (details below).
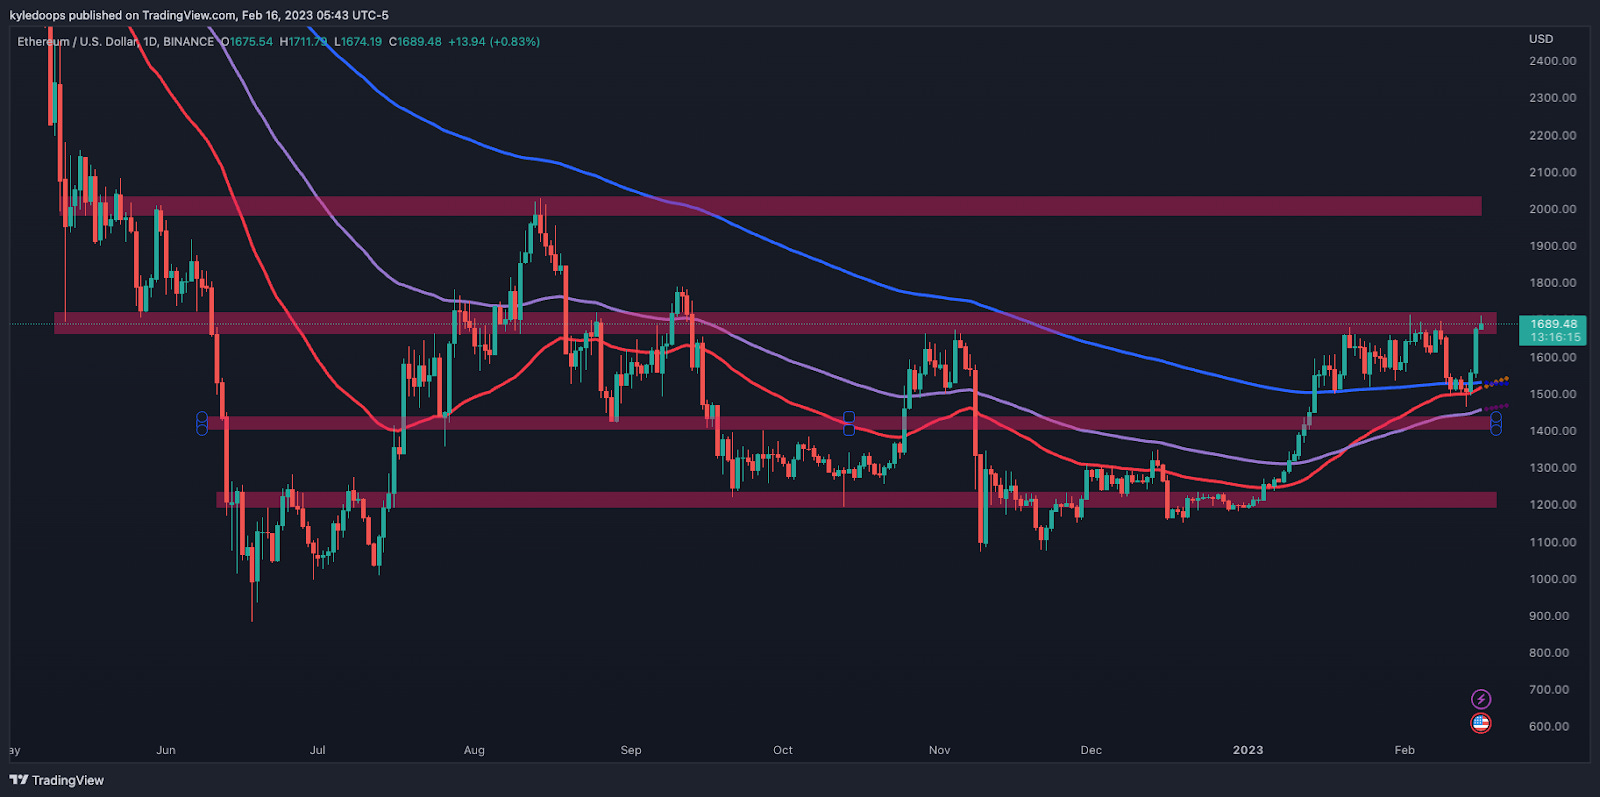
Chart #2 - Ethereum (ETHUSD) 1-Day Chart
Chartist: Kyle
(For the chart screenshot, click here.)
ETH has just pushed up into its range high at around $1,700.
If it can close two more days at this level and consolidate a bit longer, the chances are high that the $2,000 level will be the next one to get tagged.
I would use the $1,466 low as the invalidation level on any longs, so pullbacks above that could be for buying.
Check our Crypto Banter Discord here for updates!
Make sure to follow me on Twitter, where I will post updates on my trades as they unfold!
Claim your Bitget sign-up bonuses here (details below).
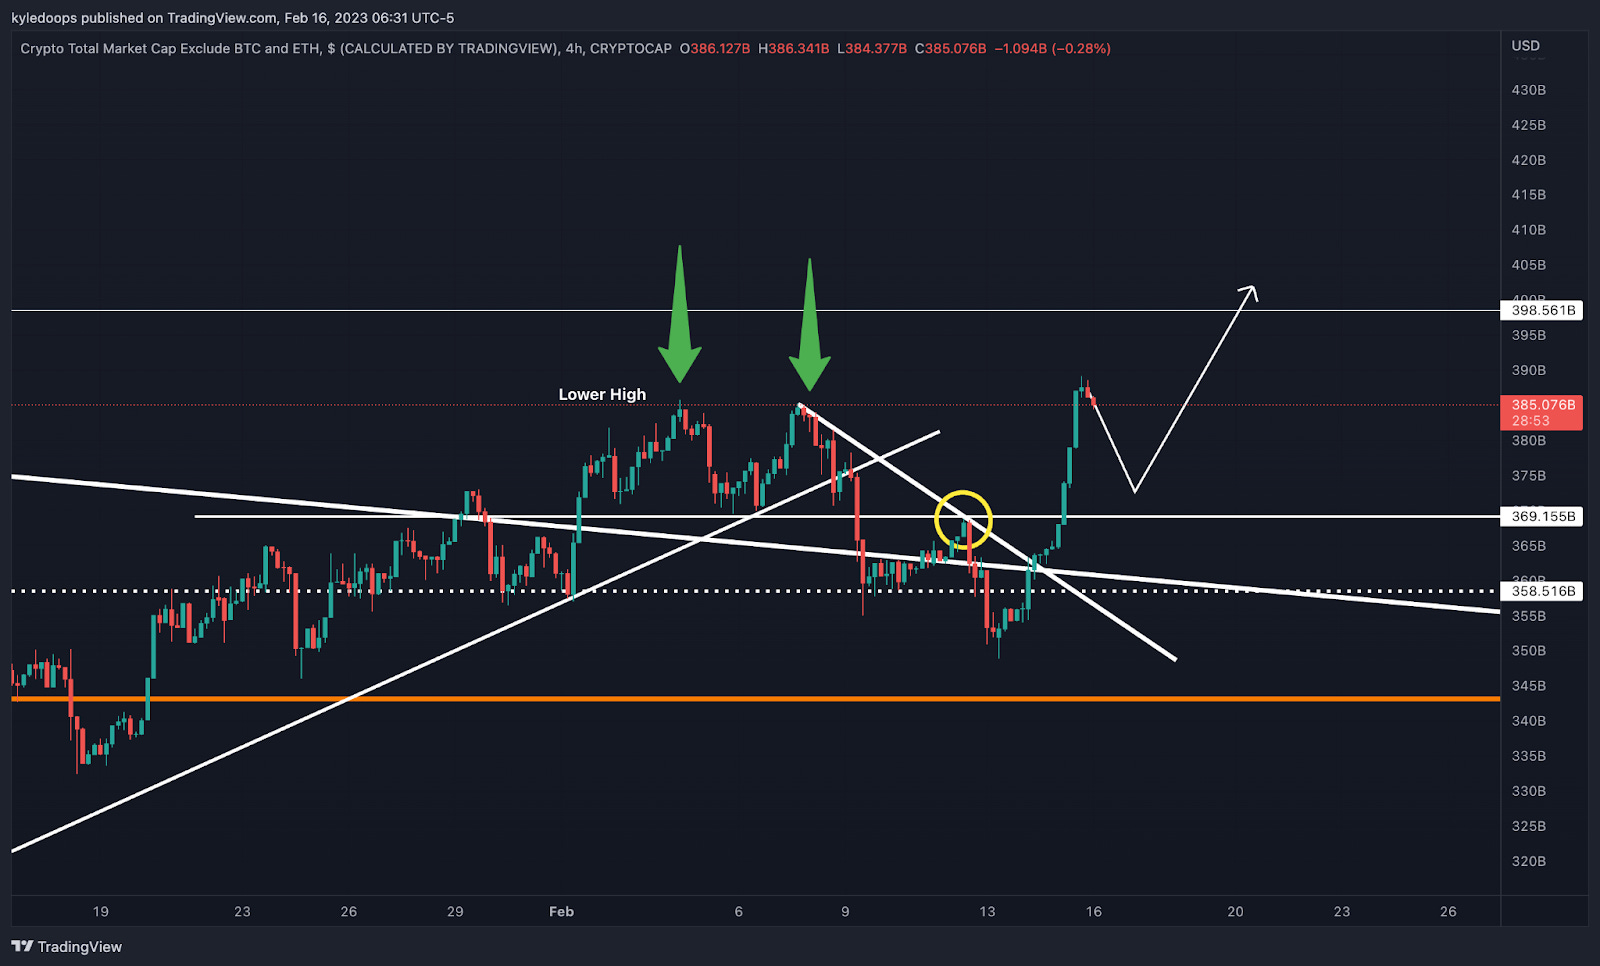
Chart #3 - TOTAL3 4-Hour Chart
Chartist: Kyle
(For the chart screenshot, click here.)
The TOTAL3 has officially made a higher high and, consequently, any higher low hereafter could be a great opportunity to pick up altcoins on the cheap.
Those who missed the bitcoin pump will be looking to altcoins for the next move.
Check our Crypto Banter Discord here for updates!
Make sure to follow me on Twitter, where I will post updates on my trades as they unfold!
Claim your Bitget sign-up bonuses here (details below).
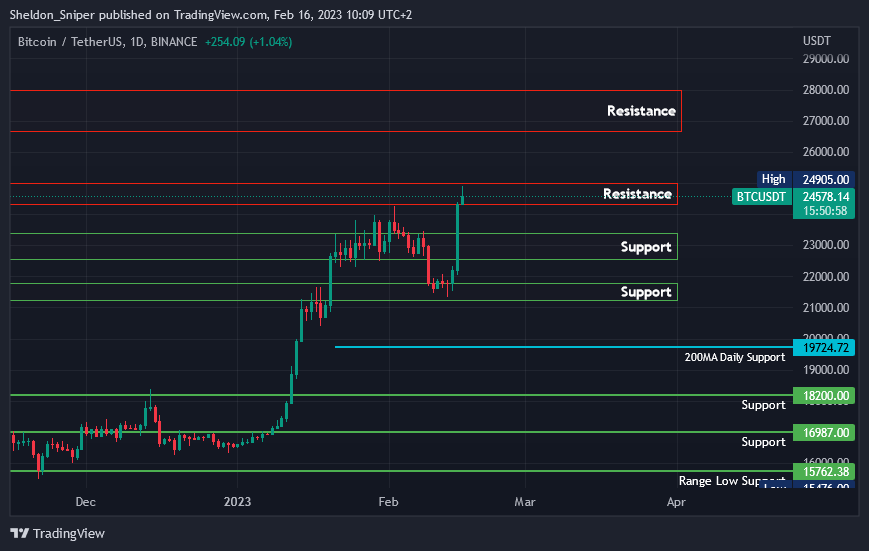
Chart #4 - Bitcoin (BTCUSDT) 1-Day Chart
Chartist: Sheldon
(For the chart screenshot, click here.)
In a day, bitcoin has rallied by over 13%, from just over $22,000 yesterday morning to this morning’s local high of $24,900, breaking the February 2nd high of $24,264 and creating a current high for 2023 in the process.
BTC is trading in the $24,700 - $25,300 area of resistance, where the price might consolidate for a while before possibly testing the next overhead resistance at $26,800 - $28,000. Note, $28,000 - $30,000 will be tough resistance to get through, as it held as strong support in the middle of 2021 and during the LUNA collapse.
If BTC retraces from here, there is a minor support level at $23,900, with the following major one at around $23,000.
Check our Crypto Banter Discord here for updates!
Follow me on Twitter to get all the updates on my personal trading progress!
Claim your Bitget sign-up bonuses here (details below).
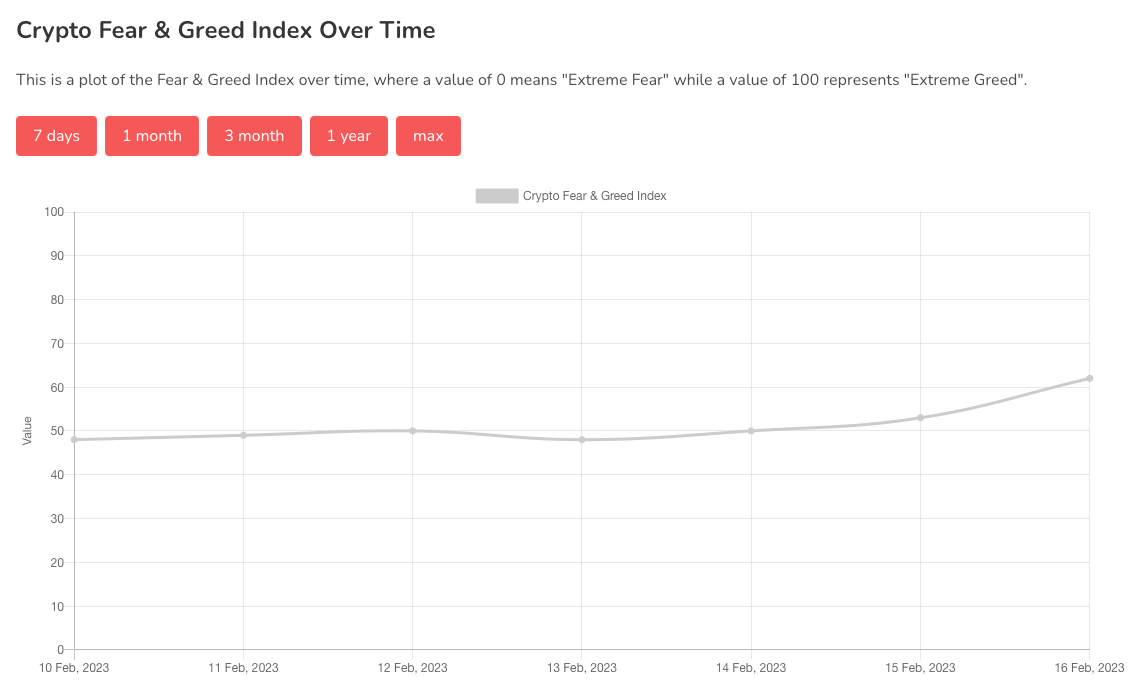
Chart #5 - Bitcoin Fear and Greed Index
The Bitcoin Fear and Greed Index is sitting at 62 today, indicating Greed.
The highest the index has been over the past seven days is 62, and the lowest is 48.
Overall Market Sentiment (Banter’s Take)
Higher lows are for buying, but those words are crucial! Make sure that it's a higher low, as if we take out the prior lows, a massive bull trap could unfold.
Ultimately, bitcoin is at resistance around its 200 MA on the weekly chart.
Stay safe my friends!
Bybit winner - 2760694