

📈📉 Massive Pump Confirms Higher Low! Where to Next?
📈📉 Massive Pump Confirms Higher Low! Where to Next?

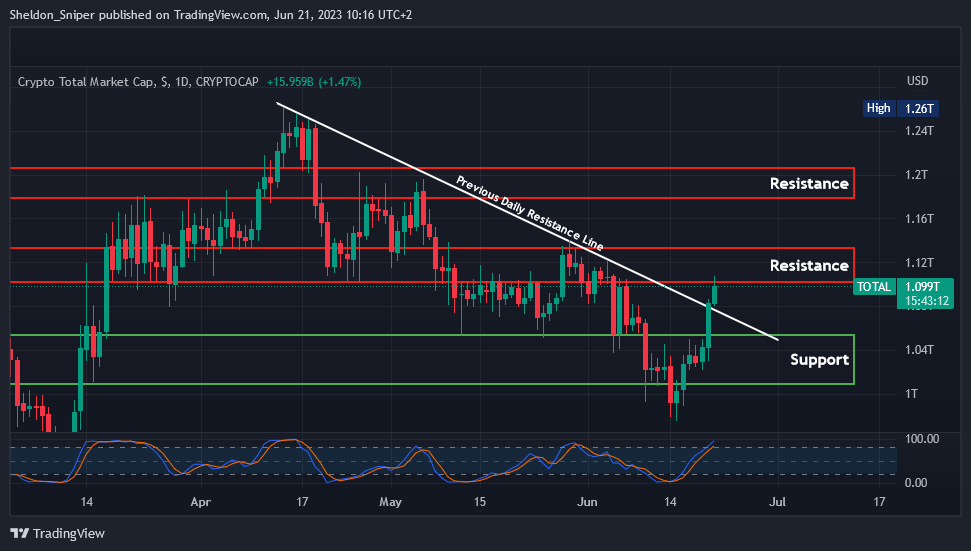
Chart #1 - TOTAL 1-Day Chart
Chartist: Sheldon
(For the chart screenshot, click here.)
Over the last two days, we have seen a significant shift in the TOTAL. The market cap has increased from $1.02T to $1.10T and has simultaneously broken through the daily descending resistance line that dates back to mid-April.
This morning, the total market cap hit the first major resistance level in the $1.10T - $1.13T range.
In the event of a pullback, there could be a test of the previous daily resistance line, which will now serve as support, around the $1.075T mark. But if the TOTAL can surpass the $1.10T - $1.13T resistance area, then the next resistance zone lies in the $1.175T - $1.2T range.
Sign-up and trade on Bybit today.
Exclusive $30,000 deposit rewards and bonuses up for grabs!
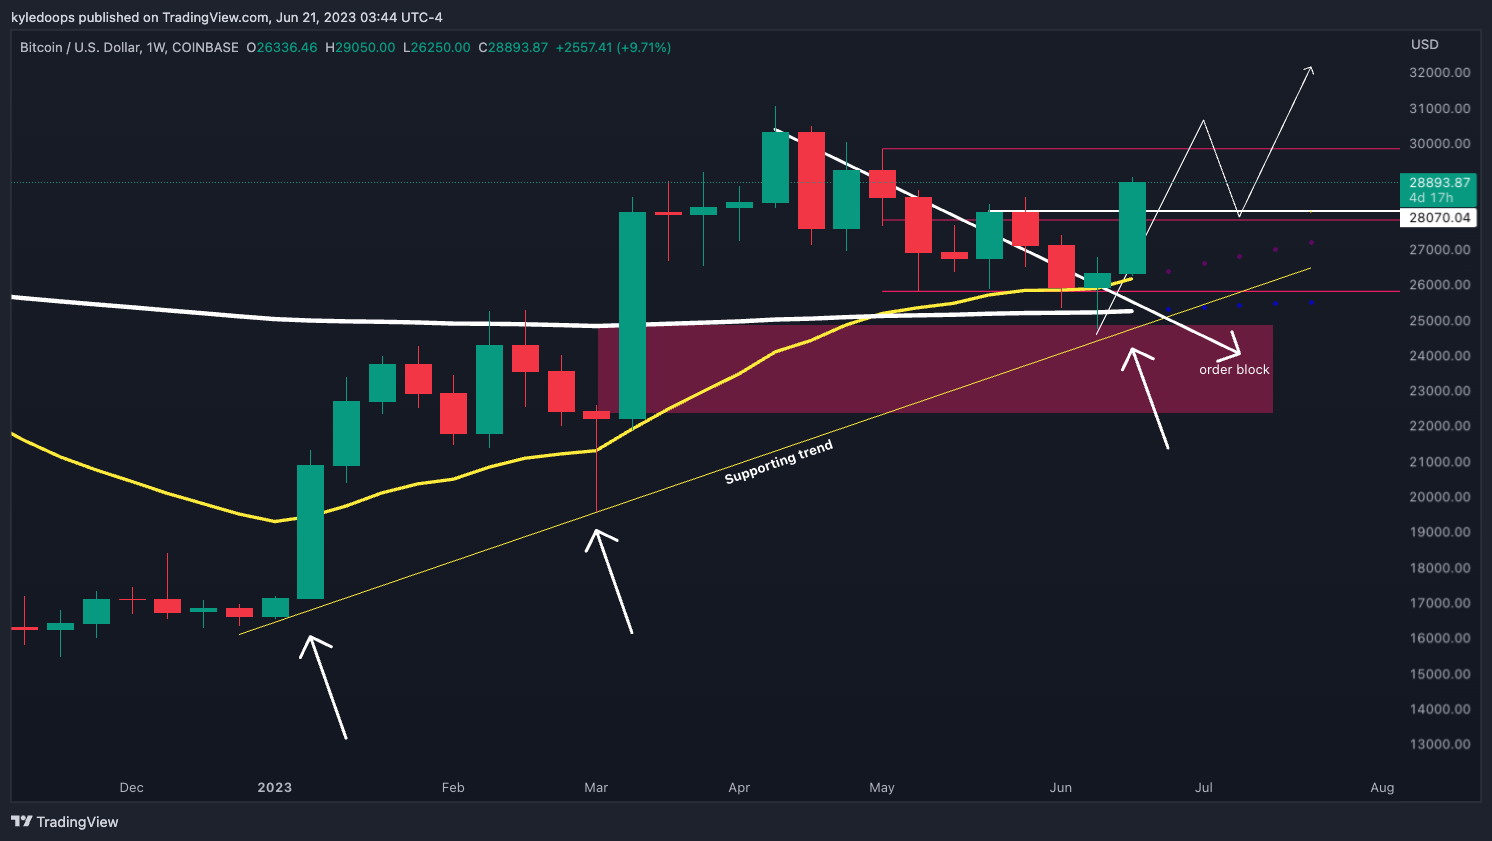
Chart #2 - Bitcoin (BTCUSD) 1-Week Chart
Chartist: Kyle
(For the chart screenshot, click here.)
This massive pump has now confirmed a higher low since the price has broken above the $28,070 level.
The expectation is that the price has swept the lows of May at $25,827, and it will likely sweep above the May highs at $28,474.
So, any pullbacks should be considered as buying opportunities, as the previous market structure has now been broken.
𝗣𝗿𝗶𝗺𝗲 𝗫𝗕𝗧
Sign up for a new Trading Account on Prime XBT!
Receive a deposit bonus of up to $7,000 with promo code: KyleDoops

Sign up for a new Trading Account on Prime XBT!
Receive a deposit bonus of up to $7,000 with promo code: SheldonSniper
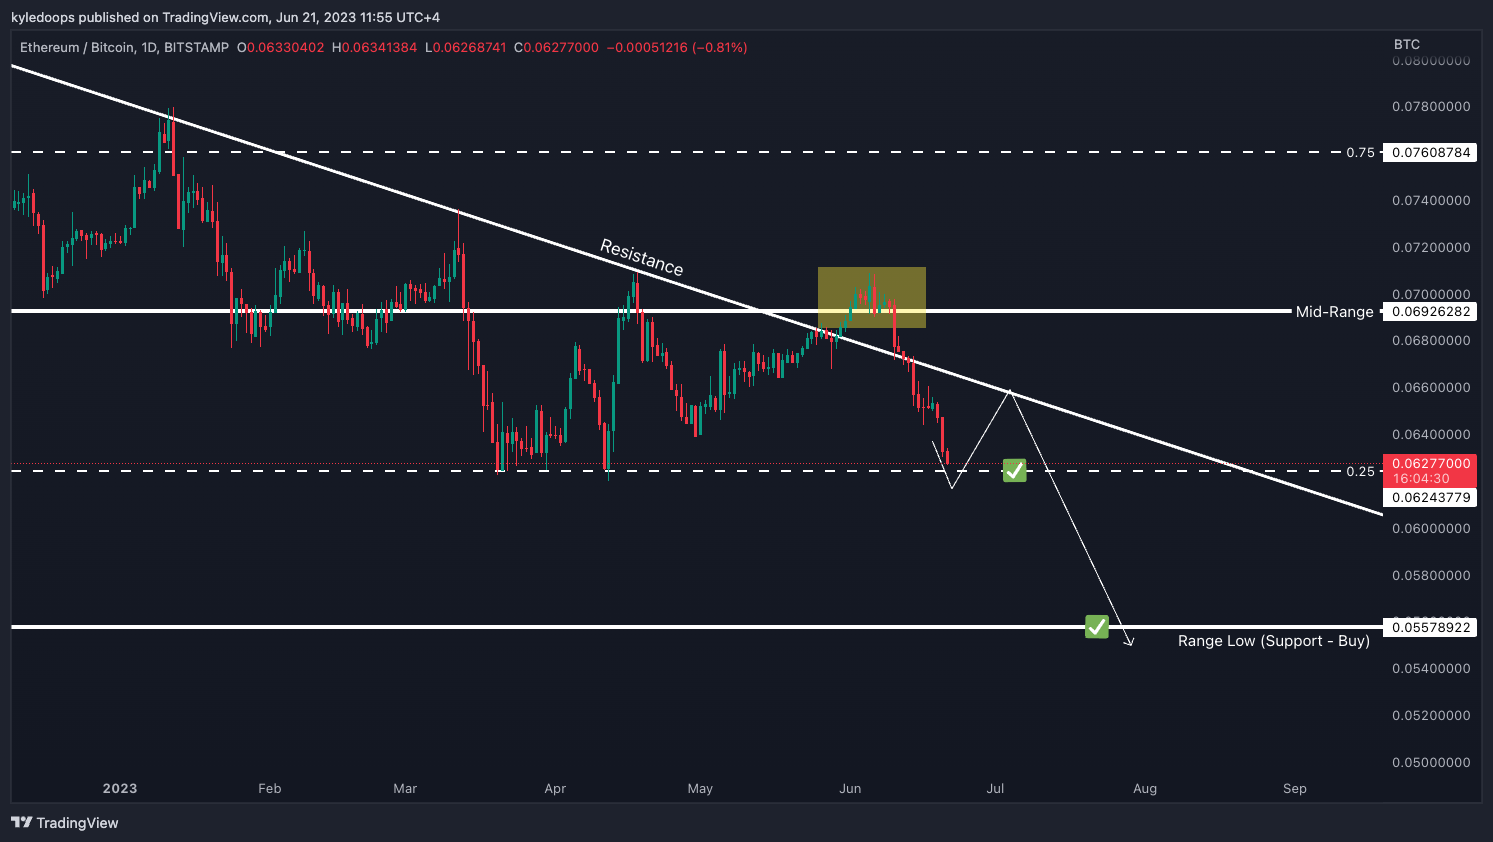
Chart #3 - Ethereum to Bitcoin Ratio (ETHBTC) 1-Day Chart
Chartist: Kyle
(For the chart screenshot, click here.)
Here is an update on ETH/BTC as it approaches a support level.
ETH/BTC is nearing the quarterly range level (labeled on the chart as 0.25). I anticipate a bounce from this point soon, but it's likely to be short-term, leading to an encounter with the long-term diagonal resistance trend line.
Once the long-term diagonal is hit, it's likely that the trend will reverse downwards from there, pushing towards the range low in the 0.05578922 zone.
And that will be the best location to start transitioning into altcoins.
Claim your Bitget sign-up bonuses here (details below).
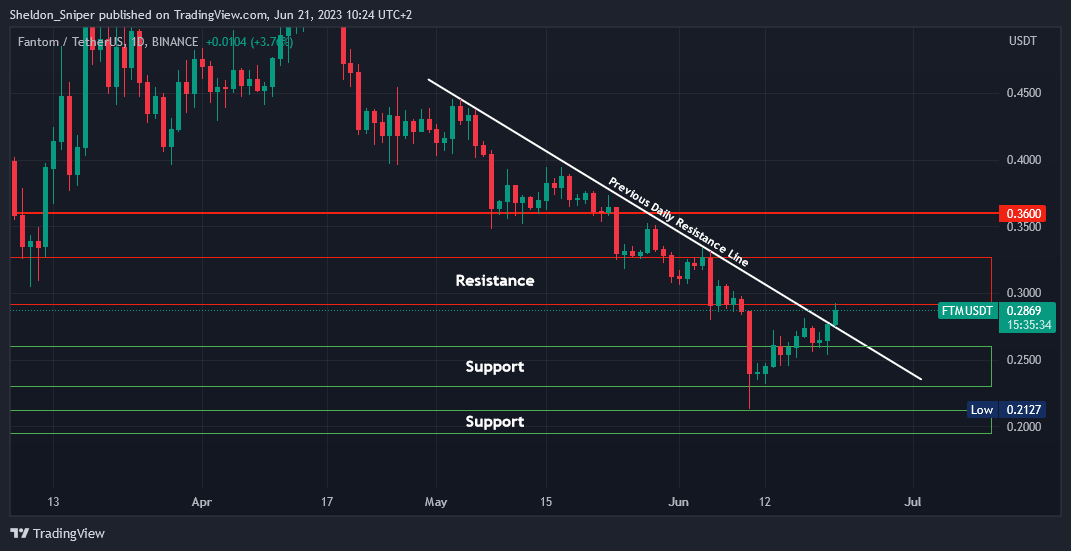
Chart #4 - Fantom (FTMUSDT) 1-Day Chart
Chartist: Sheldon
(For the chart screenshot, click here.)
Yesterday, FTM managed to break through the daily descending resistance line that started forming in early May, and the price has now reached the first area of resistance at $0.29 - $0.33.
If there is a rejection at this resistance level, there could be a pullback to retest the previous daily resistance line, which will now serve as support, around $0.27.
The next major support area lies at approximately $0.24 - $0.26. But, if FTM can breach the $0.29 - $0.33 resistance area, the next one stands at $0.36.
Alts, including FTM, have suffered over the past few weeks. However, I believe there could be significant gains for some of them over the coming weeks.
Claim your Bitget sign-up bonuses here (details below).
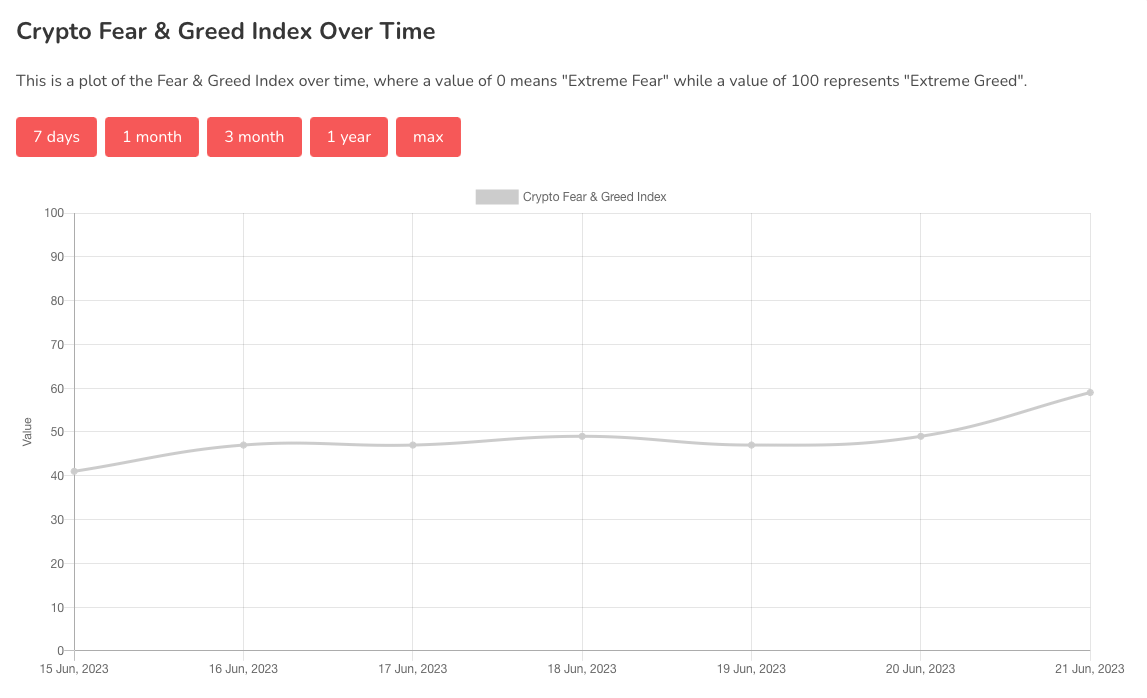
Chart #5 - Bitcoin Fear and Greed Index
The Bitcoin Fear and Greed Index is sitting at 59 today, indicating Greed.
The highest the index has been over the past seven days is 59, and the lowest is 41.
Banter’s Take
Bulls have intervened, defending the price and confirming a higher low. Any pullbacks observed from now on should be seen as buying opportunities. Altcoins have not yet fully awakened, but if Bitcoin consolidates after reaching a new swing high, money will likely rotate into the alts.
Stay safe my friends!
Go to our Crypto Banter Discord here where Sheldon and Kyle give updates on the charts and trades from The Daily Candle newsletter!