

📈📉 MASSIVE PUMP! Don't Miss THIS 60% DOGE Trade!
📈📉 MASSIVE PUMP! Don't Miss THIS 60% DOGE Trade!
PLUS: $63,000 BTC Next?
Overview
Chart #1 - Dogecoin (DOGEUSDT) 3-Day
Chart #2 - Sei (SEIUSDT) 8-Hour
Chart #3 - Big Time (BIGTIMEUSDT) Daily
Chart #4 - Bitcoin (BTCUSDT) Daily
Chart #5 - Fear and Greed Index
First of all, yesterday’s Scallop (SCLP) trade setup pumped 25% overnight!
Did you catch it?
You know what to do!
Subscribe below!👇
Chart #1 - Dogecoin (DOGEUSDT) 3-Day
Chartist: Sheldon
(For the chart screenshot, click here.)
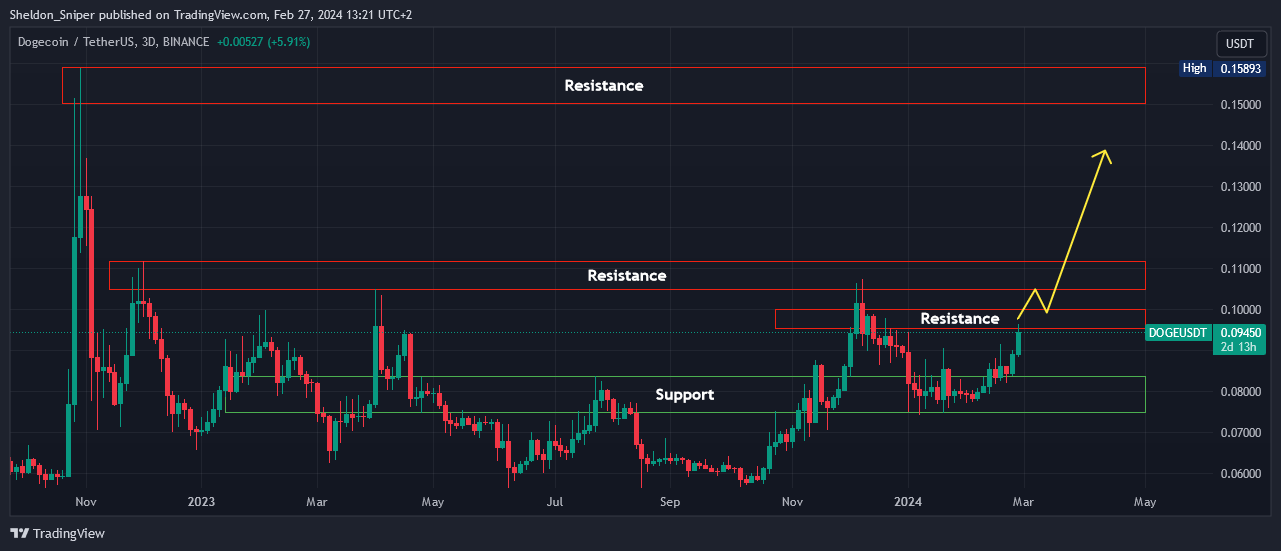
Even though DOGE is currently at resistance, I am watching this chart very closely, for a possible break of the $0.10 level where I will be taking a trade .
There reason I am looking at DOGE is because it has not broken out of the $0.10 area after a massive accumulation, while a lot of the meme coins have already started moving.
Today for example, we have seen a 20% move on PEPE!
Entry: A break and retest of the $0.10 level will be my entry.
Take Profit (TP): Will take some small profits along the way, e.g. around the $0.13 level, but the rest I will leave to ride to the $0.15 - $0.16 area of resistance.
Stop Loss: My Stop Loss will be just below $0.095.
From $0.10 to $0.16 is a 60% trade. It’s available on Bybit. Don’t miss out!
Chart #2 - Sei (SEIUSDT) 8-Hour
Chartist: Kyle
(For the chart screenshot, click here.)
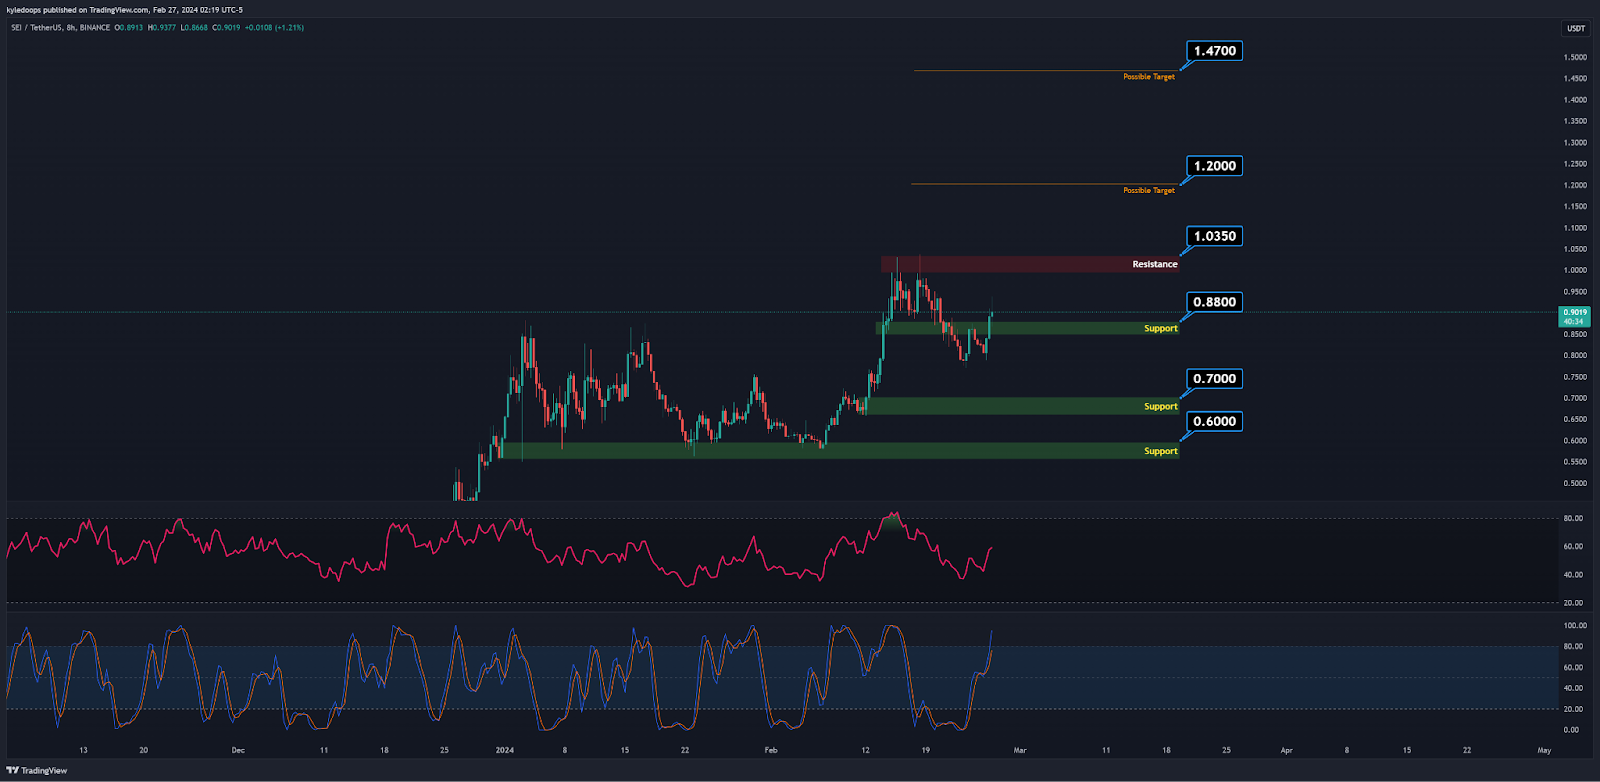
SEI reclaimed the $0.88 level and is holding.
From here we can target the next resistance level at $1.03 on Bitget. If successfully hit, we can then aim for the next ones at $1.20 and $1.47.
In the unlikely event that support fails to hold it could head to $0.70, or even as low as $0.60.

Outsmart 99% Of The Market!
Get full access into our Discord And Telegram group, where you'll find all of our premium content!
👉 Trade Signals!
👉 Trade Set-Ups!
👉 Trading Challenges!
👉 Education!
👉 SO MUCH MORE!
Chart #3 - Big Time (BIGTIMEUSDT) Daily
Chartist: Kyle
(For the chart screenshot, click here.)
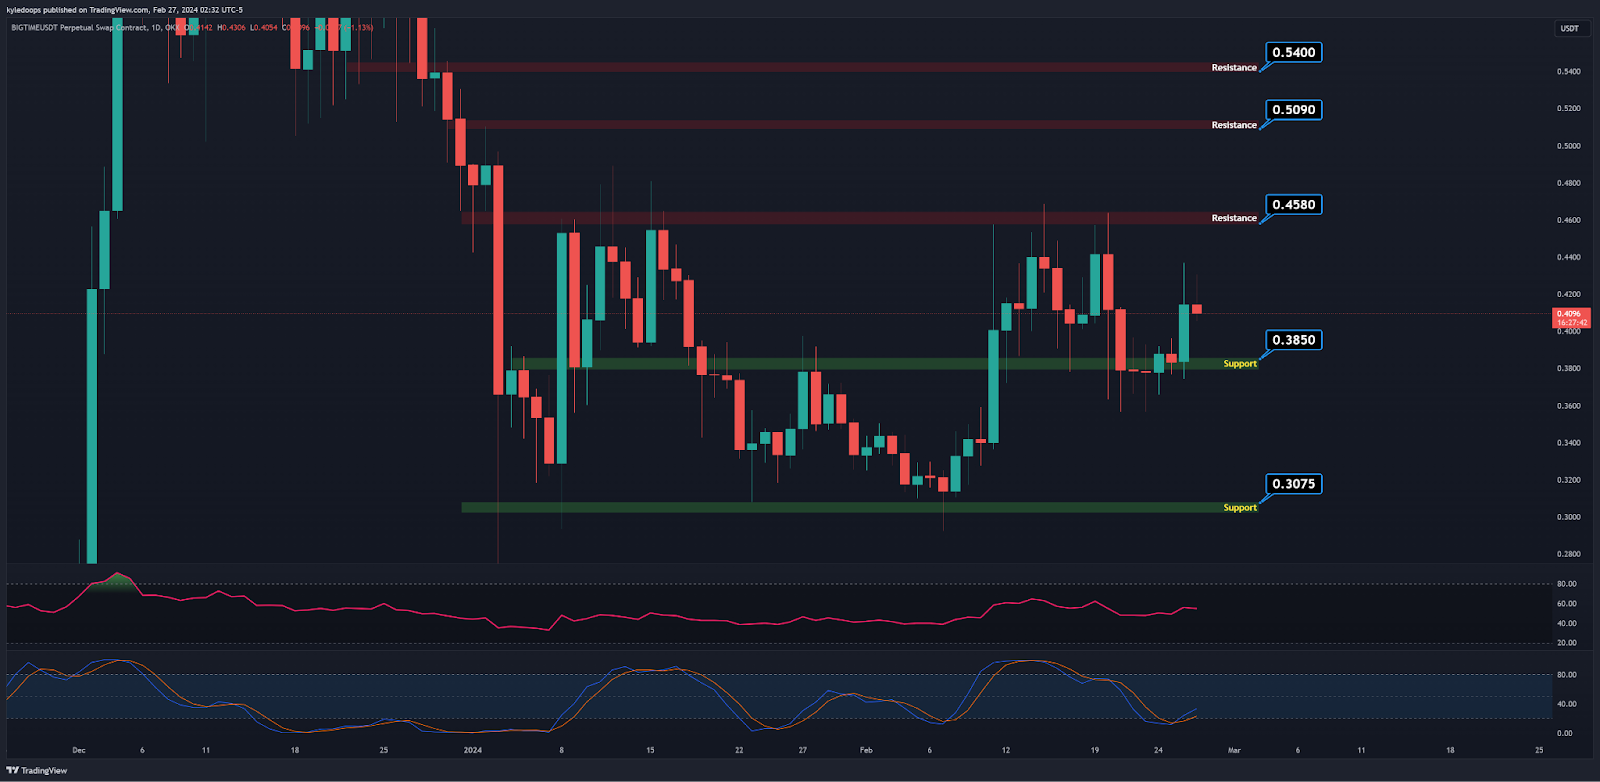
BIGTIME is above support at $0.38.
When Bitcoin Dominance flips, alts will fly, and Big Time could target the following resistance levels:
$0.45
$051
$0.54
However, if it drops to the $0.307 - $0.385 area, we can scale in further.
Claim your Bitget sign-up bonuses here (details below).
Chart #4 - Bitcoin (BTCUSDT) Daily
Chartist: Sheldon
(For the chart screenshot, click here.)
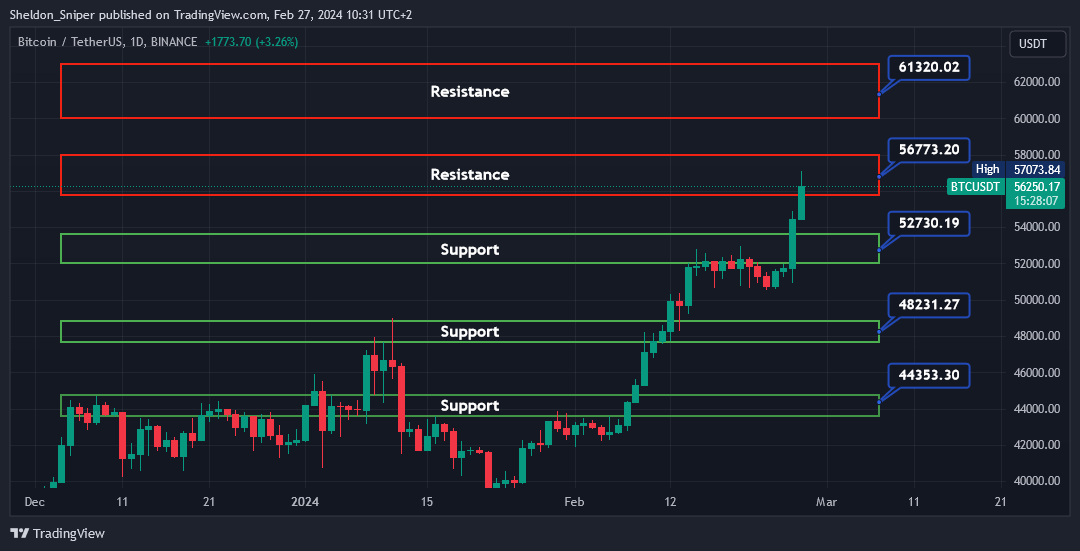
BTC has rallied by almost 12% overnight, breaking through the $52,000 level of resistance. You can get set up on Bitget to take advantage of the massive gains ahead of time. We don’t want to miss out, especially after seeing the major pump we had in the last 24 hours.
BTC is currently overbought, and could remain overbought for a while. However, it is definitely not a buy at these levels. If BTC retraces, the next level of support is at around $53,800.
If you are currently trading, please manage your risk closely.
If BTC resumes its trend to the upside, and breaks through $58,000, the next area of resistance is all the way up at $60,000 - $63,000.
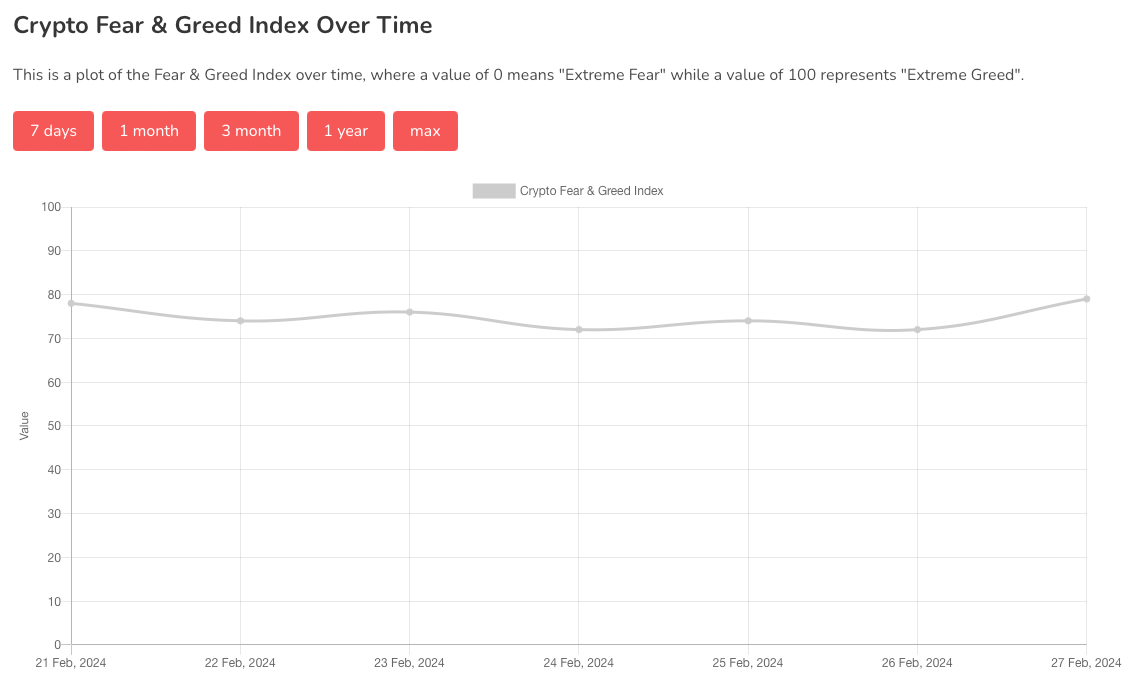
Chart #5 - Fear and Greed Index
The Fear and Greed Index is sitting at 79 today, indicating Extreme Greed.
The highest the index has been over the past seven days is 79, and the lowest is 72.
Banter’s Take
The US market sessions have propelled Bitcoin, breaking the range it had been in for almost two weeks, and it is now above the $56,000 region after an 11% move.
If Bitcoin pauses and consolidates in this area, altcoins will surge to catch up, with the majority of them posting high double-digit percentage gains.
Bitcoin Dominance has encountered resistance again, which will favor the altcoins. It is also worth mentioning that the Total Market Cap (Total 1) has exceeded the $2 trillion mark!
Stay safe my friends!
Go to our Crypto Banter Discord here where Sheldon and Kyle give updates on the charts and trades from The Daily Candle newsletter!