

📈📉 Massive sell-off, where to next? TOTAL3 looking bullish!
📈📉 Massive sell-off, where to next? TOTAL3 looking bullish!

Bitget winner - 2328550104
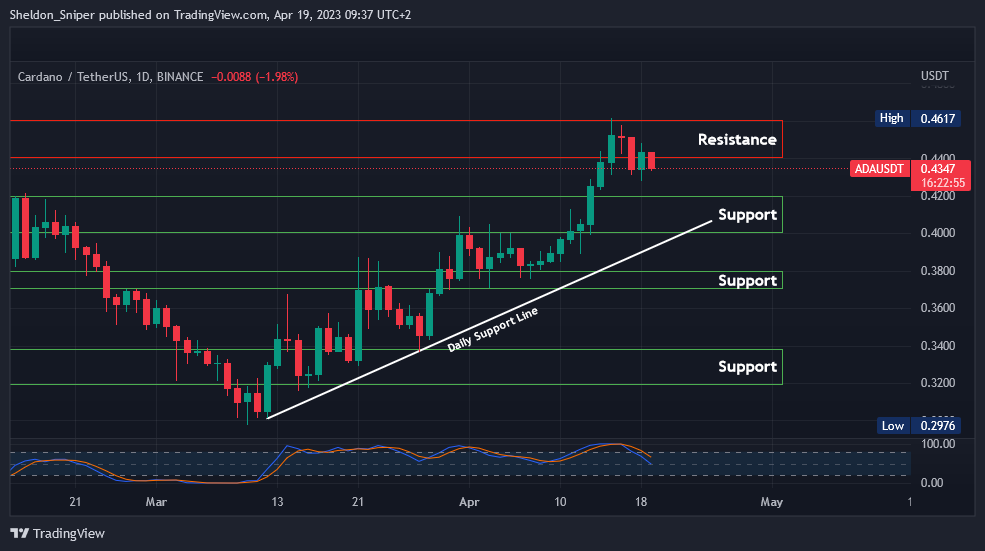
Chart #1 - Cardano (ADAUSDT) 1-Day Chart
Chartist: Sheldon
(For the chart screenshot, click here.)
ADA is at $0.43, and getting ready to test the next support at $0.40 - $0.42.
The ascending trend line on the daily will add to the support's strength at that level. If the price retraces and the support line breaks, the next support is at around $0.38.
The resistance between $0.44 - $0.46 held from May to July last year, so it will be tough to break, but if ADA manages it, the next resistance is at $0.4750 - $0.4950.
𝗣𝗿𝗶𝗺𝗲 𝗫𝗕𝗧
Sign up for a new Trading Account on Prime XBT!
Receive a deposit bonus of up to $7,000 with promo code: SheldonSniper
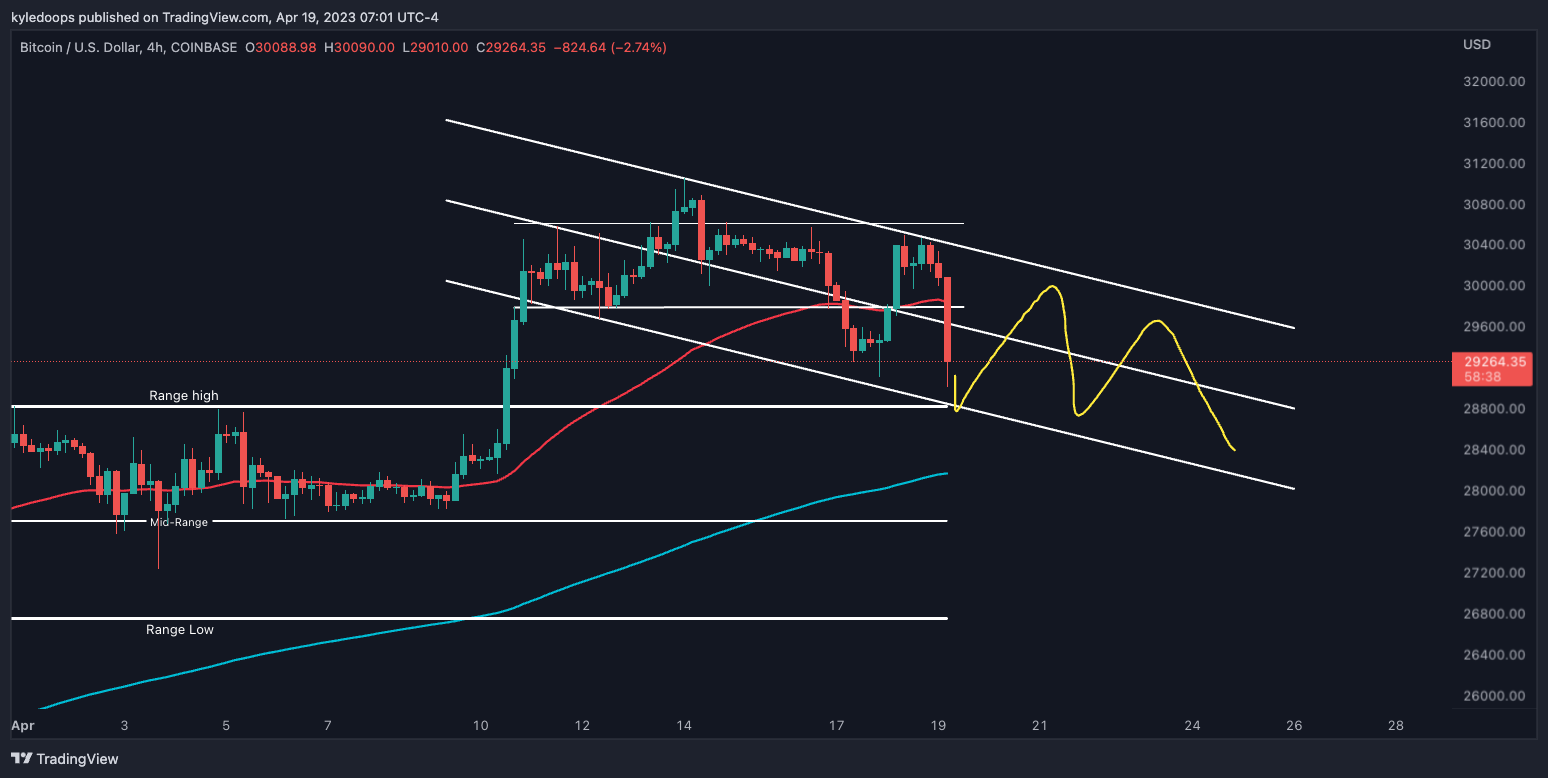
Chart #2 - Bitcoin (BTCUSD) 4-Hour Chart
Chartist: Kyle
(For the chart screenshot, click here.)
Bitcoin had a sudden sell-off this morning and could be forming a new channel to the downside.
If it follows the path outlined above, it could bounce from $28,822. But once that happens, we'll look for the next lower high, as the distribution may continue.
𝗣𝗿𝗶𝗺𝗲 𝗫𝗕𝗧
Sign up for a new Trading Account on Prime XBT!
Receive a deposit bonus of up to $7,000 with promo code: KyleDoops

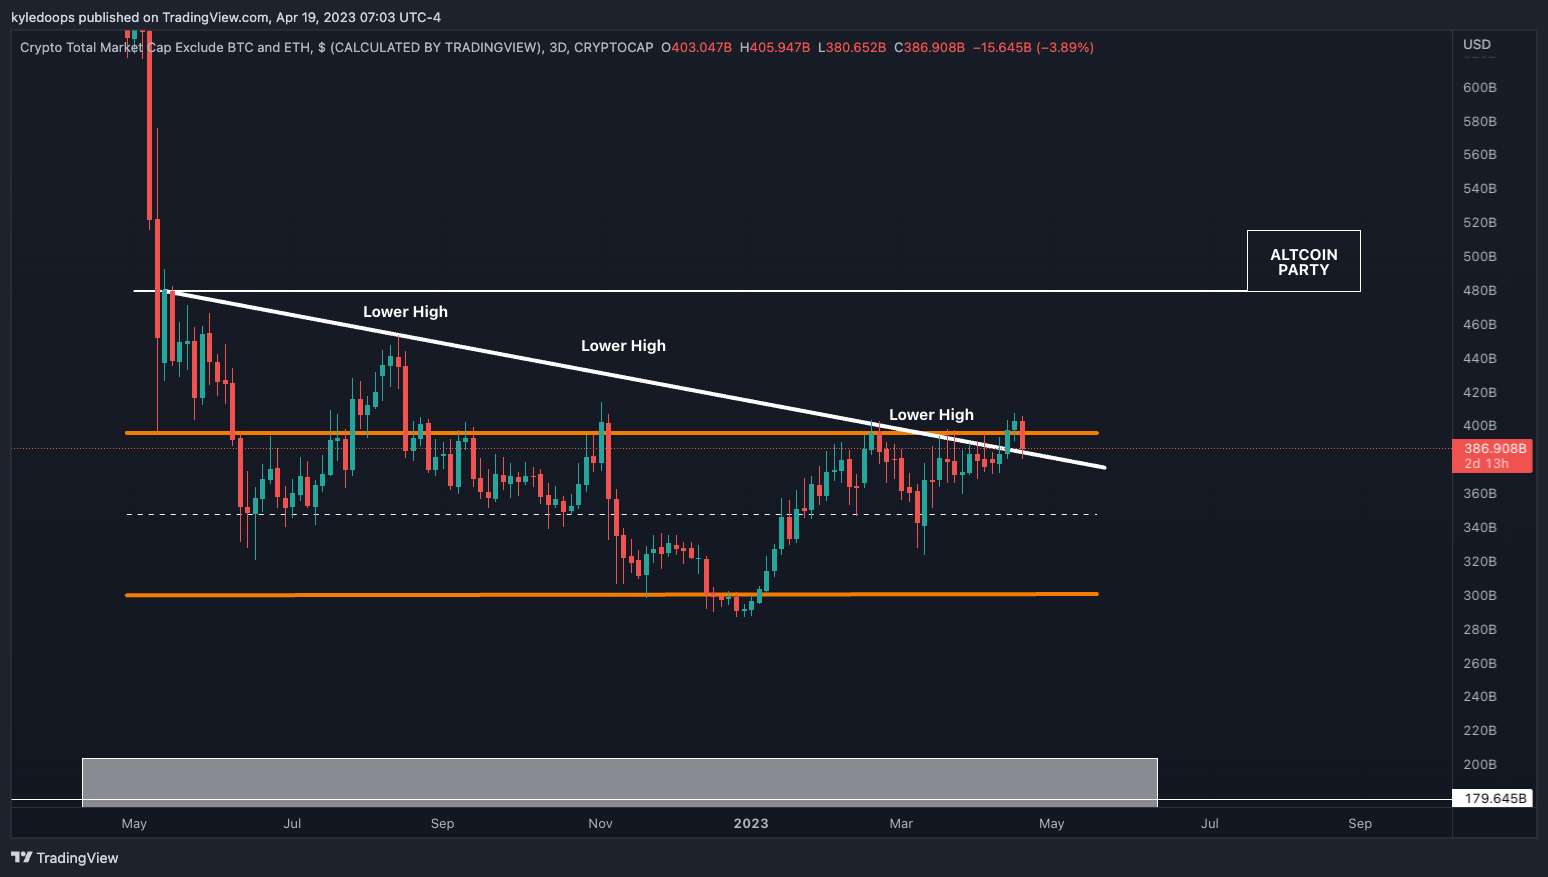
Chart #3 - TOTAL3 3-Day Chart
Chartist: Kyle
(For the chart screenshot, click here.)
The TOTAL3 has broken above two critical levels of resistance:
The diagonal downtrend.
Its horizontal resistance.
But it now needs to bounce from this level, and prices will need to pump higher.
If it can hold up the momentum and bounce, we would be looking at a potential move toward the next major upside resistance at $479B. A reclaim of that level will ignite altcoins, launching them upwards into an altcoin party!
Claim your Bitget sign-up bonuses here (details below).
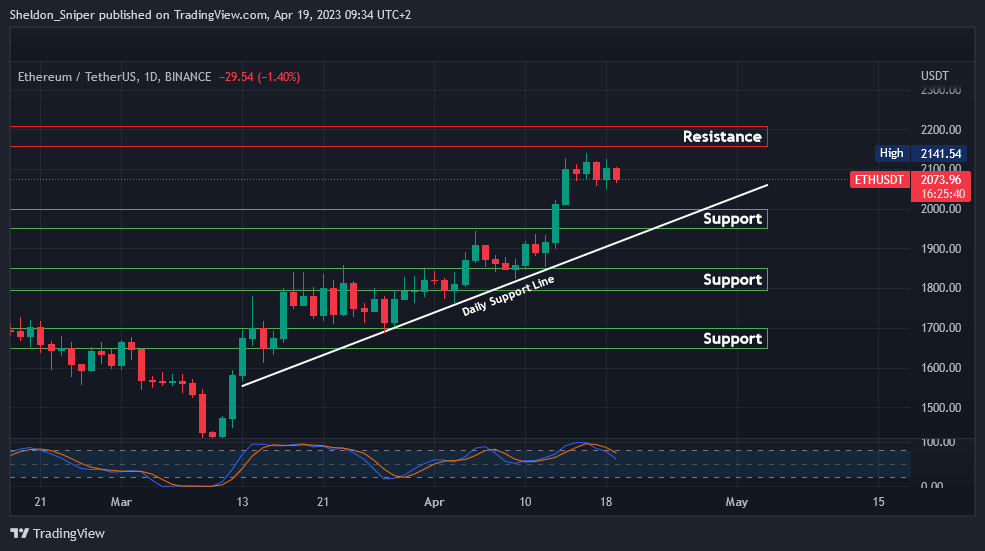
Chart #4 - Ethereum (ETHUSDT) 1-Day Chart
Chartist: Sheldon
(For the chart screenshot, click here.)
Over the last week, ETH has been consolidating just below the $2,150 - $2,200 resistance area. With the indicators showing the price is overbought on higher time frames, I am not sure if ETH will have a final push to its next resistance at $2,300.
If it gets rejected at the current resistance, it could test $1,950 - $2,000 (ascending daily support trend line). A break of that line would take it to $1,800 - $1,850.
Claim your Bitget sign-up bonuses here (details below).
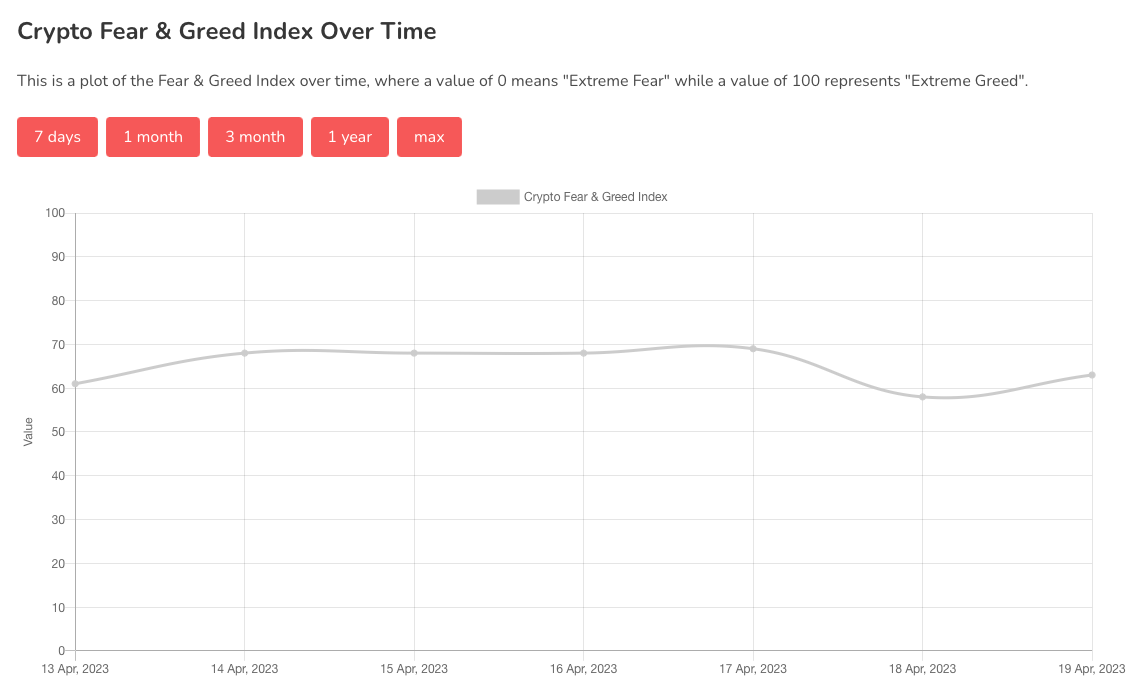
Chart #5 - Bitcoin Fear and Greed Index
The Bitcoin Fear and Greed Index is sitting at 63 today, indicating Greed.
The highest the index has been over the past seven days is 69, and the lowest is 58.
Banter’s Take
The market is flushing out the over-leveraged longs. We now need to wait for the prices to find some stability, following this sell-off, before jumping into new positions.
Stay safe my friends!
Go to our Crypto Banter Discord here where Sheldon and Kyle give updates on the charts and trades from The Daily Candle newsletter!
Bybit winner - 27060660
Would you be looking for a short on the next bitcoin lower high?