

📈📉 Massive Stacks short opportunity! CPI incoming!
📈📉 Massive Stacks short opportunity! CPI incoming!

Bitget winner - 1191312170
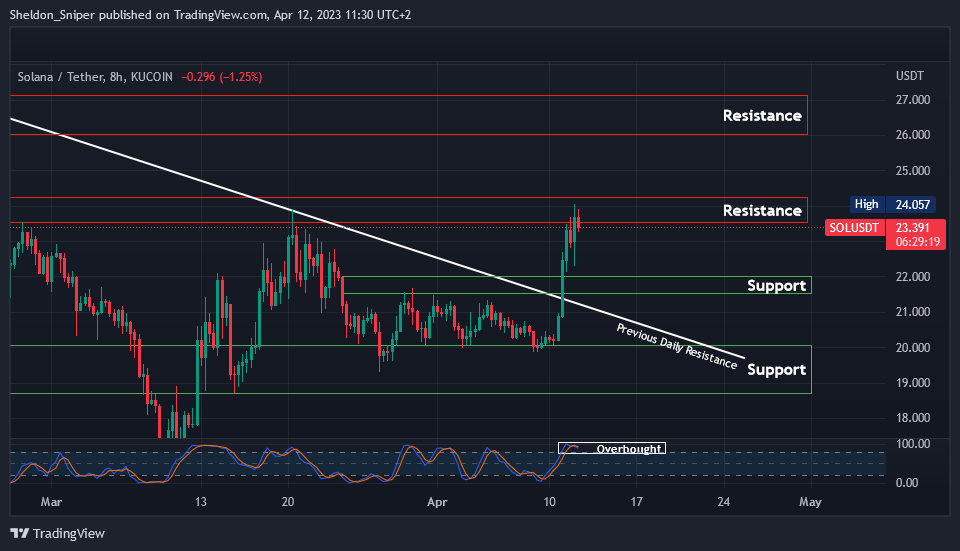
Chart #1 - Solana (SOLUSDT) 8-Hour Chart
Chartist: Sheldon
(For the chart screenshot, click here.)
Over the last two days, SOL has rallied by over 20%, going from $20 on Monday to this morning’s high of just over $24.
It is currently fluctuating between $23.50 - $24.00 and is overbought on medium time frames. If there is a rejection here, the price can retrace down to the next support at $21.50 - $22.00, or even retest the previous descending daily resistance line, which is now acting as support.
If SOL manages to break through $23.50 - $24.00 (resistance), it could head to $26.00 - $27.00 (an area SOL tested in February).
SOL has been behaving bullishly over the last few days, and I expect a lot more upside from it over the next couple of weeks.
𝗣𝗿𝗶𝗺𝗲 𝗫𝗕𝗧
Sign up for a new Trading Account on Prime XBT!
Receive a deposit bonus of up to $7,000 with promo code: SheldonSniper
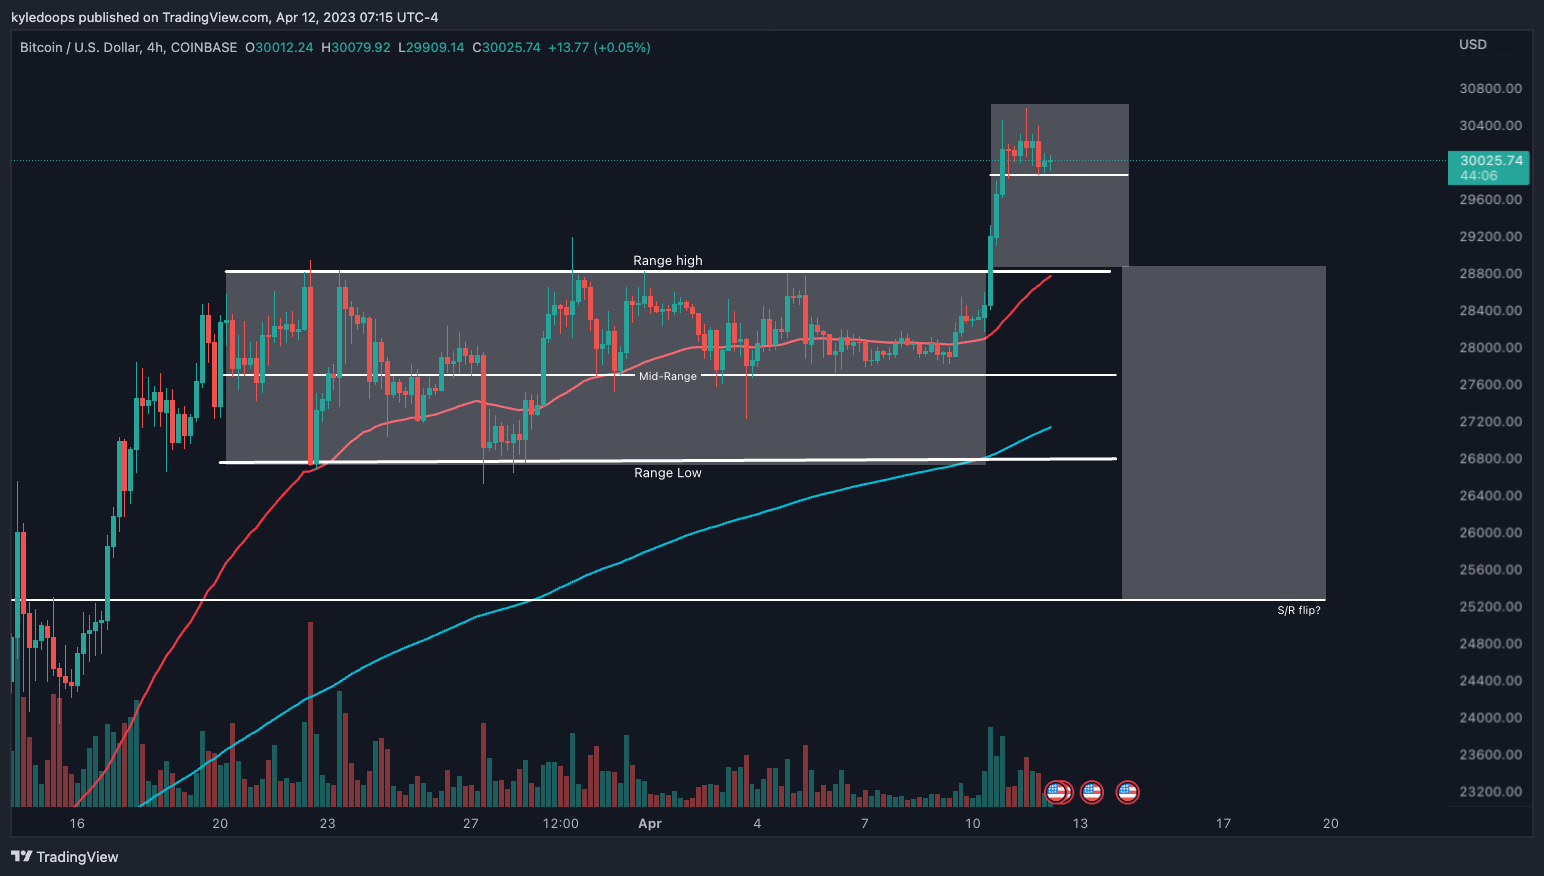
Chart #2 - Bitcoin (BTCUSD) 4-Hour Chart
Chartist: Kyle
(For the chart screenshot, click here.)
If you look at bitcoin on a 4-hour chart, you will notice a range that capped the price between $27,000 and $28,000 for a couple of days. Then the price pushed up into the current gray box.
If the CPI data comes out unfavorable today, there is a chance the price comes back down and distributes. That is a classical power-of-three pattern. Should it occur, I would be looking at $25,200 as the worst-case scenario before support is found.
Alternatively, should the 50 ema (red) hold, that could negate this idea and would mean that the price likely continues higher after a quick dip.
𝗣𝗿𝗶𝗺𝗲 𝗫𝗕𝗧
Sign up for a new Trading Account on Prime XBT!
Receive a deposit bonus of up to $7,000 with promo code: KyleDoops

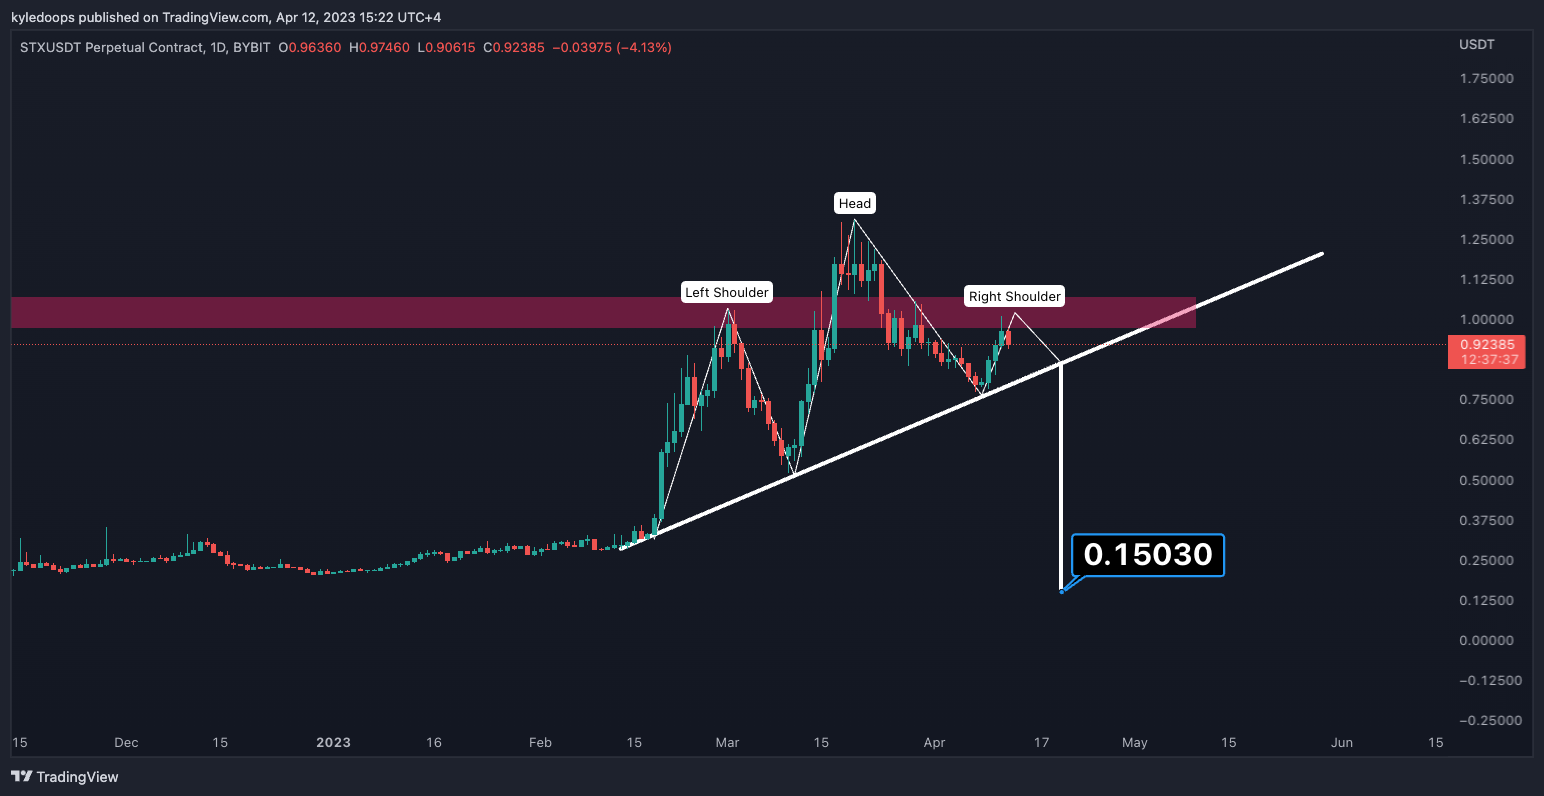
Chart #3 - Stacks (STXUSDT) 1-Day Chart
Chartist: Kyle
(For the chart screenshot, click here.)
STX has been incredibly hyped lately.
It's currently forming a head and shoulders pattern, which is textbook perfect on the daily chart. If the price rejects from the $1.00 region - strong horizontal resistance - I would watch for a break of the neckline. As soon as it breaks, we have a short trade right down to $0.15.
It's important to not front-run this idea, but instead, wait for a daily close below the neckline first.
Claim your Bitget sign-up bonuses here (details below).
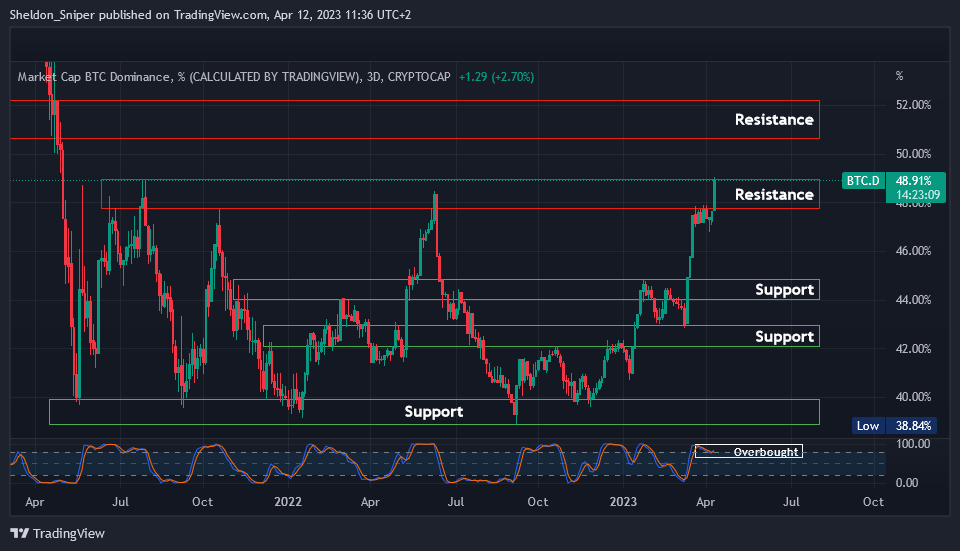
Chart #4 - Bitcoin Dominance (BTC.D) 3-Day Chart
Chartist: Sheldon
(For the chart screenshot, click here.)
Bitcoin has rallied from $28,400 to $30,000 and has caused Bitcoin Dominance to increase from 48% to 49%.
BTC.D has reached the top of its current resistance zone, and the indicators on higher time frames are overbought. Over the last two years, BTC.D has tested this area a few times, but has never managed to breach it. If it does, it should head to 50.5% - 52%.
If the story repeats though, and dominance gets rejected here, there is a chance of a test of the next major support area between 44% - 44.5% - that could be the altseason ignition many have been waiting for.
Claim your Bitget sign-up bonuses here (details below).
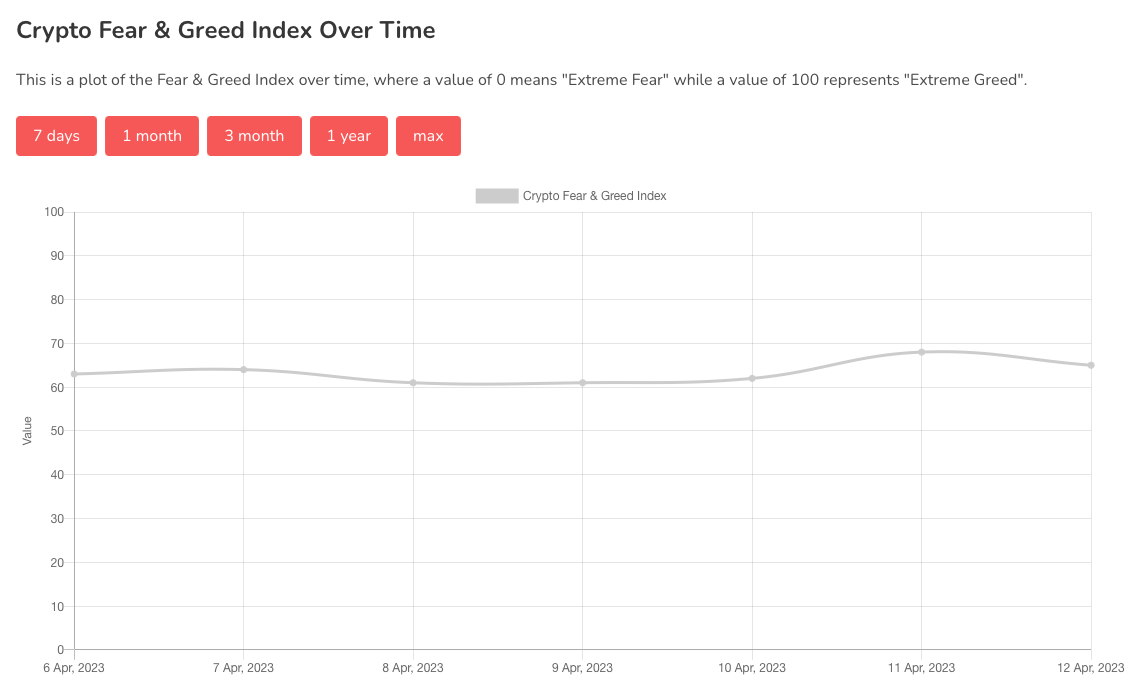
Chart #5 - Bitcoin Fear and Greed Index
The Bitcoin Fear and Greed Index is sitting at 65 today, indicating Greed.
The highest the index has been over the past seven days is 68, and the lowest is 61.
Overall Market Sentiment (Banter’s Take)
The market is waiting eagerly for the CPI inflation results. There may have been a bit of de-risking going into the event, which is why prices have come down. So long as CPI comes in as expected (or better), prices should continue to hold sideways. Until the high timeframe structure breaks, dips are opportunities.
Stay safe my friends!
Go to our Crypto Banter Discord here where Sheldon and Kyle give updates on the charts and trades from The Daily Candle newsletter!
Bybit winner - 2760694