

📈📉 MATIC and ETH Trade Setups
📈📉 MATIC and ETH Trade Setups
PLUS: ATOM Continues its Downtrend
Overview
Chart #1 - Polygon (MATICUSDT) 8-Hour
Chart #2 - Cosmos Hub (ATOMUSDT) Weekly
Chart #3 - Celestia (TIAUSDT) Daily
Chart #4 - Ethereum (ETHUSDT) Daily
Chart #5 - Fear and Greed Index
Chart #1 - Polygon (MATICUSDT) 8-Hour
Chartist: Sheldon
(For the chart screenshot, click here.)
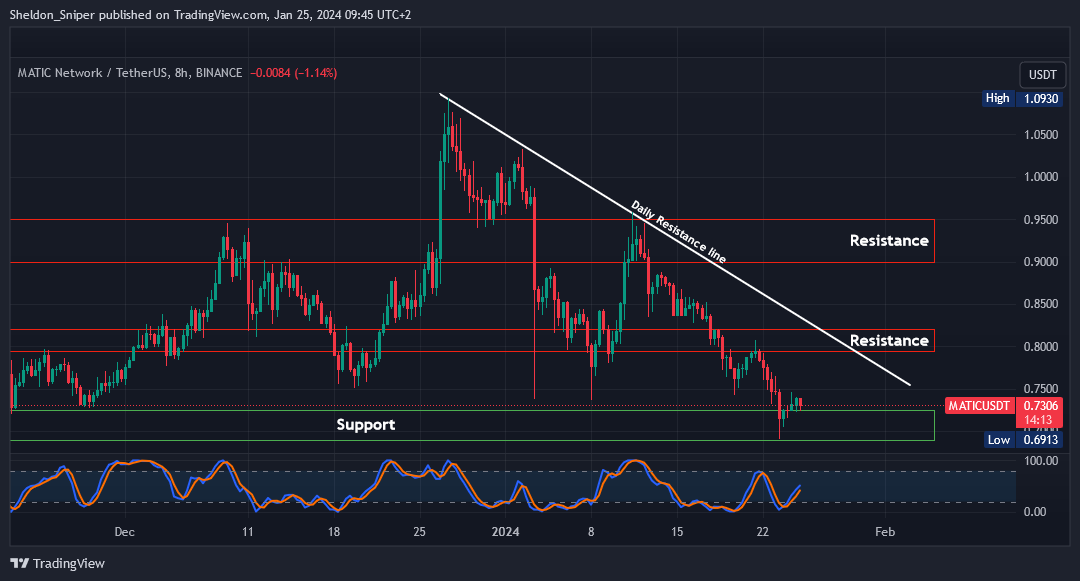
MATIC is testing the $0.73 level of support, where there is an opportunity for a spot long trade up to $0.795 - $0.82 followed by $0.90 - $0.95, where I intend to take profit.
The daily resistance line coming from the end of December also intersects the $0.795 - $0.82 area of resistance, and will act as additional resistance.
My stop loss will be just below the range low support at $0.69.
Sign-up and trade on Bybit today.
Exclusive $30,000 deposit rewards and bonuses up for grabs!
Chart #2 - Cosmos Hub (ATOMUSDT) Weekly
Chartist: Kyle

(For the chart screenshot, click here.)
ATOM has been on a downtrend for the past 30 days, and it appears that it will continue to follow Bitcoin's direction.
The two key weekly levels are $8.40 and $6.60, with the latter being the bottom of the previous cycle.
We will address these levels one at a time as the time comes and react to price action accordingly. In these circumstances, it is advisable to consider higher timeframes.
Claim your Bitget sign-up bonuses here (details below).

Outsmart 99% Of The Market!
Get full access into our Discord And Telegram group, where you'll find all of our premium content!
👉 Trade Signals!
👉 Trade Set-Ups!
👉 Trading Challenges!
👉 Education!
👉 SO MUCH MORE!
Chart #3 - Celestia (TIAUSDT) Daily
Chartist: Kyle

(For the chart screenshot, click here.)
TIA has been retracing since January 15th and is approaching the next support at $14.00, which also coincides with the 50 Daily MA.
If Bitcoin continues its downward movement, the MA may not be able to maintain the price above.
The next support area can be found at $10.15. The Stochastic RSI is in the oversold area; however, it's essential to wait for a cross up first and a clear move above the 20%.
Claim your Bitget sign-up bonuses here (details below).
Chart #4 - Ethereum (ETHUSDT) Daily
Chartist: Sheldon
(For the chart screenshot, click here.)
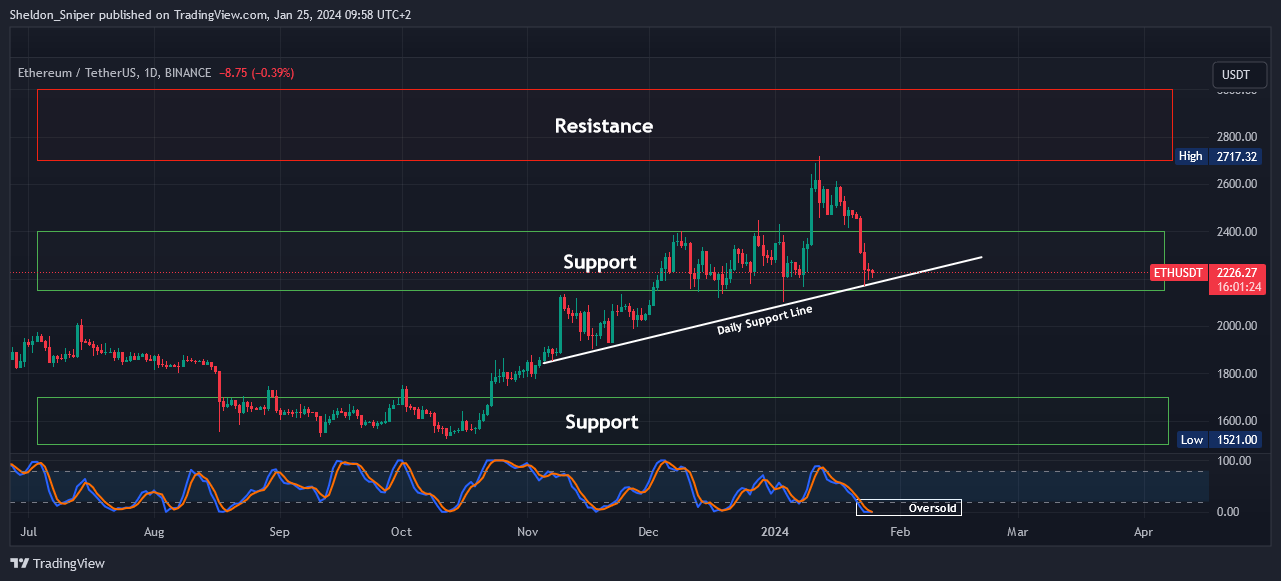
ETH has come down to the $2,200 lower range level of support, where the trend line from the beginning of November can be found.
With the price oversold, I am looking for a long spot trade in this area, with the plan of taking profit at the next area of resistance, at $2,700 - $3,000.
My stop loss will be just below the $2,200 support and the daily support line, at around $2,150.
Claim your Bitget sign-up bonuses here (details below).
Chart #5 - Fear and Greed Index
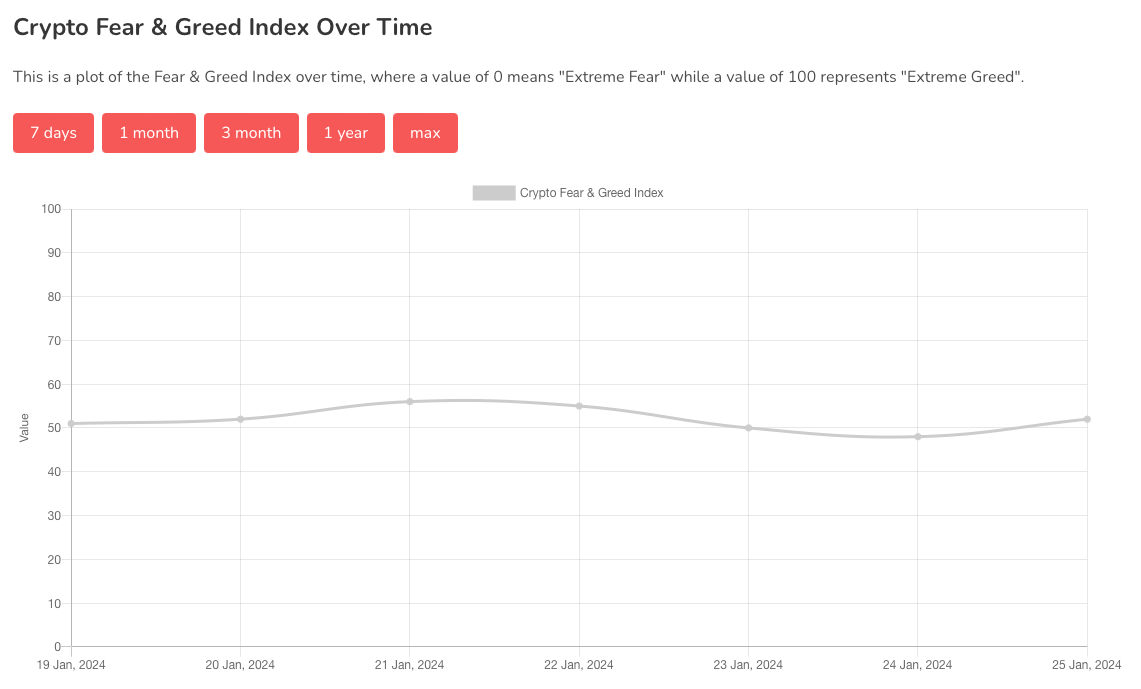
The Fear and Greed Index is sitting at 52 today, Neutral.
The highest the index has been over the past seven days is 56, and the lowest is 48.
Banter’s Take
Bitcoin bounced from $38,800 to $40,200 and has been trading in a local range above Monday's low. We might witness another upward move, possibly towards $42,000, followed by a potential drop closer to the 200 Daily MA. Technically, Bitcoin is forming Lower Highs and Lower Lows, so exercise caution with your entries.
Stay safe my friends!
Go to our Crypto Banter Discord here where Sheldon and Kyle give updates on the charts and trades from The Daily Candle newsletter!